Working with the Connectors Table
Stellar Cyber can connect to other resources in your network. This lets you collect information from your IdP, endpoint security, vulnerability scanners, and other systems, as well as to push actions to your firewalls. The connectors table lists all connectors that have been configured.
Some of the features of the Connectors table are:
-
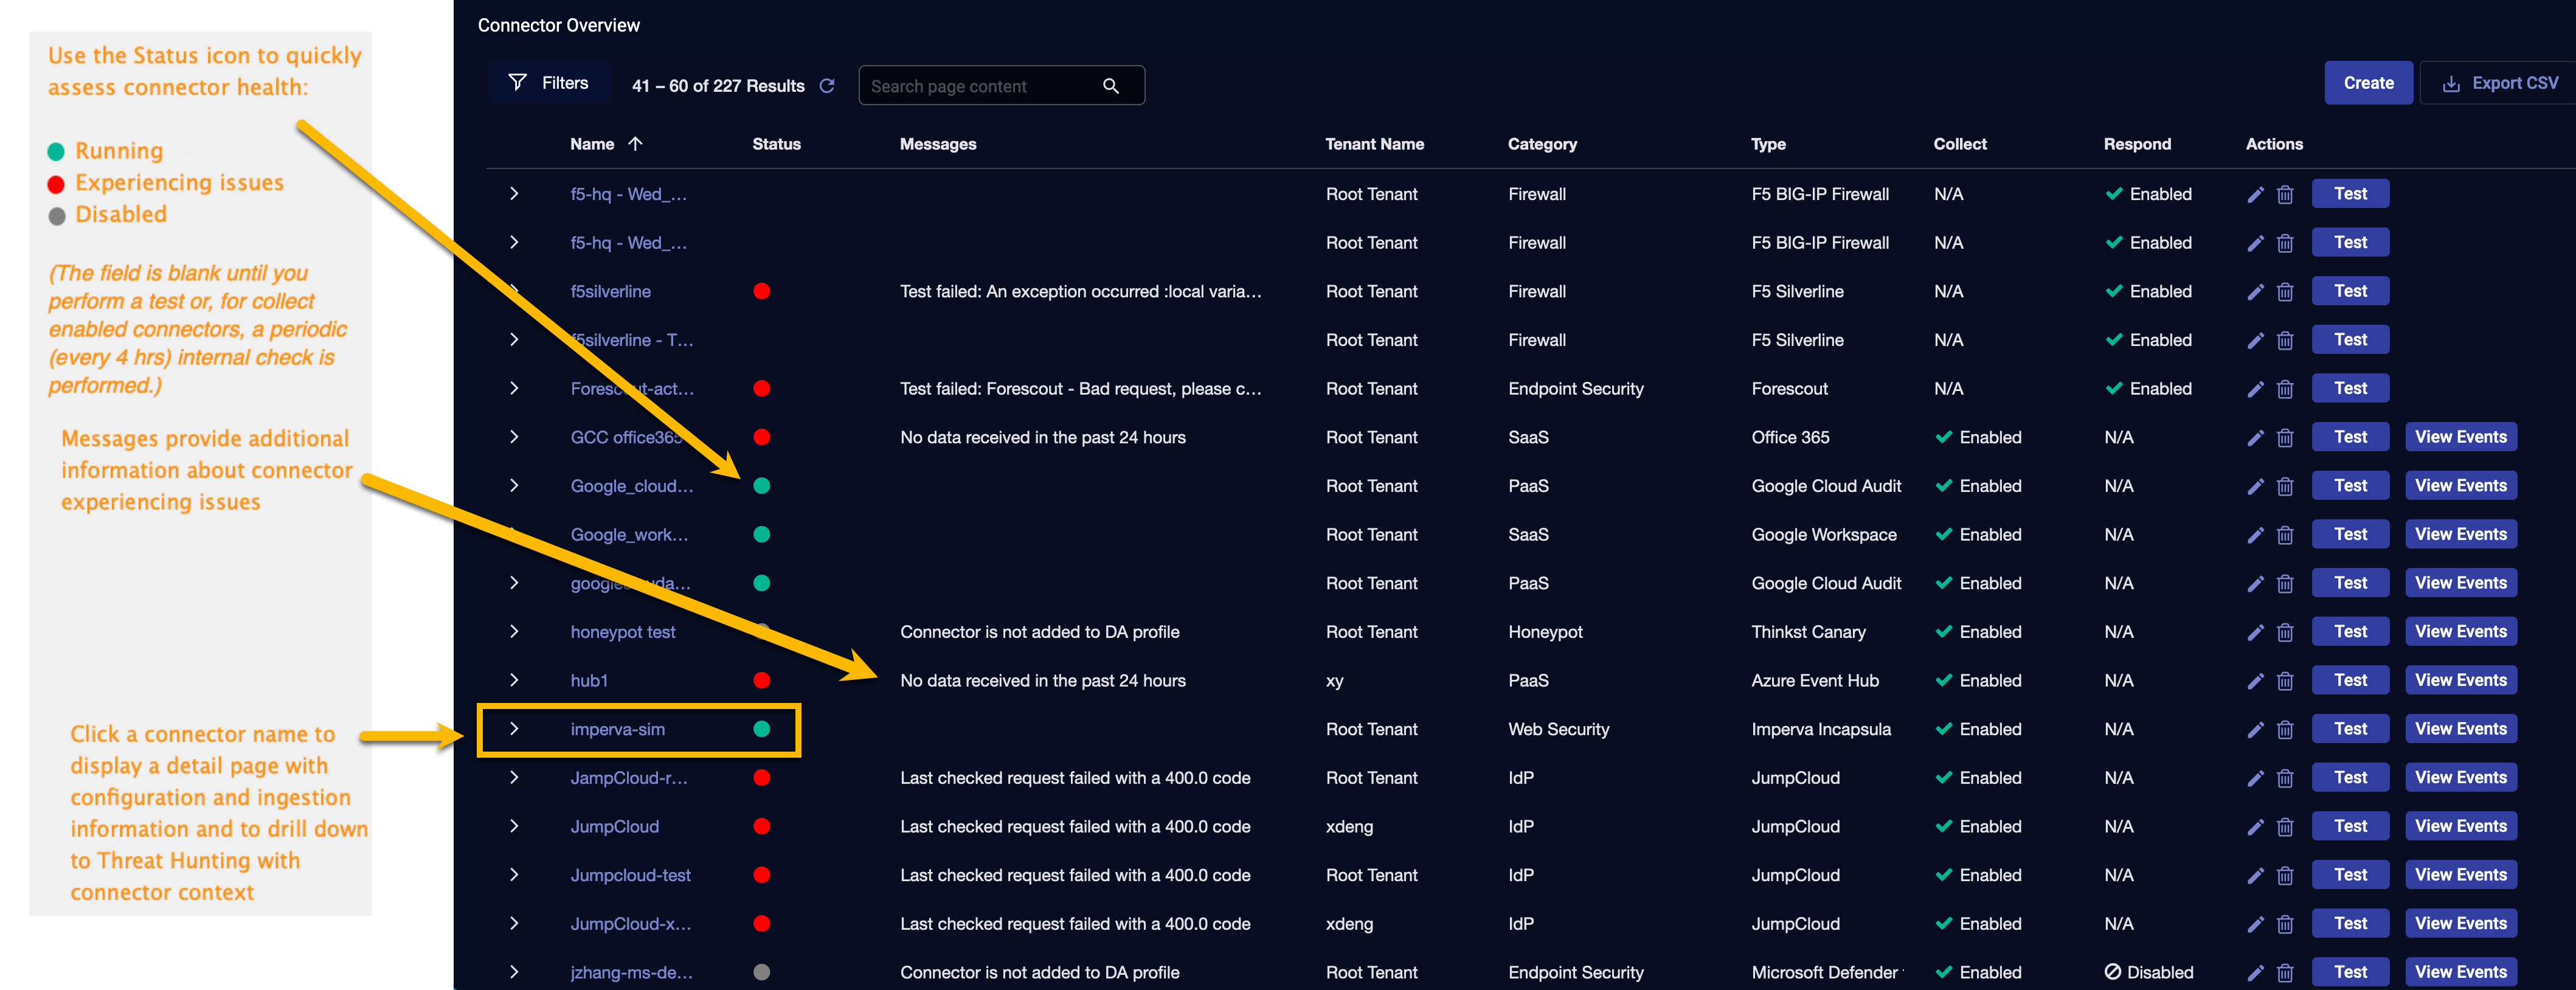
Use the Status icon to quickly assess connector health:
-
Green—Running
-
Red—Experiencing Issues
-
Gray—Disabled
-
-
View Messages to provide additional information about connectors experiencing issues.
-
Click a connector name to display a detail page with configuration and ingestion information and to drill down to Threat Hunting with connector context.
The table behaves like all other Stellar Cyber tables. You can change the displayed columns, sort by columns, and export the displayed list, for example. This table also includes a Last Activity column, which is the timestamp for the last successful activity for that connector.
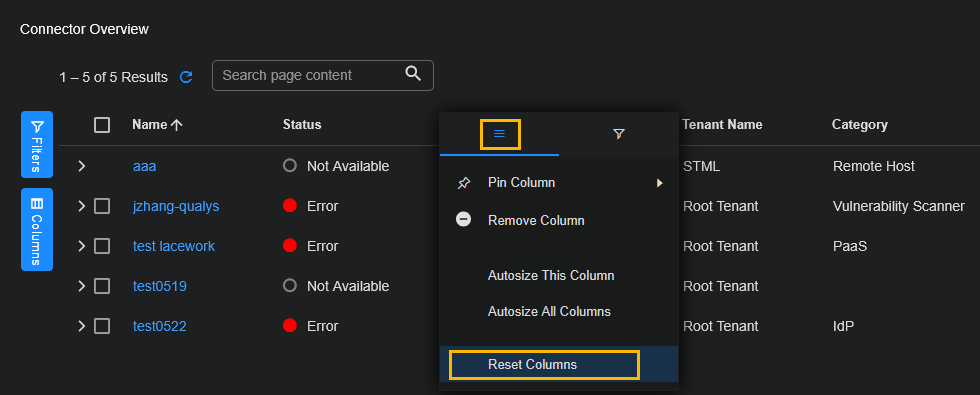
There are several columns in the Connectors table. To see the default columns, click the icon (![]() ) in the table header and select Reset Columns.
) in the table header and select Reset Columns.
To see all the columns that you can display in the table, click Columns. You can add or remove columns in the table using check boxes.
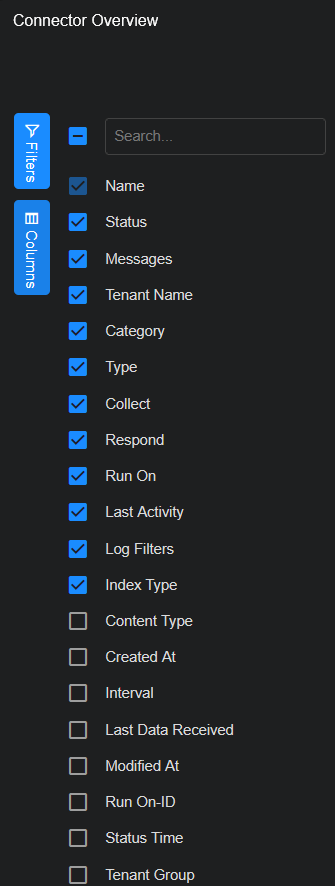
Some of the columns are as follows:
-
Name—the name of the connector
-
Category—the connector category, for example, IdP, Endpoint Security, or Firewall
-
Content Type—the content type of the logs, for example, Alerts or Events
-
Interval—the configured interval, for example, 5 minutes
-
Run On—the device on which the connector runs, for example, Data Processor
-
Status—the status of the connector. See Connector Status in Connector Table for details.
Use the following as a guide to understand the connector-specific operations you can perform in this table:
-
Collect column:
-
Active / Inactive toggle: When you enable the collect function of a connector during configuration, the collect function is deployed in an active (running) state on the Data Processor or the specified sensor. Use the toggle to switch the connector between Active and Inactive states without deleting it.
-
Disabled status: This indicates that the connector supports the Collect function but the feature is not enabled. You can edit the connector to activate the function.
-
N/A: Collect is not supported for this connector type.
-
-
Respond column:
-
Enabled status: This means that the function is supported and selected for that connector. Responders operate in a reactive manner, so the option to toggle to inactive is not offered for this function.
-
Disabled status: This indicates that the connector supports the Respond function but the feature is not enabled. You can edit the connector to activate the function.
-
N/A: Respond is not supported for this connector type.
-
-
View Events button:
This button is displayed for applicable connectors and allows you to jump to a Threat Hunting view that is filtered on the selected connector. This feature is not applicable for respond-only connector types such as Firewalls or Remote SSH.
-
Export CSV button:
This button lets you export the table as a spreadsheet file. You can export Selected Columns or All Columns. The spreadsheet is downloaded to your Downloads folder.
-
Select View button:
This button lets you preserve a table layout. See Saved View Configurations for details.
For a list of connectors and their supported functions, refer to: Connector Types & Functions.
Use this topic to understand how to:
- Add a new connector
- Edit an existing connector
- Test a connector
- Delete a connector
- Analyze connector details
- View full connector details
For guidance ingesting log data, refer to Ingesting Logs.
Connector Status in Connector Table
The connector status is displayed in the Connector table in the Status column. There are different colors for different statuses in the user interface. In addition, a message displays when you hover over the Status, for example: No data received in the past 24 hours.
| Category | Status Priority | Color | Number |
Message |
Description |
|---|---|---|---|---|---|
| Status not available | 1 | Clear |
-1 |
Status not available |
Connector status is not supported for this connector. |
| Status not available | 1 | Clear | -1 |
Status not available, please upgrade the sensor |
The sensor the connector runs on must be upgraded to the latest version to support connector status. |
| Connector is inactive | 2 | Grey | 1 |
Collect is inactive |
Connector is not set to active. |
| Last activity failed | 3 | Red | 2 |
{{Fail reason}}” or “Last checked request failed with a {{http or status}} code |
Request from connector failed. If a properly formatted error message was returned that will be displayed, else only the code. |
| Test failed | 3 | Red | 4 |
Test failed: {{}} |
Test failed, and the reason will be displayed if there was a properly formatted error message. |
| No data in the past 24 hours | 4 | Amber | 3 |
No data received in the past 24 hours |
The connector is active ( |
| Healthy | - | Green | 0 |
Nil |
None of the listed issues. |
Notes:
-
Color is shown in the UI. The connector record from the connector API will have
status.codefor Number, andstatus.messagefor Message. Automatic connector status is only available for Collect-enabled sensors. Respond-only connectors will get their status only through connector tests. -
Status Priority is the order of status overwriting the rest. Test failed will overwrite Last activity failed when a test is performed, but if there is failed activity in the automatic checks, Last activity failed will overwrite to show what could be the latest error as the time window for checking failed activity is 15 minutes ago to present time.
Successfully receiving data will clear Last activity failed, Test failed, and No data in the past 24 hours if status is available for the connector and the connector is active. Status is updated every 5 minutes unless a test is performed.
-
Invalid credentials or configurations may not generate requests that will trigger Last activity failed. Unless you run a test, this status may remain as No data received in the past 24 hours.
Adding and Editing Connectors
Adding and editing provide the same configuration options; the only difference is that you cannot edit the General configuration options. Click Create and select Connector to create a new connector or click ![]() to edit an existing connector.
to edit an existing connector.
After you have obtained the credentials for your external service and configured API or other access for Stellar Cyber community, there are three basic steps to configuring a connector in Stellar Cyber.
For detailed steps on obtaining credentials, configuring, and testing specific connectors, select your connector from the Connector Types & Functions.
For a quick overview, click through the slides below:
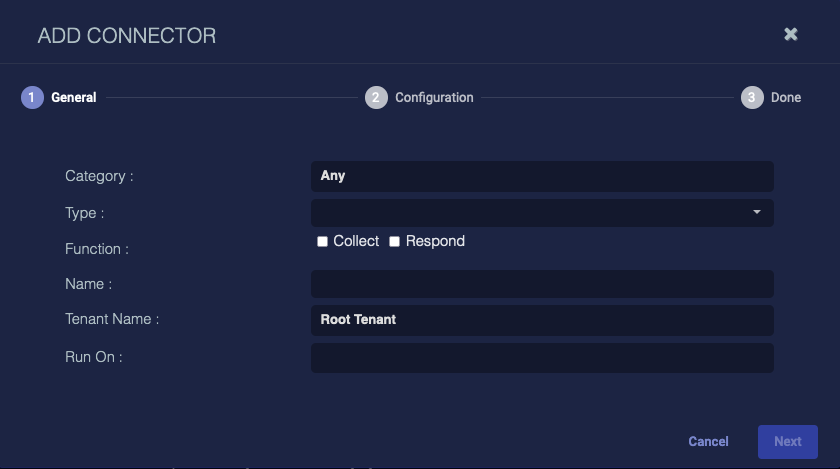
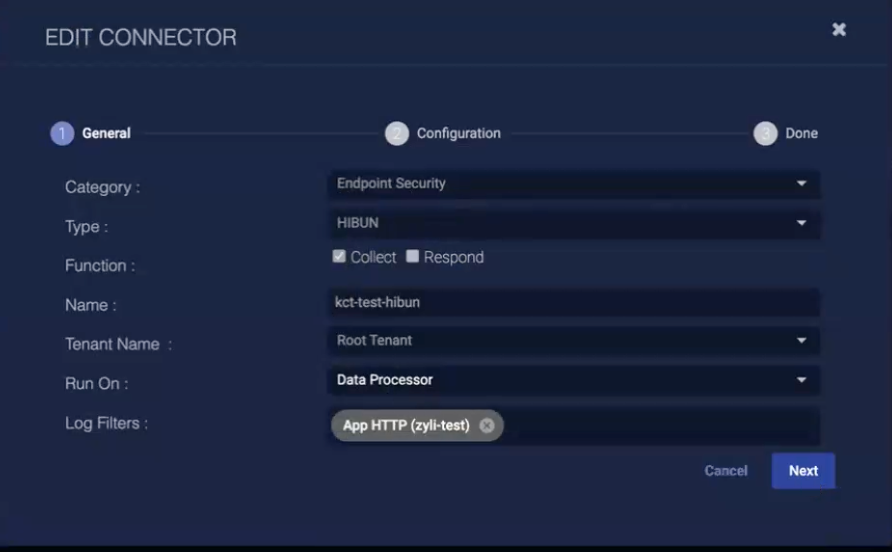
1. Select
Select the basic attributes, such as the category and type, who can use it, and where it runs. The options for Collect and Respond are enabled based on the capabilities of the specific connector type you select.
-
Certain connectors can be run on either a Sensor or a Data Processor. The available devices are displayed in the Run On menu. If you want to associate your collector with a sensor, you must have configured that sensor prior to configuring the connector or you will not be able to select it during initial configuration.
-
If the device you're connecting to is on premises, we recommend you run on the local sensor. If you're connecting to a cloud service, we recommend you run on the DP.
Connectors may display the Log Filters field. For information, see Managing Log Filters.
2. Configure
The configuration dialog varies for each connector type. This example illustrates the configuration dialog for the Endpoint Security | Microsoft Defender connector.
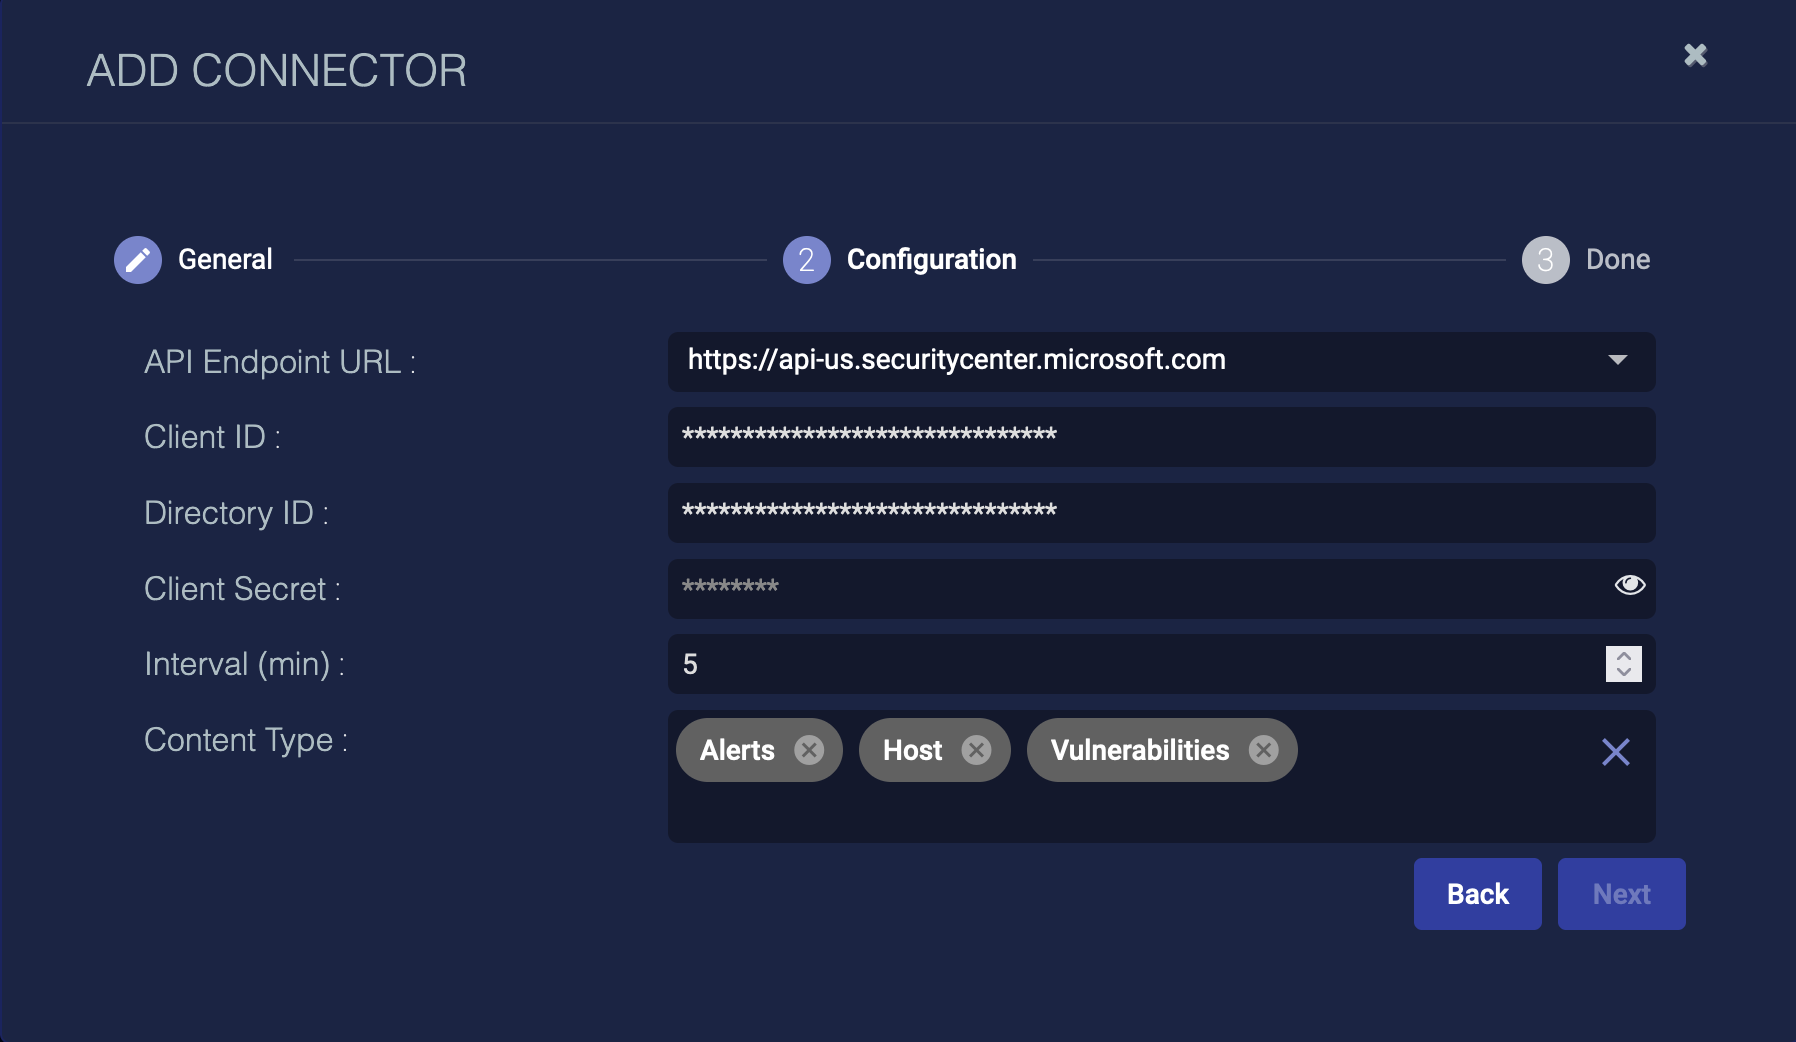
The first time you add a Collect connector to a profile, it pulls data immediately and then not again until the scheduled interval has elapsed. If the connector configuration dialog did not offer an option to set a specific interval, it is run every five minutes. Exceptions to this default interval are the Proofpoint on Demand (pulls data every 1 hour) and Azure Event Hub (continuously pulls data) connectors. The intervals for each connector are listed in the Connector Types & Functions topic.
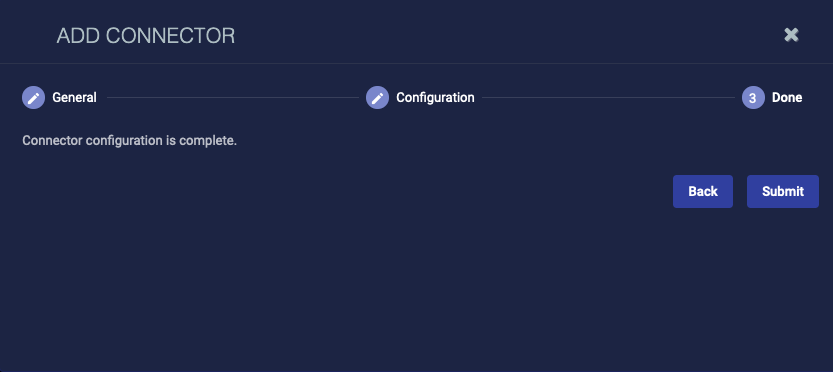
3. Confirm
After you finish the configuration in the previous dialog, your changes are still pending until you click Submit from this final confirmation dialog.
Testing a Connector
When you add (or edit) a connector, we recommend that you run a test to validate the connectivity parameters you entered. The test validates authentication and connectivity.
For connectors running on a sensor, Stellar Cyber recommends that you allow 30-60 seconds for new or modified configuration details to be propagated to the sensor before performing a test.
-
Click System | INTEGRATIONS | Connectors. The Connector Overview appears.
-
Locate the connector by name that you added, or modified, or that you want to test.
-
Click Test at the right side of that row. The test runs immediately.
Note that you may run only one test at a time.
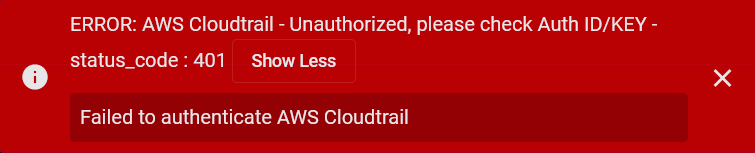
Stellar Cyber conducts a basic connectivity test for the connector and reports a success or failure result. A successful test indicates that you entered all of the connector information correctly.
To aid troubleshooting your connector, the dialog remains open until you explicitly close it by using the X button. If the test fails, you can select the button from the same row to review and correct issues.
The connector status is updated every five (5) minutes. A successful test clears the connector status, but if issues persist, the status reverts to failed after a minute.
Repeat the test as needed.


If the test fails, the common HTTP status error codes are as follows:
| HTTP Error Code | HTTP Standard Error Name | Explanation | Recommendation |
|---|---|---|---|
| 400 | Bad Request | This error occurs when there is an error in the connector configuration. |
Did you configure the connector correctly? |
| 401 | Unauthorized |
This error occurs when an authentication credential is invalid or when a user does not have sufficient privileges to access a specific API. |
Did you enter your credentials correctly? Are your credentials expired? Are your credentials entitled or licensed for that specific resource? |
| 403 | Forbidden | This error occurs when the permission or scope is not correct in a valid credential. |
Did you enter your credentials correctly? Do you have the required role or permissions for that credential? |
| 404 | Not Found | This error occurs when a URL path does not resolve to an entity. | Did you enter your API URL correctly? |
| 429 | Too Many Requests |
This error occurs when the API server receives too much traffic or if a user’s license or entitlement quota is exceeded. |
The server or user license/quota will eventually recover. The connector will periodically retry the query. If this occurs unexpectedly or too often, work with your API provider to investigate the server limits, user licensing, or quotas. |
For a full list of codes, refer to HTTP response status codes.
Testing Connectors in Bulk
You can select several connectors to test them in bulk. You can select up to 10 connectors. Do not navigate away from the test page while the tests are running or the process may halt.
To test connectors in bulk:
-
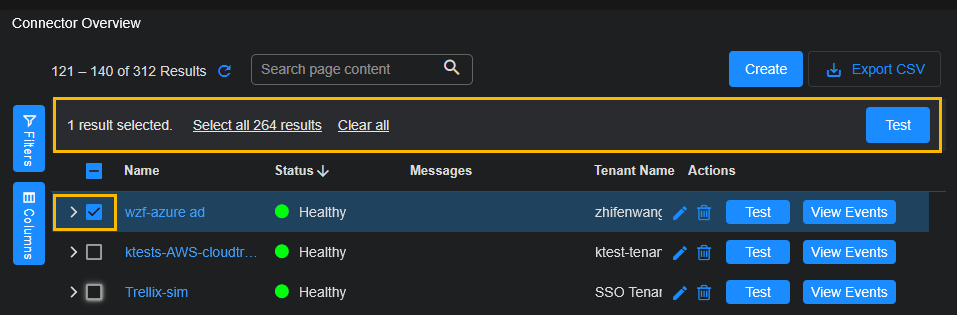
Select at least one connector in the Connectors table using the check box on the left. A new heading row is displayed with a Test button, as well as a Clear all option.
-
Using the check boxes, select up to 10 connectors to test in bulk. If you select more than 10 connectors, the following message is displayed and the Test button is no longer available.

-
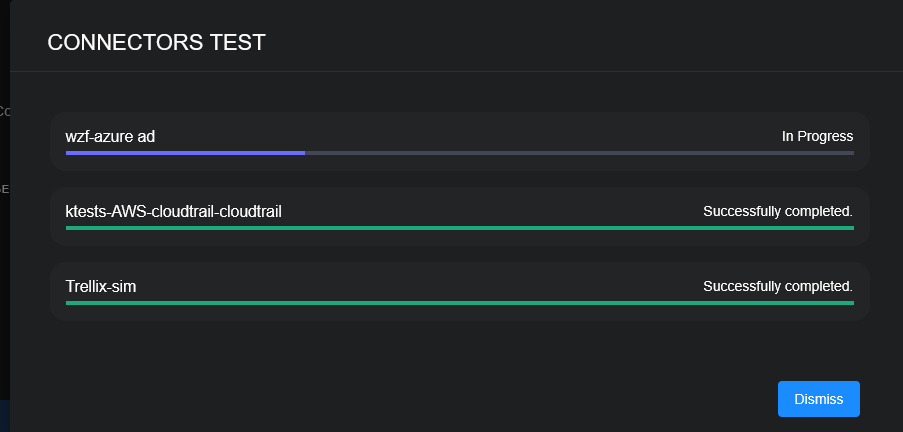
When you have the desired connectors selected, click the Test button in the heading row. The Connectors Test dialog is displayed, which shows the progress of each test. Also note that in the background, any running tests are displayed as In Progress.
-
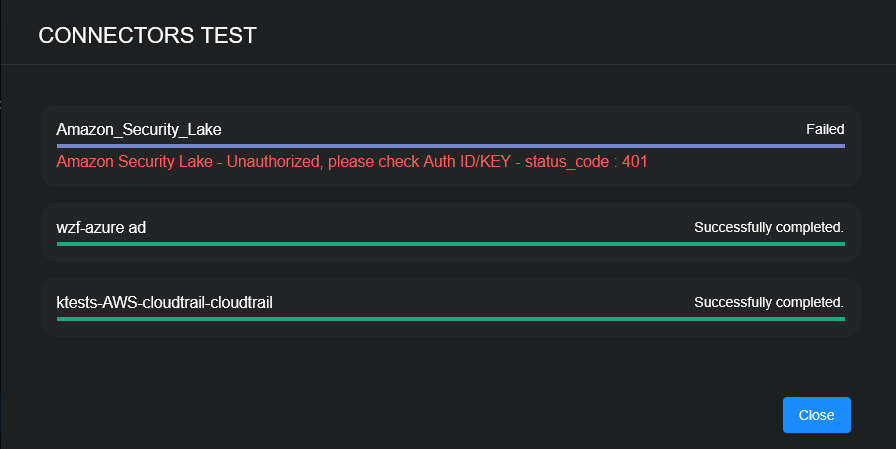
View the results of the tests in the Connectors Test dialog. Successfully completed tests are displayed in green, while Failed tests are displayed with red text. A failed test may produce a status code.
-
Click Close to exit the Connectors Test dialog.
-
You can click Clear all to remove the check box selections.
While tests are running, do not navigate away from the Connectors Test dialog as it may halt the testing process. The following message is displayed.
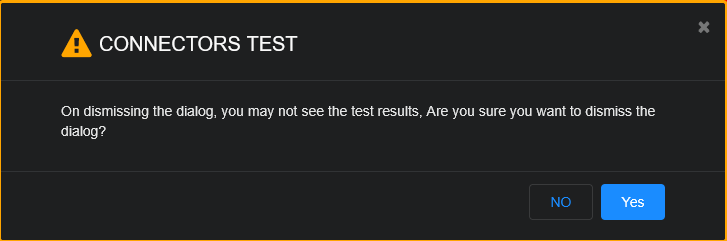
Click No to let the tests continue running.
Deleting a Connector
-
Click System | INTEGRATIONS | Connectors.
-
Click next to the connector you want to delete. A confirmation dialog box appears.
-
Click OK. The connector and configuration information are immediately deleted.
Analyzing Connector Details
Connectors send statistics to the DP, quantifying the data being sent and its source once per minute. This data is stored in the Sensor Monitoring (aella-ade) index on the DP. You can analyze this data using the Threat Monitoring interface (see procedure below).
-
Log in to Stellar Cyber.
-
Navigate to Threat Hunting.
-
Click the Indices dropdown and make sure that the Sensor Monitoring index is selected.
-
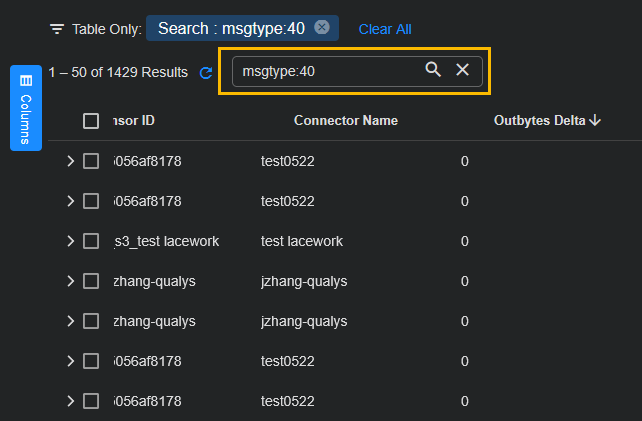
Scroll down to the Document table, enter msgtype:40 in the Search field, and press Enter. This is the msgtype that quantifies ingestion by connector.
-
The table updates to show all entries passing the global filters at the top of the display for Message Type 40. You can add the Connector Name column to the table to see where the data came from.
Some key fields to look for are as follows:
-
engid_name—the name of the connector
-
http_code—the return code from the API
-
in_bytes_delta—the size of the events pulled
-
in_records_delta—the number of events sent to the DP
-
out_bytes_delta—the size of the messages pulled
-
out_records_delta—the number of events sent to the DP
-
Viewing Full Connector Details
Click the down arrow on the Connector Overview page to view full details for a connector.
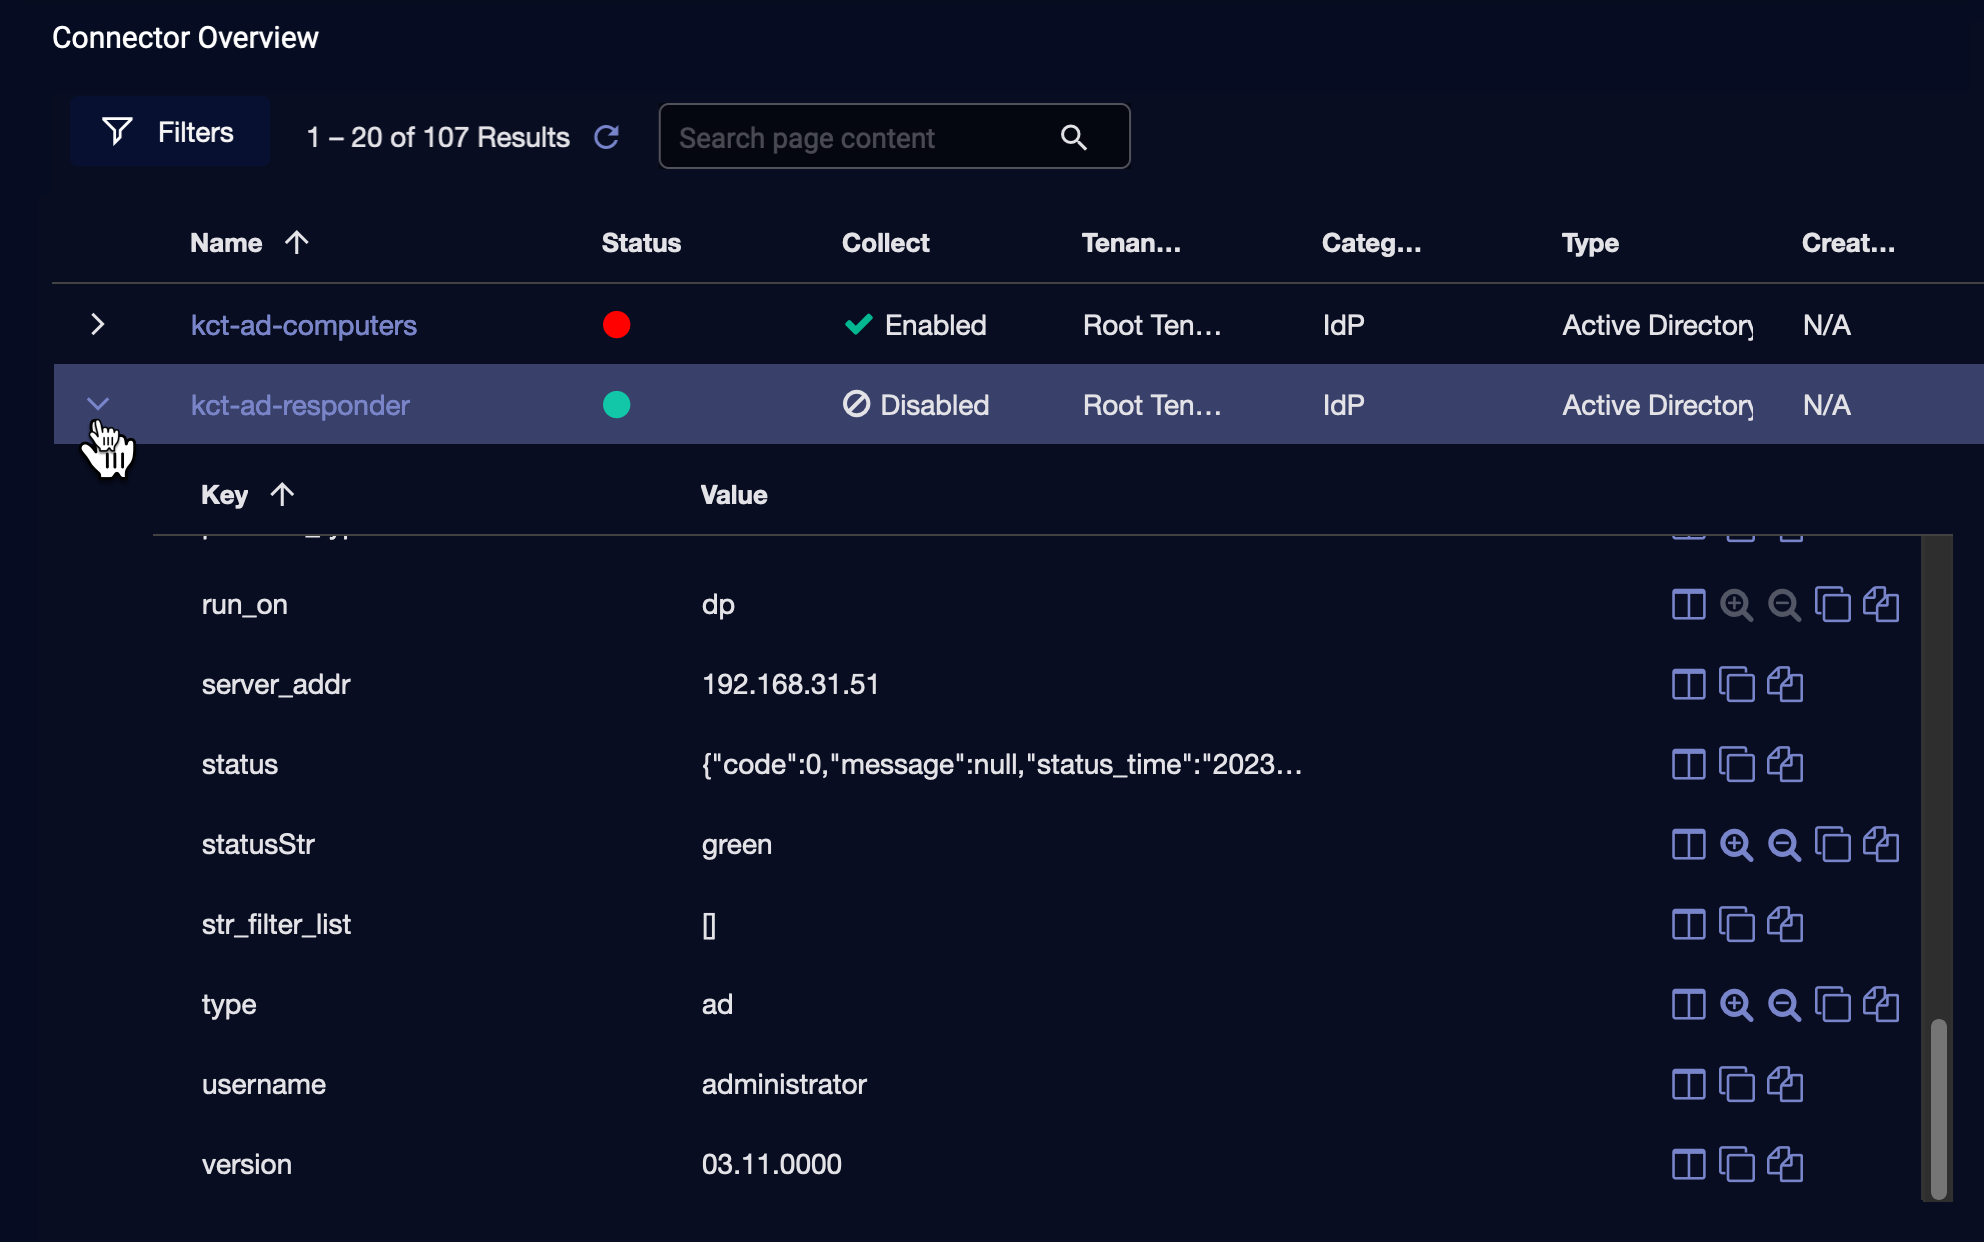
Some of the fields are as follows:
Fields do not display if they are None or if they do not apply.
-
category—the connector category, for example, idp, email, firewall
-
content_type—the content type of the logs, for example, ["events"] or ["threats"]
-
interval—the configured interval
-
log_type—the type of log, for example, ad (Active Directory) or proofpoint_tap
-
run_on—the device on which the connector runs, for example, dp (Data Processor)
-
status—the information about the status:
{"code":3,"message":"No data received in the past 24 hours","status_time":"2023-11-02 11:24:26"}
-
code—the status code from 0 to 4 as follows:
CONNECTOR_HEALTHY_CODE = 0
CONNECTOR_NOT_ADDED_TO_DA_CODE = 1
CONNECTOR_ACTIVITY_FAIL_CODE = 2
CONNECTOR_NO_DATA_CODE = 3
CONNECTOR_TEST_FAIL_CODE = 4
-
message—the status message associated with the code
-
status_time—the status timestamp
-
