Configuring Acronis Cyber Protect Cloud Connectors
This connector allows Stellar Cyber to ingest logs from Acronis Cyber Protect Cloud and add the records to the data lake. This connector integrates with the Acronis API to query alerts and agents.
Stellar Cyber connectors with the Collect function (collectors) may skip collecting some data when the ingestion volume is large, which potentially can lead to data loss. This can happen when the processing capacity of the collector is exceeded.
Connector Overview: Acronis Cyber Protect Cloud
Capabilities
-
Collect: Yes
-
Respond: No
-
Native Alerts Mapped: Yes
-
Runs on: DP
-
Interval: Configurable
Collected Data
|
Content Type |
Index |
Locating Records |
|---|---|---|
|
Alerts Agents (automatically set) |
Syslog Assets (agents only, not alerts) |
Domain
|
<Host URL> where <Host URL> is a variable from the configuration of this connector |
Response Actions
N/A
Third Party Native Alert Integration Details
This connector ingests logs from Acronis Cyber Protect Cloud to get the raw alerts that are stored in the Syslog index.
Stellar Cyber maps Acronis Cyber Protect Cloud alerts. The alerts are read from the Syslog index, enriched with Stellar Cyber fields, and mapped (with de-duplication) to the Alerts index.
The following four alert types are supported: Email security, EDR, Antimalware protection, and URL filtering. Tactic and Technique are based on alert type.
For details, see Integration of Third Party Native Alerts.
Required Credentials
-
Host URL (data center URL), Client ID, Client Secret
Locating Records
To search the alerts in the Alerts index, use the query: msg_class: acronis_cyber_protect_alert
To search the Original Records in the Syslog index, use the query: msg_class: acronis_cyber_protect_alert
Let us know if you find the above overview useful.
Adding an Acronis Cyber Protect Cloud Connector
To add an Acronis Cyber Protect Cloud connector:
Obtaining Acronis Cyber Protect Cloud Credentials
Before you configure the connector in Stellar Cyber, you must obtain the following Acronis Cyber Protect Cloud credentials:
-
Client ID
-
Client Secret
-
Host URL (data center URL)
Follow the guidance in Acronis Cyber Protect Cloud documentation for Creating an API client.
-
Using an administrator account role, log in to the management portal.
-
Click Settings | API clients | Create API client.
-
Enter a name for the API client.
-
Click Next.
-
Copy and save the ID and secret value of the client and the data center URL.
Store the ID and secret value in a safe location. The secret value cannot be retrieved later although it can be reset.
-
Click Done.
Adding the Connector in Stellar Cyber
To add an Acronis Cyber Protect Cloud connector in Stellar Cyber:
-
Log in to Stellar Cyber.
-
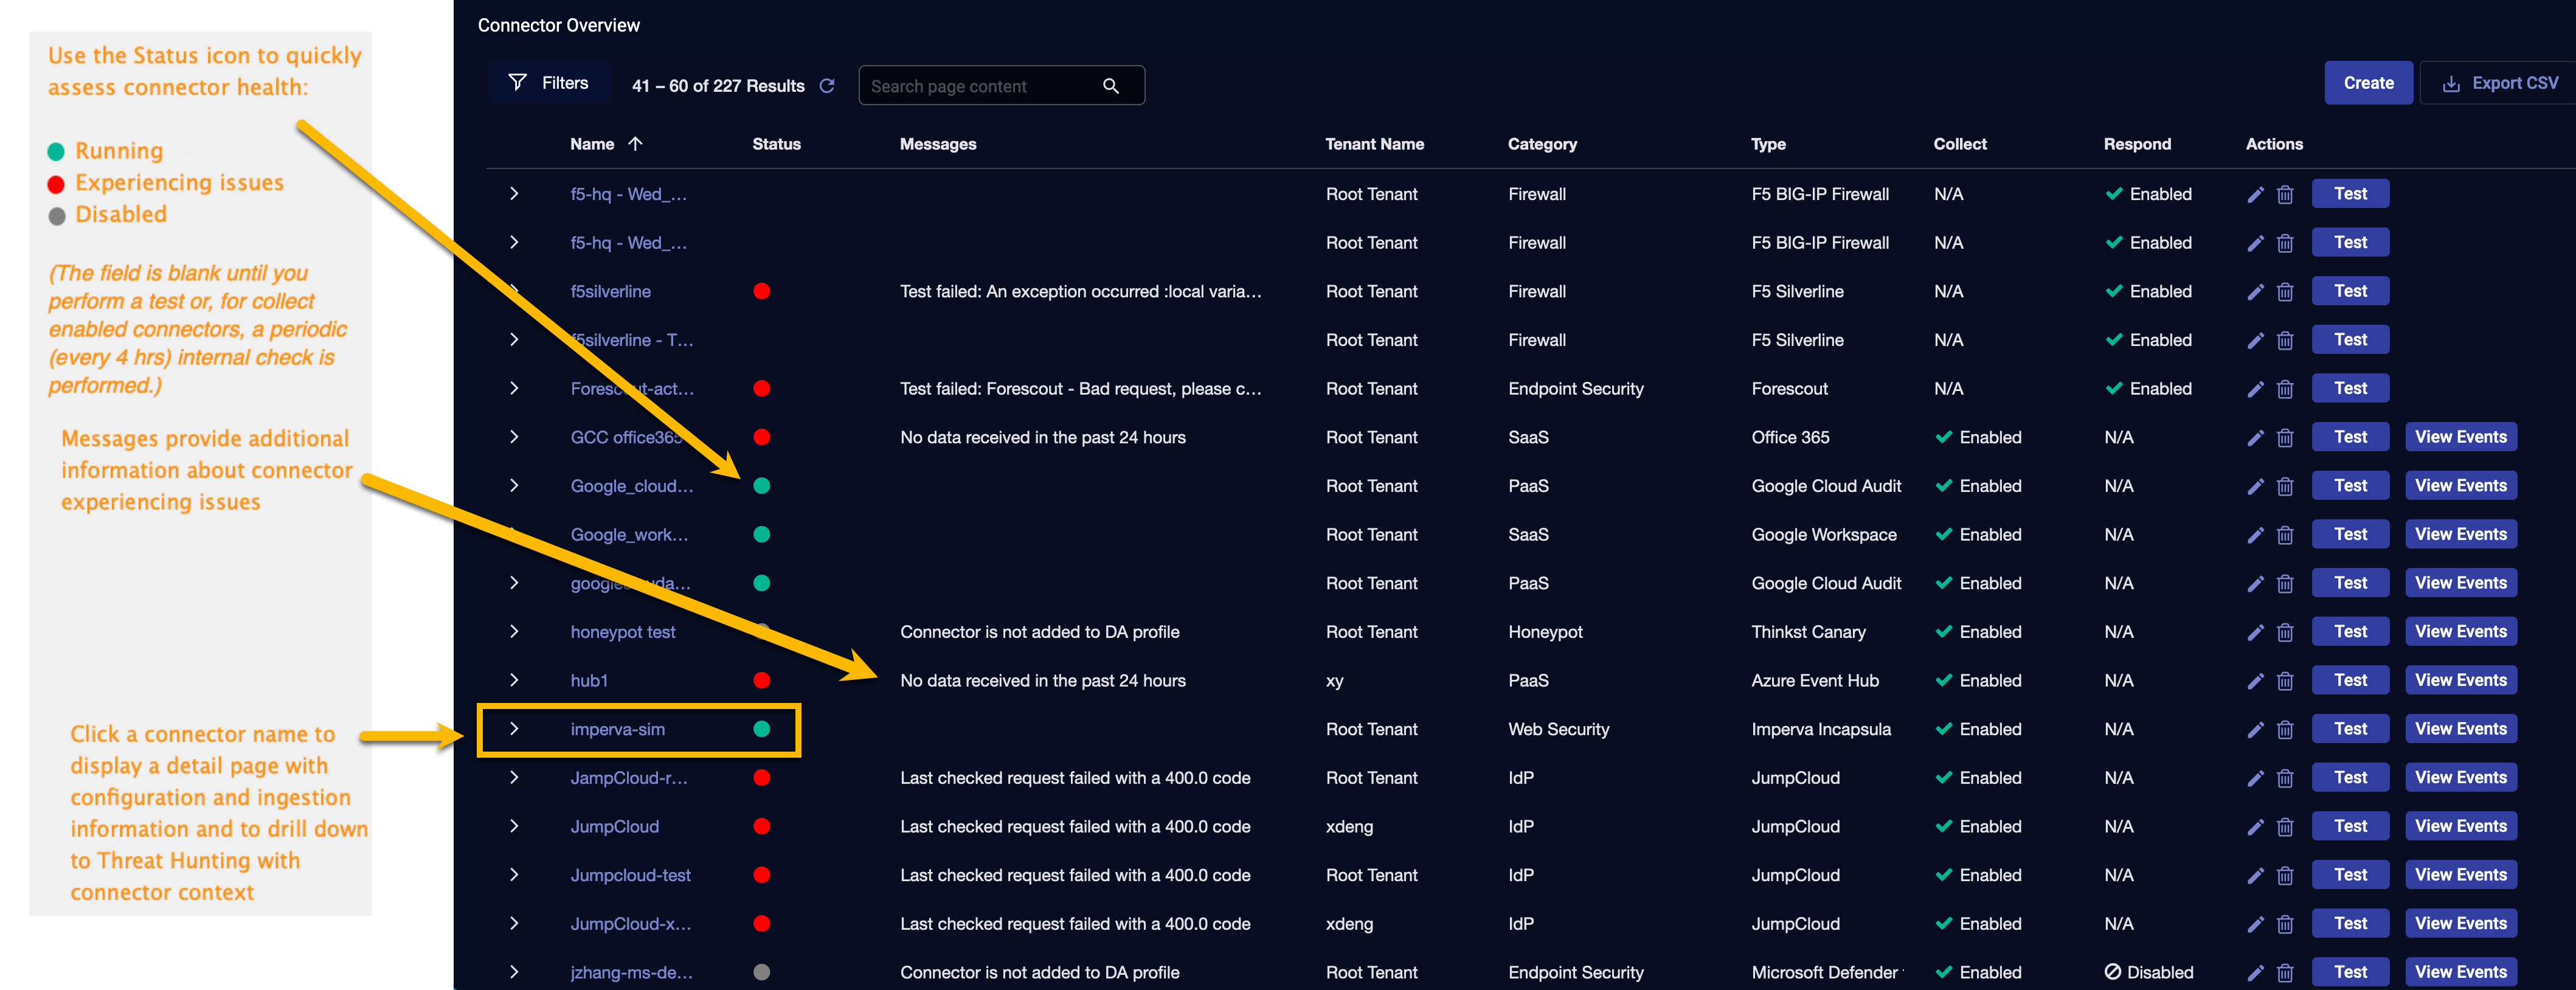
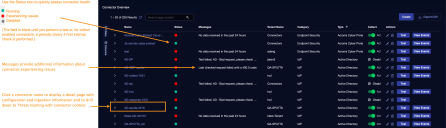
Click System | Integration | Connectors. The Connector Overview appears.

-
Click Create. The General tab of the Add Connector screen appears. The information on this tab cannot be changed after you add the connector.
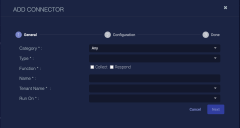
The asterisk (*) indicates a required field.
-
Choose Endpoint Security from the Category drop-down.
-
Choose Acronis Cyber Protect Cloud from the Type drop-down.
-
For this connector, the supported Function is Collect, which is enabled already.
-
Enter a Name.
This field does not accept multibyte characters.
-
Choose a Tenant Name. The Interflow records created by this connector include this tenant name.
-
Choose the device on which to run the connector.
-
(Optional) When the Function is Collect, you can create Log Filters. For information, see Managing Log Filters.
-
Click Next. The Configuration tab appears.
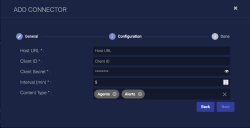
The asterisk (*) indicates a required field.
-
Enter the Host URL you obtained earlier, for example, https://eu2-cloud.acronis.com.
-
Enter the Client ID you obtained earlier.
-
Enter the Client Secret you obtained earlier.
-
Choose the Interval (min). This is how often the logs are collected.
-
Choose the Content Type you would like to collect. The logs for Agents and Alerts are supported.
The Agents content type is always selected and cannot be removed. The logs for Agents are set automatically.
-
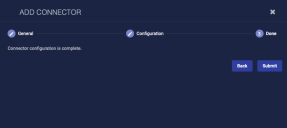
Click Next. The final confirmation tab appears.
-
Click Submit.
To pull data, a connector must be added to a Data Analyzer profile if it is running on the Data Processor.


The new connector is immediately active.
Testing the Connector
When you add (or edit) a connector, we recommend that you run a test to validate the connectivity parameters you entered. (The test validates only the authentication / connectivity; it does not validate data flow).
For connectors running on a sensor, Stellar Cyber recommends that you allow 30-60 seconds for new or modified configuration details to be propagated to the sensor before performing a test.
-
Click System | Integrations | Connectors. The Connector Overview appears.
-
Locate the connector that you added, or modified, or that you want to test.
-
Click Test at the right side of that row. The test runs immediately.
Note that you may run only one test at a time.
Stellar Cyber conducts a basic connectivity test for the connector and reports a success or failure result. A successful test indicates that you entered all of the connector information correctly.
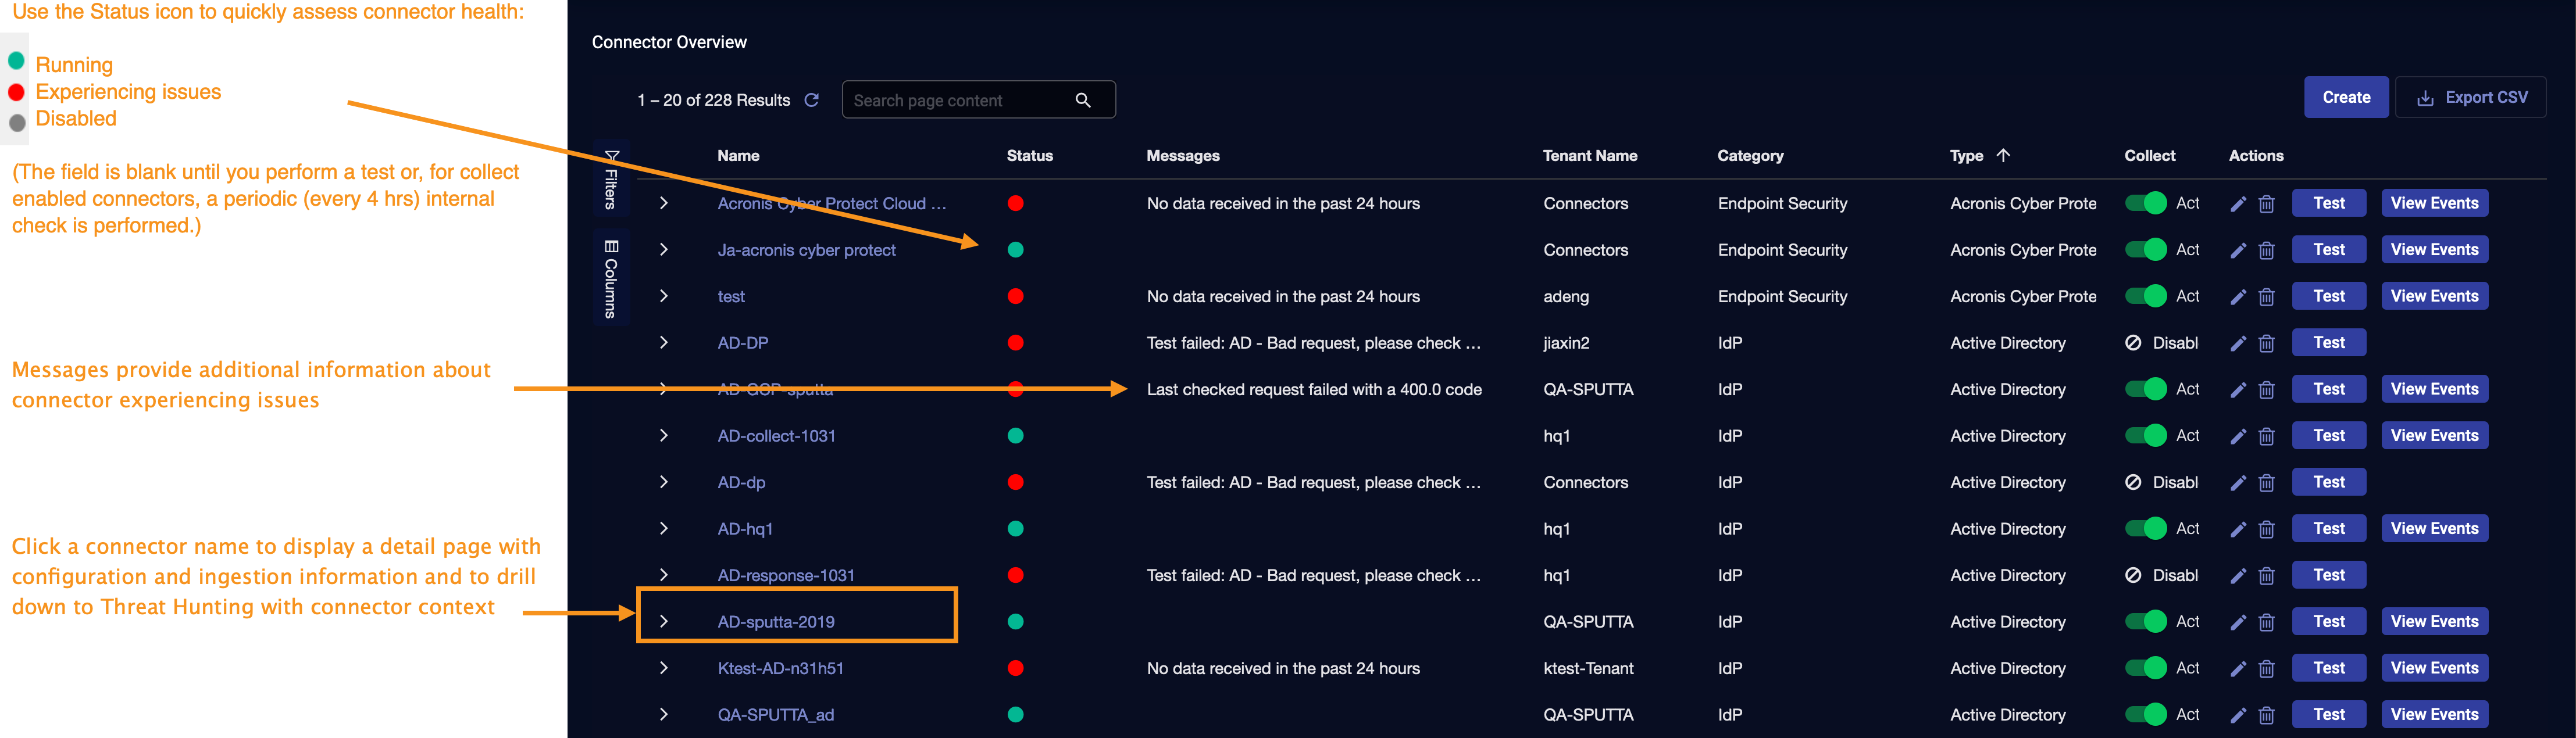
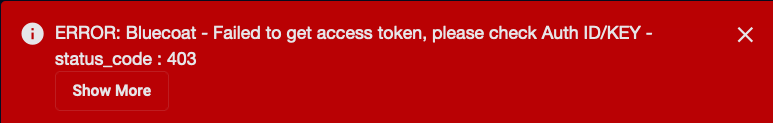
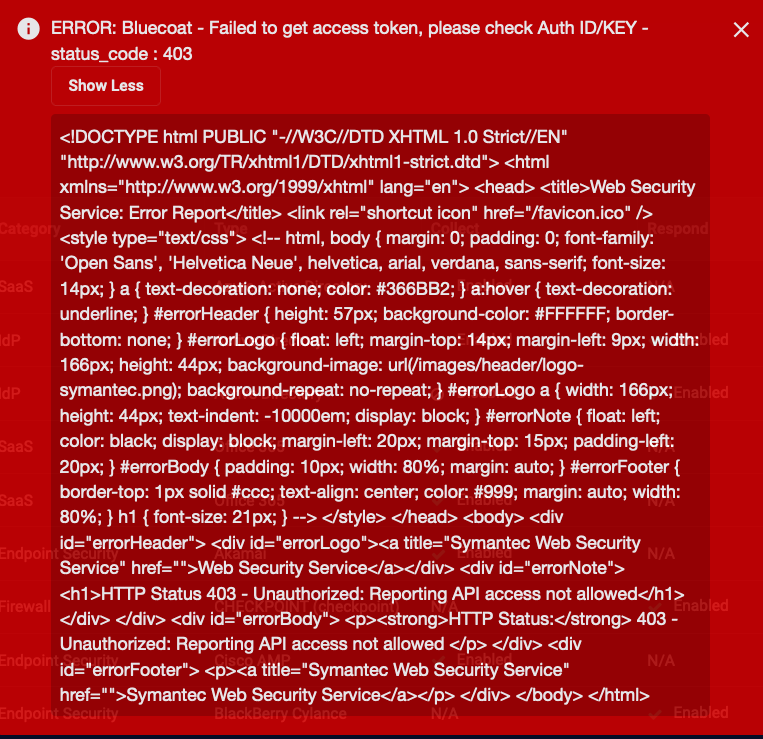
To aid troubleshooting your connector, the dialog remains open until you explicitly close it by using the X button. If the test fails, you can select the button from the same row to review and correct issues.
The connector status is updated every five (5) minutes. A successful test clears the connector status, but if issues persist, the status reverts to failed after a minute.
Repeat the test as needed.

Verifying Ingestion
To verify ingestion:
- Click Investigate | Threat Hunting. The Interflow Search tab appears.
- Change the Indices to Syslog or for assets only, change the Indices to Assets. The table immediately updates to show ingested Interflow records.
