Using the Sensor Overview
The System | Collection | Sensors page provides a list of all known sensors that are connected to the Stellar Cyber Data Processor.
When a sensor is installed, it is configured with the IP address of the Data Processor. When the sensor comes up, it connects to the Data Processor and appears in the Sensor table automatically.
The Sensor table provides the following functions:
- List the known sensors with basic information such as host name, sensor ID, IP address, and software version
- View information such as operational status, authorization, and traffic counters
- Configure sensors with the use of Sensor Profiles
- Remote upgrade of sensors
- Remove a sensor from the system
- Launch the CLI for sensors.
- Apply CA certificates to sensors.
- Download sensor logs for troubleshooting
From here, you can also navigate to the Scheduled Upgrades tab to keep track of pending updates for sensors.
Sensor Overview List
When the Sensor Overview page appears, it shows a table of known sensors. The table is scrollable and provides standard table functionality. In addition, you can click the Sensor Name for any listed sensor to drill to its Sensor Details page, with detailed performance metrics and configuration information.
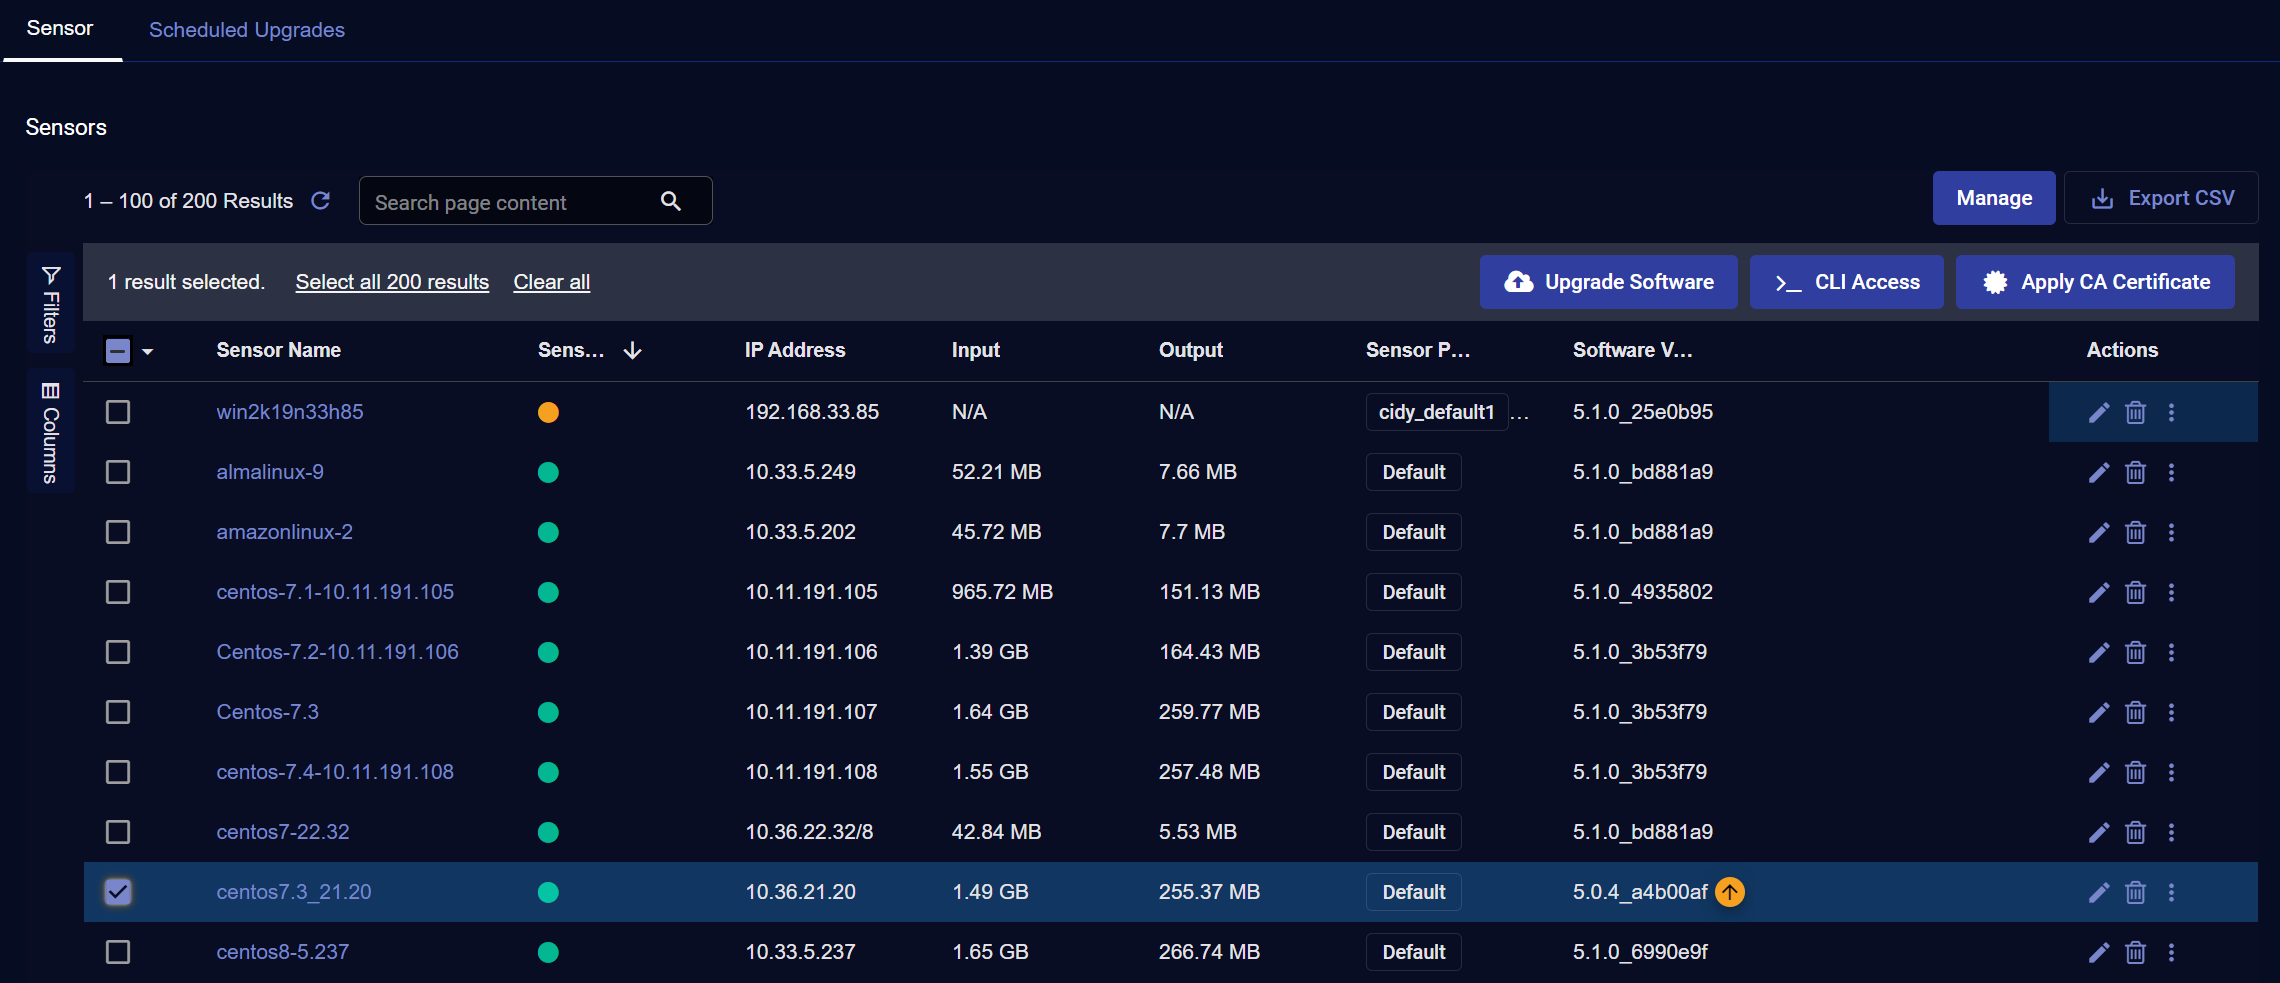
Each sensor is listed in the table with its own row. The columns include:
-
[ ] Check box to select sensors to Upgrade, open CLI Access, or Manage. Buttons for these features appear above the table appear when one or more sensors are selected.
-
Name—The host name where the sensor is located. This value may not be unique within the system since it depends on the configuration done on the system where the sensor runs. Click the name to see sensor details.
-
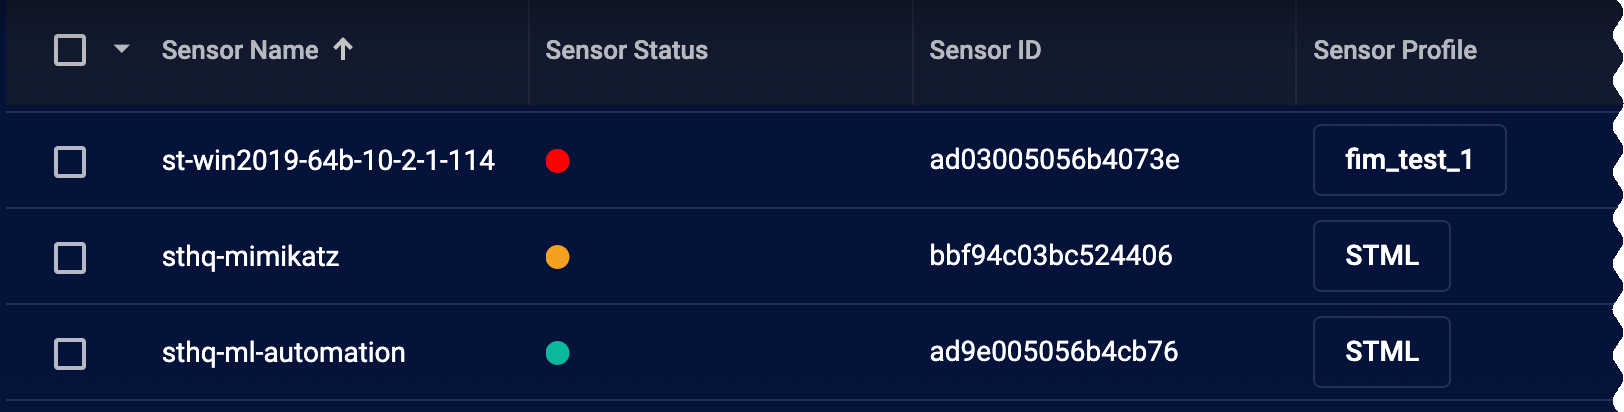
Sensor Status—The current status of the sensor is indicated with a color-coded LED. Refer to About the Sensor Status LEDs for details on the different conditions each of the sensor status LEDs can indicate.
-
Messages — Status message, if any, for the sensor.
-
Internal Sensor ID—A unique ID of the sensor, as assigned by the Data Processor.
-
Sensor ID—A unique ID of the sensor, as configured by the user.
-
Authorization—The authorization status of the sensor.
-
IP Address—The current IP address of the sensor in use. Communication from the Data Processor to the sensor will use this address.
-
Traffic Input—Total number bytes the Sensor has received. This represents the raw data received by the sensor.
-
Traffic Metadata Output—Total number of bytes sent from the Sensor to the DP. This is the amount of data sent after the raw data received has been enriched, deduplicated, and converted to Interflow.
-
License—The current license type.
-
Security Sensor License—Indicates whether the sensor is either a physical (device) Security Sensor, or a Modular Sensor with Security Sensor features enabled in its Modular Sensor Profile (IDS and/or Malware Sandbox).
Adding this column is a handy way to keep track of which sensors are consuming your purchased Security Sensor licenses.
-
Sensor Profile—The sensor profile that is applied to the sensor. A sensor profile contains configuration information that is shared between any number of sensors. See the Sensor Profiles page for more information.
-
Software Version—The version of software that is running.
-
Log Forwarder — Log forwarding is enabled
-
Edit — Edit the settings for a selected sensor. Details are below
-
Delete— Discard the selected sensor.
-
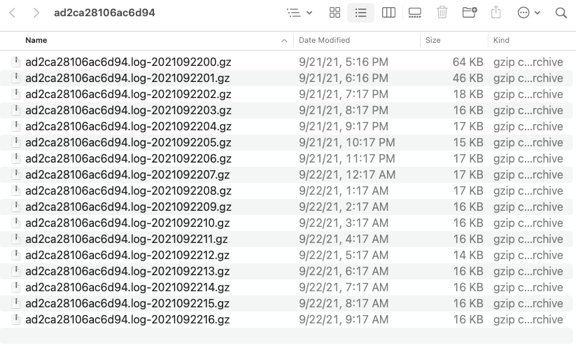
More options - Click this button to display a menu option to Download Debug Logs. Select this menu to download a gzip of the debug logs available for that sensor. The download is saved according to your browser settings for download files. The unpacked zip will appear similar to this example:
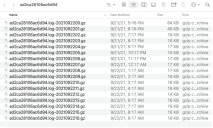
You can also use this menu to recollect the latest debug logs for the sensor before downloading them.
Additional columns, not displayed by default,
![]() are available.
are available.
See the Tables page for more information on working with Tables.
About the Sensor Status LEDs 
The Sensor Status column displays color-coded LEDs indicating the health of each sensor at a glance:
-
Green – The sensor is operating normally and there are no danger or warning conditions detected.
-
Yellow – At least one warning condition is affecting the sensor.
 Click here to see the possible warning conditions:
-
Sensor disk usage exceeds 90%
-
Sensor CPU usage exceeds 99%
-
Sensor feedback contains a
config mismatcherror message -
Sensor has not updated its status in at least five minutes
-
Sensor feedback shows a failure to apply a profile with the Tenable Nessus feature enabled to a sensor running version 4.3.3 or lower (Tenable Nessus support was introduced in 4.3.4)
-
Sensor feedback contains at least one
warningmessage
-
-
Red – At least one danger condition is affecting the sensor.
Click there to see the possible danger conditions:
-
Sensor has an invalid Engine ID (
engid) -
Sensor has a conflicting Engine ID (
engid) -
Sensor configuration is out of sync (either the
ver_sentdoes not match receivedver_ackor one of the two messages is missing) -
Sensor memory usage exceeds 95%
-
Sensor feedback contains a
config failuremessage -
Sensor feedback shows at least one failure during the application of a new sensor profile.
The exception to this is a failure to apply a modular sensor profile with the Tenable Nessus feature enabled to a sensor running 4.3.3 or lower. Those failures are reported as warnings and only display the yellow LED, as described above.
-
Data Sensor Edit
Some of the information associated with each sensor can be edited by clicking the ![]() button at the right side of a sensor's entry in the table:
button at the right side of a sensor's entry in the table:
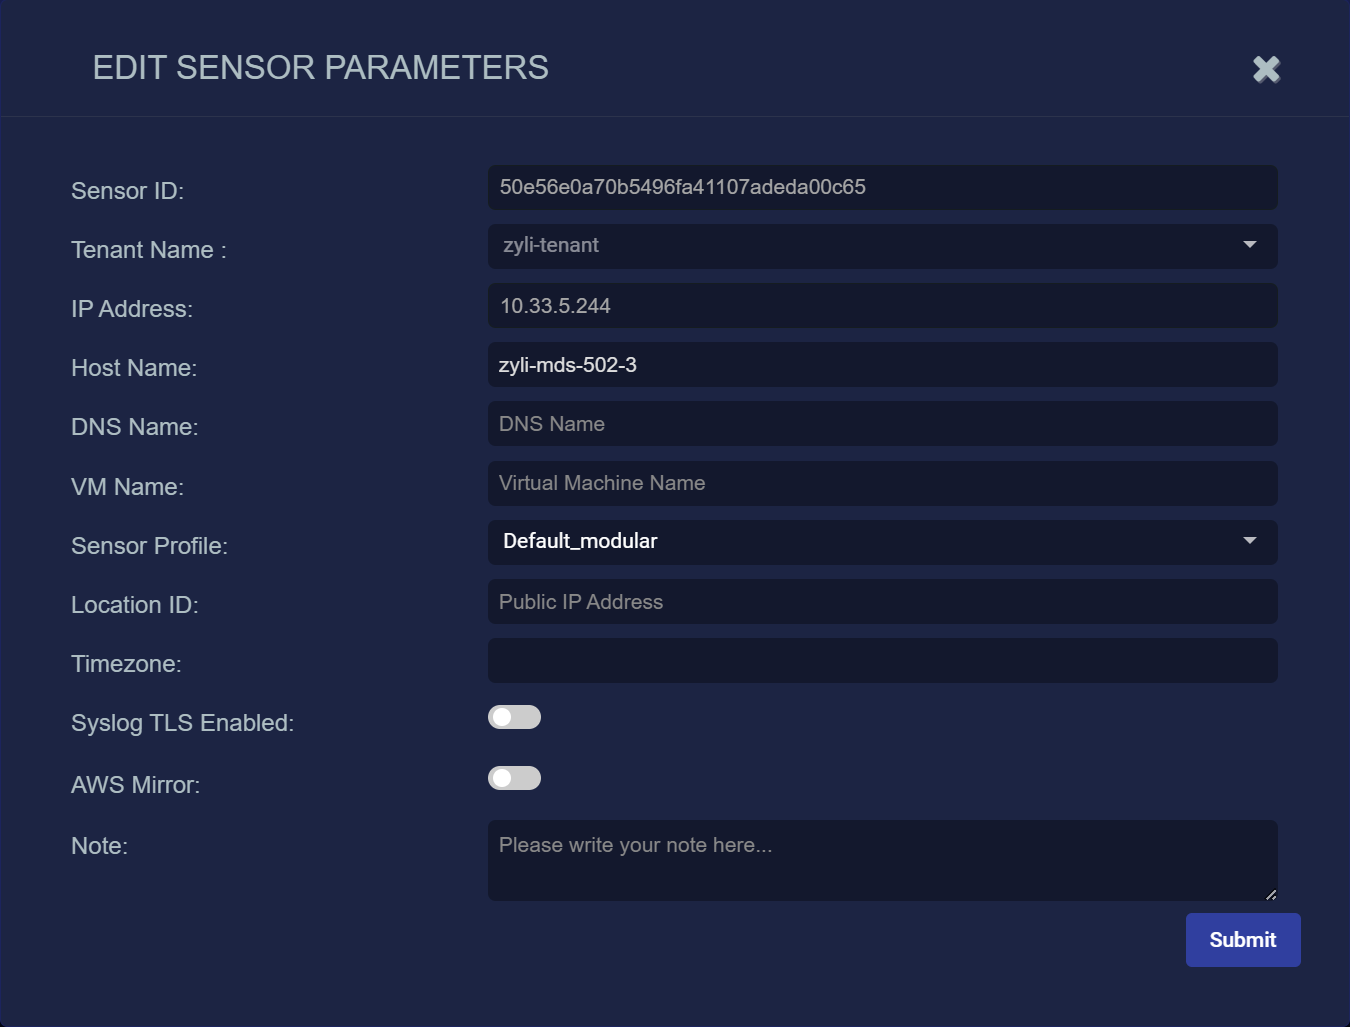
Most fields are read-only. The available fields include:
-
Sensor ID —The internal ID for the sensor.
-
Tenant Name—The tenant for the sensor.
Note that if you change a sensor's tenant assignment, any CA certificates assigned to the sensor are automatically cleared without any notification in the user interface.
-
IP Address —The IP address of the sensor.
-
Host Name—The host name of the sensor. This value will be used in the first column of the sensor list described above. This field does not support multibyte characters.
-
DNS Name—The DNS Name of the sensor. This field does not support multibyte characters.
-
VM Name—The name of the VM in which the sensor is running.
-
Sensor Profile—This field is a drop-down menu of the available sensor profiles.
-
Primary Aggregator—This field is a drop-down menu of the available data aggregators.
-
Location ID—The gateway IP address. Stellar Cyber automatically detects the gateway IP address, but this lets you set it manually.
-
Timezone—The timezone in which the sensor is operating.
You can only change the timezone for device sensors. The Timezone option is hidden for Server Sensors.
See Timezones and Log Ingestion for information on how the sensor's timezone is used during log ingestion.
-
PKT Forwarding Interface—The VXLAN interface number.
-
Syslog TLS Enabled—Enable to ingest TLS-encrypted logs. See Ingesting Logs Via TLS for more information.
-
AWS Mirror—Enable this to monitor traffic from a mirror port you configured on AWS. See Configuring AWS Port Mirroring for details.

If you enable AWS Mirror, the following additional fields appear:
-
Physical Ethernet Port—This is the index number of the physical interface the UDP traffic arrives on.
-
Port—The UDP port for the traffic.
-
VNI—This is the VXLAN ID you configured on AWS.
-
-
Note—Use this to keep notes about the sensor. This field does not support multibyte characters.
To make changes, edit the fields as desired and click SUBMIT to save.
Timezones and Log Ingestion
Stellar Cyber converts all log timestamps to UTC during log ingestion. Timezones are handled as follows:
-
If a log includes the timezone, Stellar Cyber preserves that time setting during the conversion to UTC.
-
If a log does not include a timezone, Stellar Cyber uses the timezone of the receiving sensor.
During installation, the timezone for sensors are automatically set to UTC+0. Since the logs for some security products may only include the local time without a timezone, Stellar Cyber recommends that you set the sensor timezone to the same timezone as your security product.
Deleting a Sensor
You can click the ![]() button at the right of a sensor's entry in the table to remove it from the list. If you delete the sensor, the sensor is removed from the list, and the sensor deletes its configuration so it will not be discovered by Stellar Cyber.
button at the right of a sensor's entry in the table to remove it from the list. If you delete the sensor, the sensor is removed from the list, and the sensor deletes its configuration so it will not be discovered by Stellar Cyber.
Upgrading Sensor Software
Sensors can be upgraded manually:
-
Manual Upgrades – You can use the instructions in this section to upgrade sensors manually, selecting one or more sensors in the Sensor List and clicking the Upgrade Software button.
Use the following procedure to upgrade sensors manually:
-
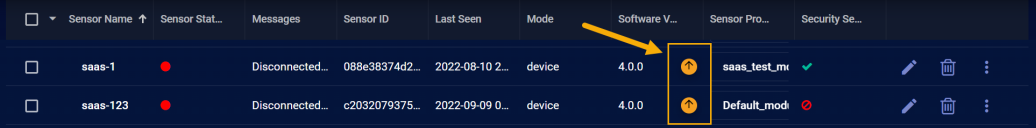
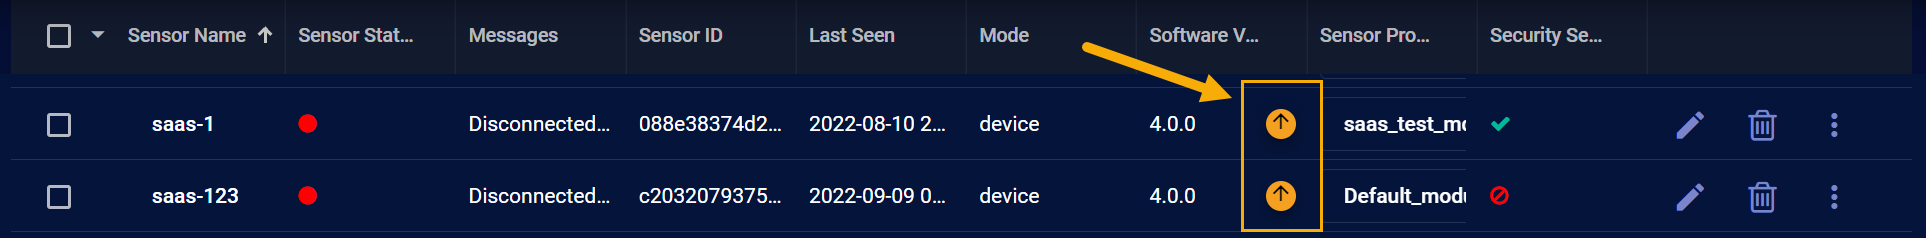
Navigate to the System | Sensors list and inspect the Software Version column. Sensors that have an upgrade available are listed with a distinctive icon in this column, as shown below:
The system also automatically identifies sensors that are eligible for an upgrade and informs you with a banner showing the total and including an Upgrade Now button you can use to streamline the process.
-
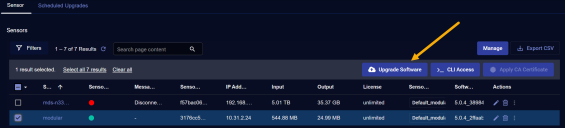
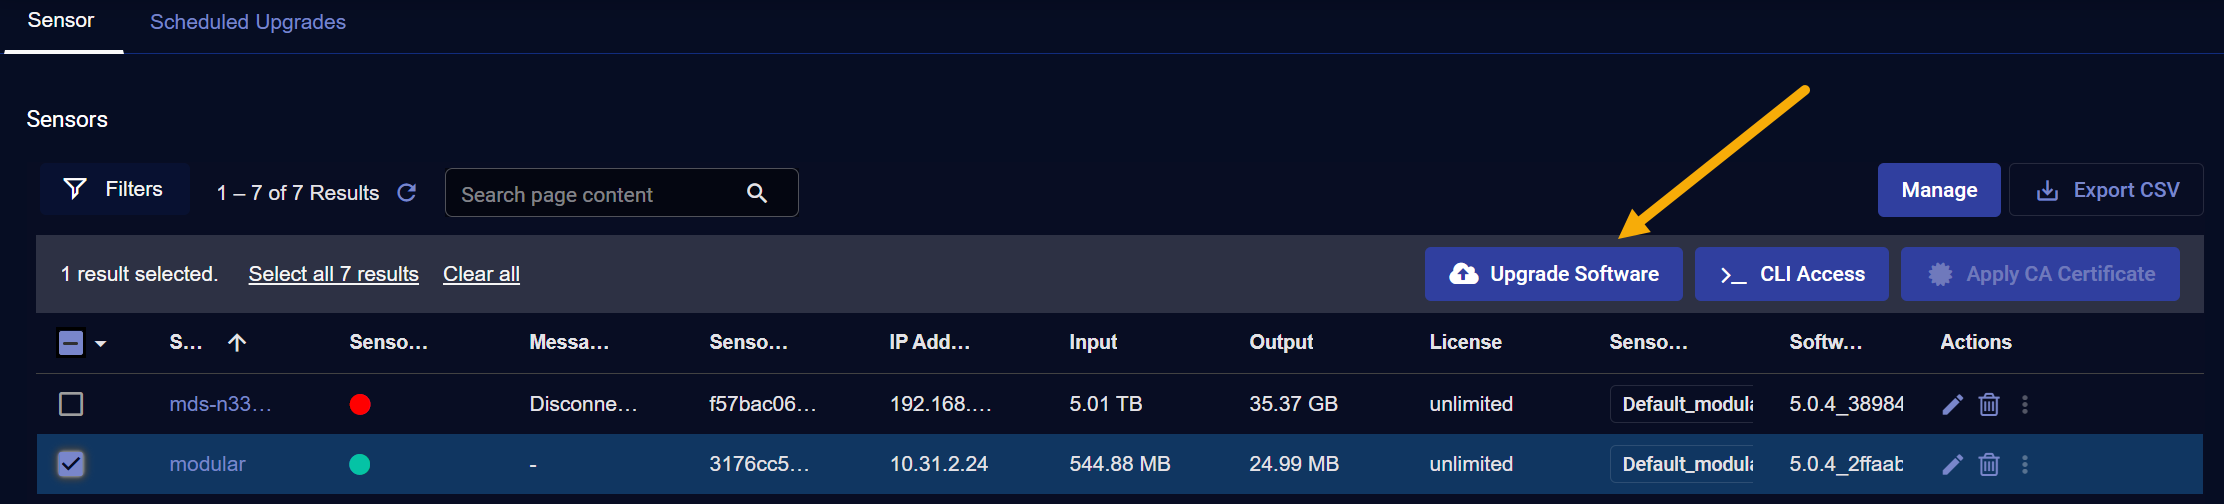
Check the boxes of the sensors you want to upgrade in the Sensor List and click the Upgrade Software button at the top of the list.
-
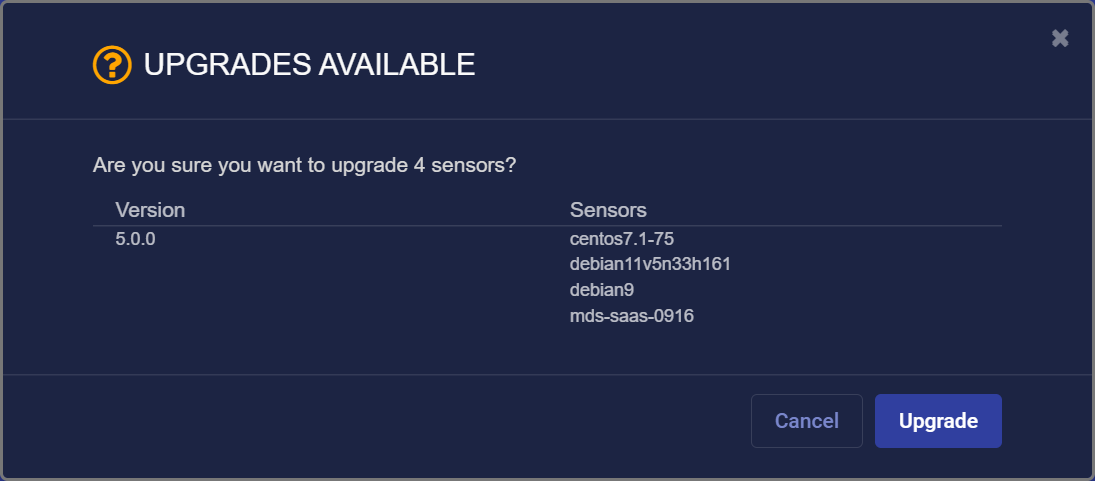
Stellar Cyber displays a confirmation prompt listing the sensors you've selected for the upgrade. Verify the sensors and click the Upgrade button, as illustrated below.
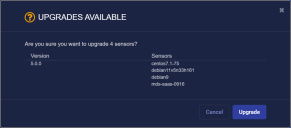
-
Stellar Cyber evaluates the sensors selected for the upgrade. If one of the sensors you selected for the upgrade already has been scheduled for an upgrade, the system informs you of the situation and queues the remaining sensors for an upgrade.
-
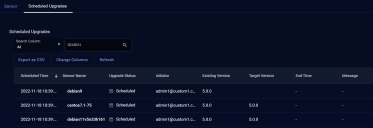
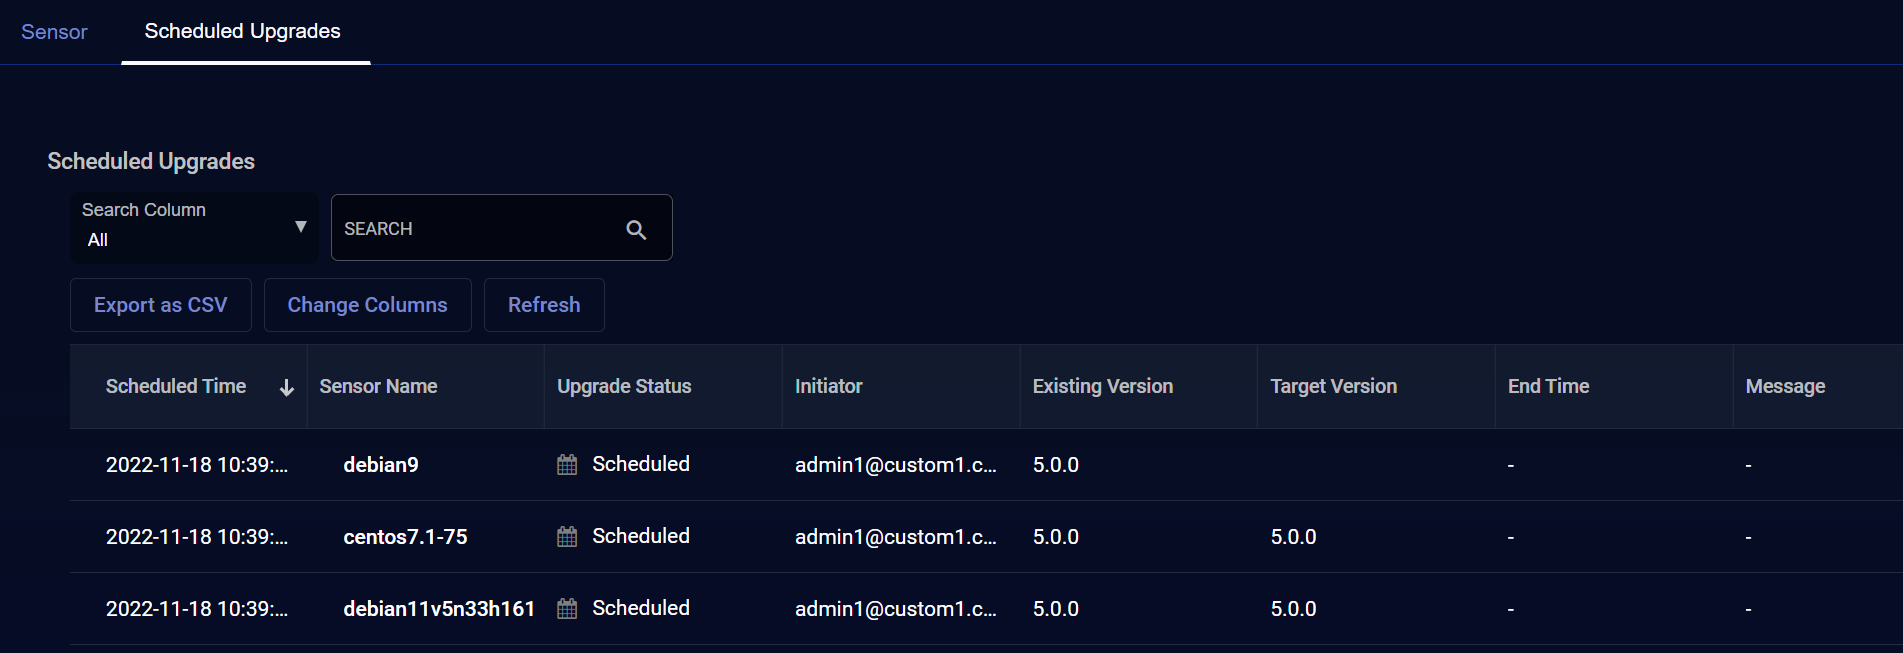
Once the sensors are scheduled for an upgrade, you can keep track of the progress in the Scheduled Upgrades tab. The illustration below shows the sensors we just scheduled for upgrade:
What Happens Next?
Once a sensor is selected for upgrade, behind the scenes, Stellar Cyber identifies the correct software version to apply and schedules the upgrade to take place during a period of low activity. If the sensor was offline when the upgrade was requested, Stellar Cyber continues to
Using the Sensor CLI
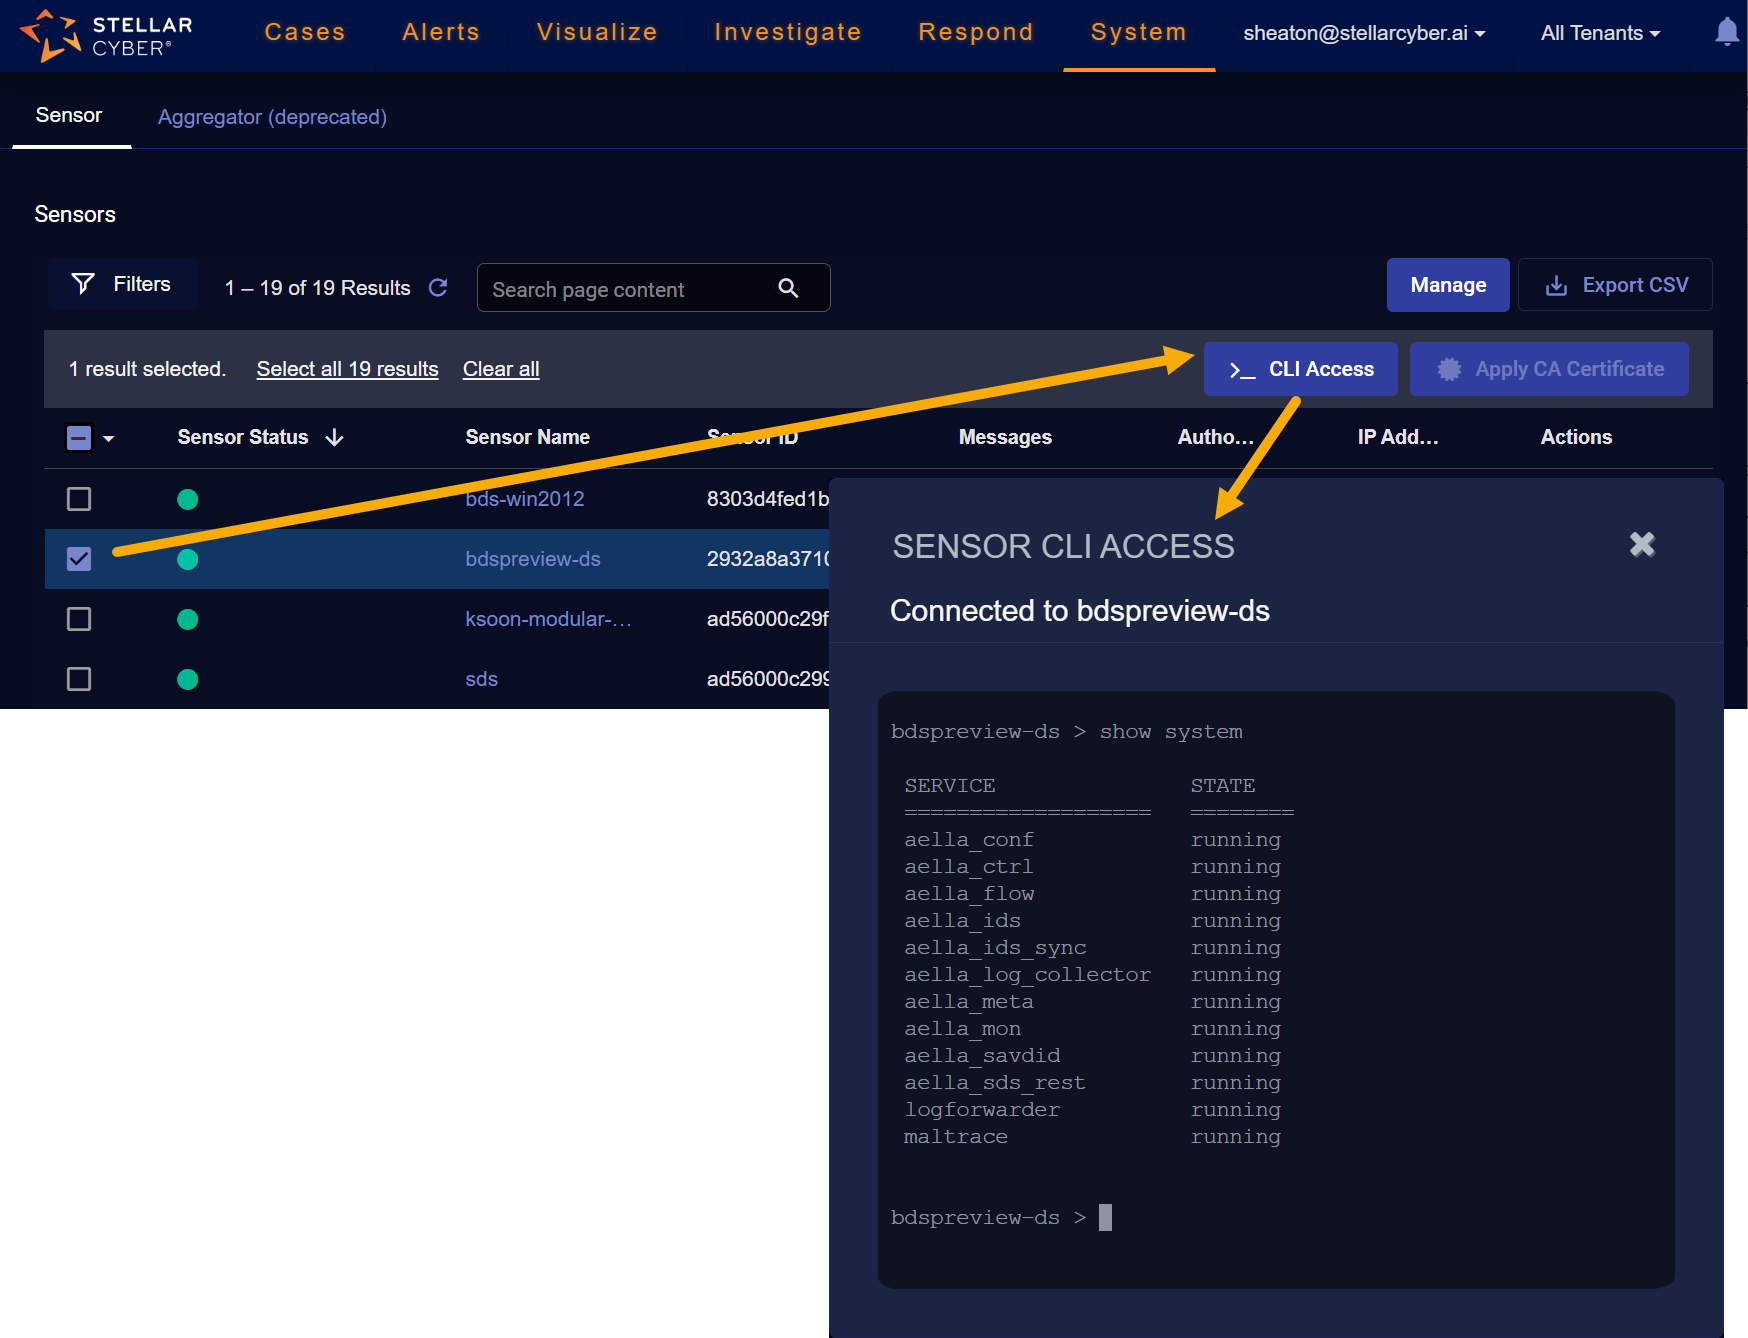
You can select one or more sensors in the Sensor Overview table and click the >_CLI Access button to open a command line session with the corresponding sensor(s) in the Sensor CLI Access window, as illustrated in the figure below:
Note the following:
-
The available CLI commands are a subset of the full suite of CLI commands available when connected directly to a sensor. Refer to Available Commands in the Sensor CLI Access Window for a summary of the available commands.
-
You can only use the CLI Access feature with sensors that are connected and running a minimum version of 4.2.x. Sensors do not need to be authorized for CLI access.
-
You can use your browser's right-click context menu to copy text from the Sensor CLI Access window and paste it for use elsewhere. The window is scrollable, too, so you can see the output of commands that do not fit entirely in the window.
-
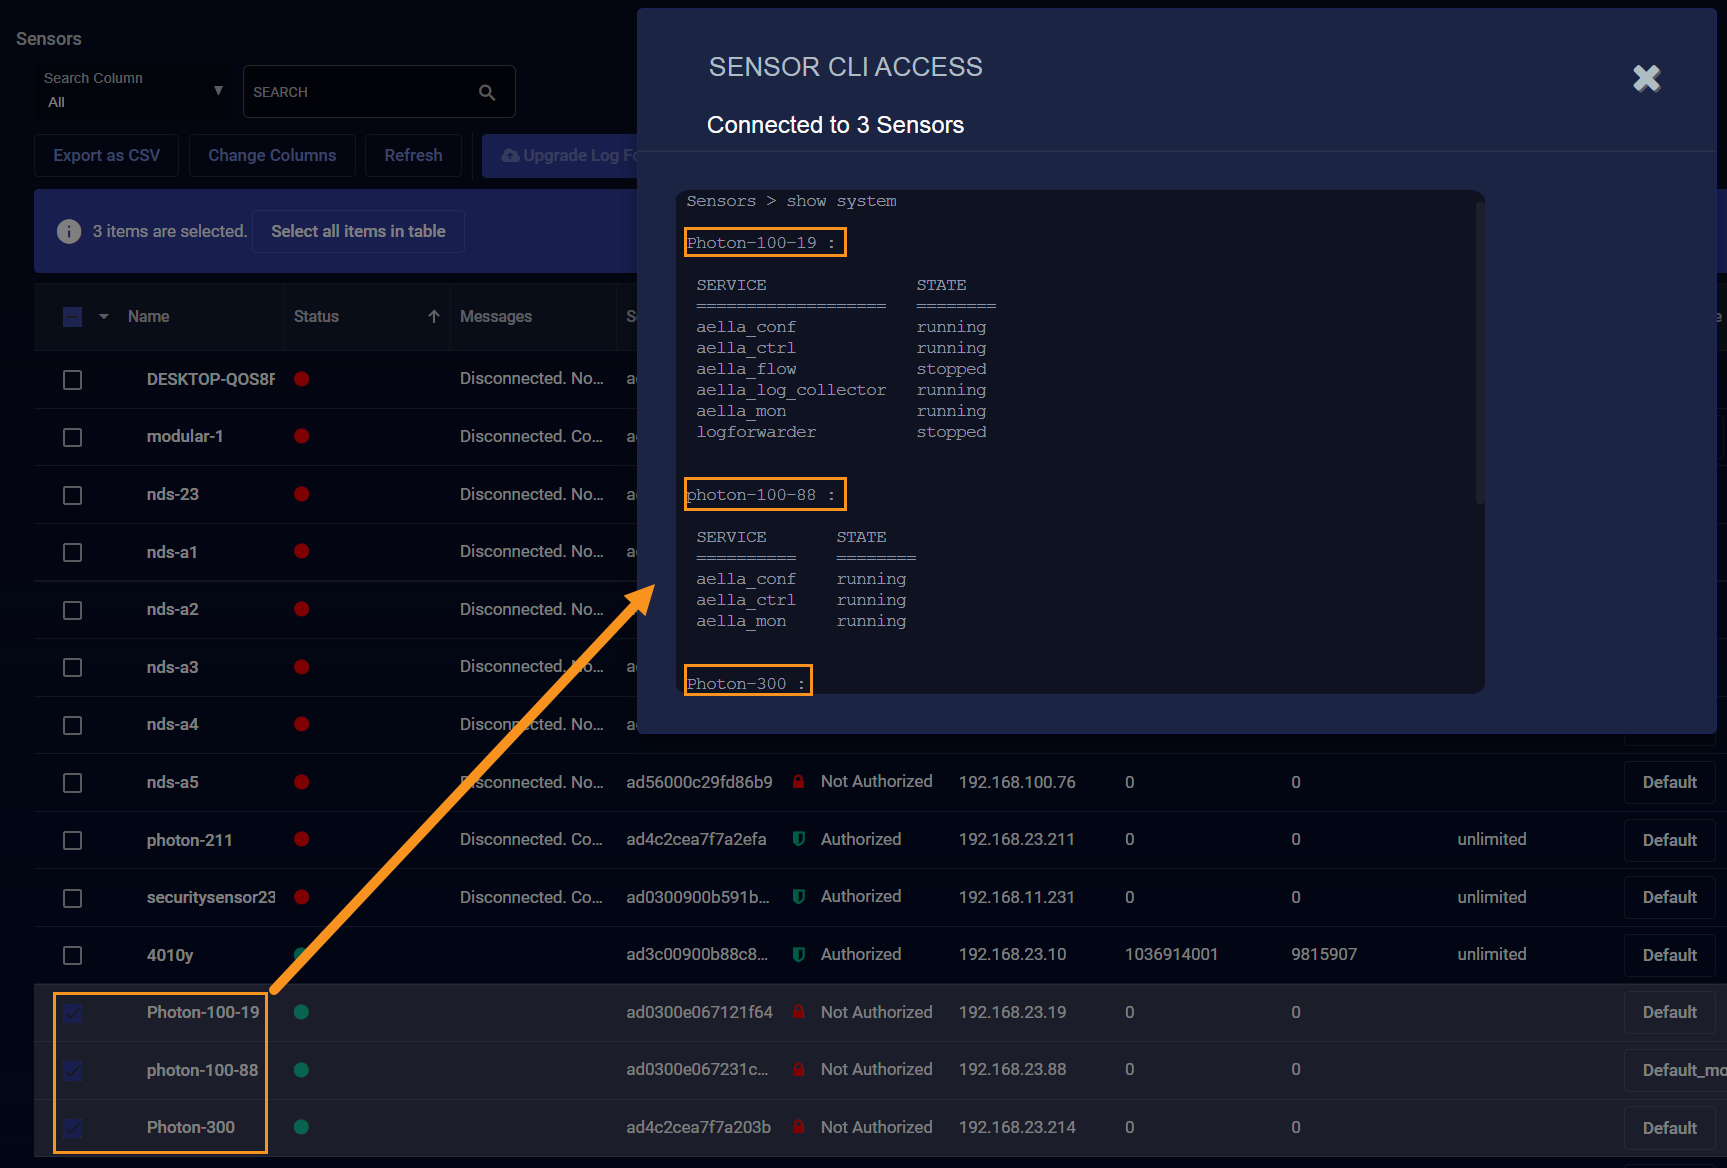
You can select multiple sensors before clicking the >_CLI Access button. When you use this technique, the CLI issues any command to all connected sensors and returns the results under a heading indicating each sensor's name. For example, the illustration below show the partial results of a show system command issued to three separate sensors.
Sensor CLI Access Commands
The following types of commands are available in the Sensor CLI Access window:
-
show – You use show commands to see the settings and statuses for different options on the sensor.
-
set – You use set commands to configure options on the sensor.
You can type any of the following to see the available commands of the corresponding type:
-
show ? or show help
-
set ? or set help
You can also use the ? with a specific command to see its available arguments. For example:
sds-a > set ntp ?
<NTP server> Specify NTP server name or IP address
Refer to Available Commands in the Sensor CLI Access Window for a summary of the available commands.
Applying CA Certificates to Sensors
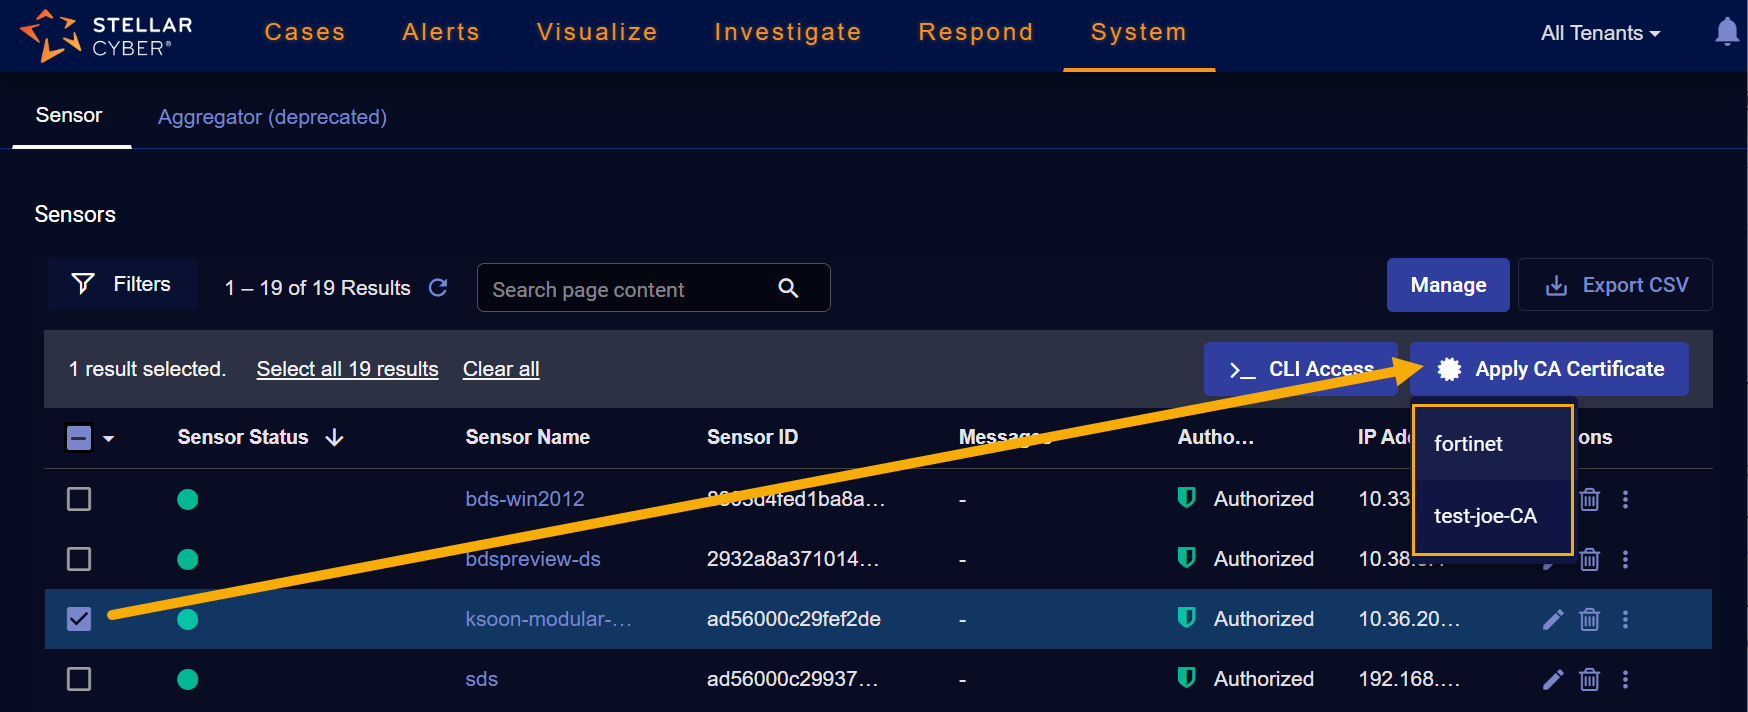
You can select one or more sensors in the Sensor Overview table and click the Apply CA Certificate button to assign a CA certificate to them. In response, a dropdown appears listing the CA certificates you've added to Stellar Cyber in the System | Administration | Certificates page that match the selected sensor's tenant, allowing you to click the one you want to apply.
If you are assigning the same CA certificate to multiple sensors belonging to the same tenant, you can use the Change Columns button to add the Tenant Name column to the display, click in the column heading to sort on it, and then select all of the tenant's sensors to which you want to apply the CA certificate.
You only need to apply CA certificates to those sensors that sit behind firewalls using an SSL inspection service. Without the CA certificate from the SSL inspection service applied, the sensor cannot retrieve the necessary package for upgrading. Make sure you choose the CA certificate used by the SSL inspection service on the firewall protecting the sensor(s).
Note that it is possible that your sensors may be behind a different firewall than the DP. Make sure you assign the CA certificate from the correct firewall to the sensor(s).
DPs behind firewalls using an SSL inspection service also require a CA certificate. You assign certificates to DPs using the CA Certificate entry in the Data Processor section of the System | Administration | Settings page.
If a certificate you expect to see doesn't appear when you click the Apply CA Certificate button, make sure you uploaded it with the correct tenant assignment in the System | Administration | Certificates page.
Removing a CA Certificate from a Sensor
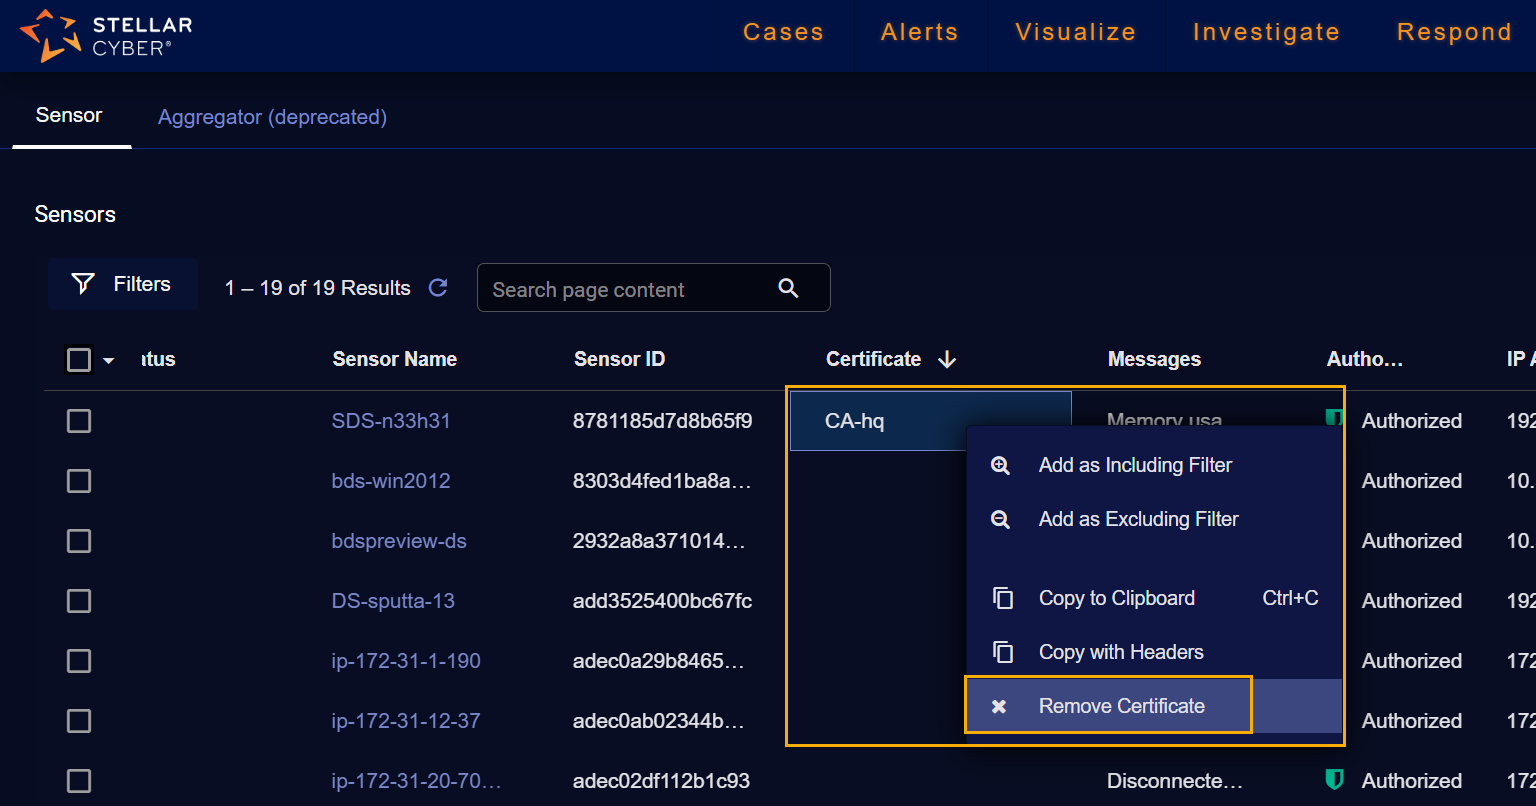
You can also remove an applied CA certificate from a Sensor in the Sensor Overview table. Start by right-clicking the sensor's entry in the Certificate column. Then, select the Remove Certificate option from the context menu that appears, as illustrated below. Keep in mind that you must remove all associations from a certificate before you can delete it in the System | Administration | Certificates page.
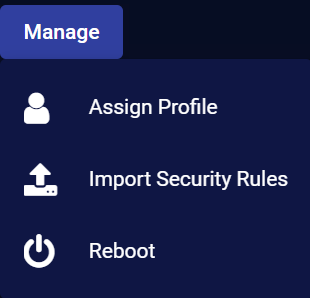
Sensor Management Menu
The Manage button is located above Sensor Overview table. Clicking it displays the menu shown below. These options are all related to the management of the sensors and each option displays its own dialog box.
The following sections describe the available functions.
Sensor Assign Profile
For operation all sensors must be assigned to a profile. Except for the default Profile other profiles are created by the user. For more information see the Sensor Profiles page.
To perform profile assignment, select the Manage | Assign Profile option. A dialog box similar to the following appears.
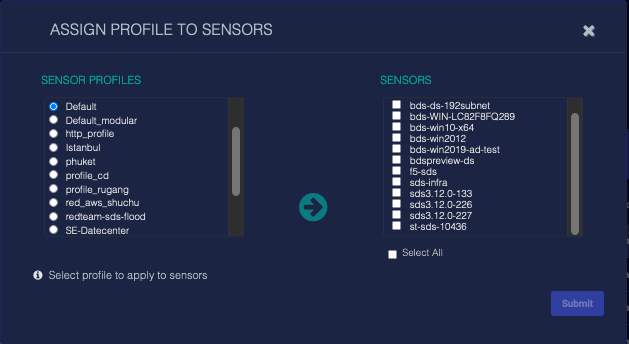
On this dialog box the following steps may be applied:
- Available profiles are listed in the SENSOR PROFILES list. Select one with the radio-button control.
- Available sensors are listed in the SENSORS list. Select the sensor(s) to which you want to apply the profile selected in the SENSOR PROFILES list by checking their boxes.
- Apply the selected profile to the selected sensor(s) by clicking the Submit button.
Changes in this dialog box do not take effect until the Submit button is clicked. If the X button is used to close the dialog box no changes are made.
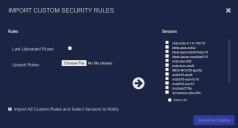
Sensor Import Security Rules 
You can use the Manage | Import Security Rules option to import custom Suricata (IDS) security rules from an external file for use by sensors with the ML-IDS (Malware) feature enabled in their sensor profiles.
Use the following procedure to import custom security rules:
-
From the Sensor table, click the Manage button and select the Import Security Rules option.
A dialog box similar to the following appears:
-
Select a local file by using the Choose File button. See below for details on the rule file format.
-
Select the sensors that will use the security rules from the SENSORS list.
-
Click the Upload and Deploy button to apply the imported security rules to the selected sensors.

Rule File Format
The rule file must follow standard Suricata rule format, with each rule on a single line. Here is an example of a custom rule in the correct format:
alert tcp $HOME_NET any -> $EXTERNAL_NET any (msg:”ET TROJAN Likely Bot Nick in IRC (USA +..)”; flow:established,to_server; flowbits:isset,is_proto_irc; content:”NICK “; pcre:”/NICK .*USA.*[0-9]{3,}/i”; reference:url,doc.emergingthreats.net/2008124; classtype:trojan-activity; sid:2008124; rev:2;)
Note the following important points for custom rules:
-
Because Stellar Cyber sensors with the ML-IDS feature enabled operate as an IDS rather than an IPS, the action for your security rules must be alert, as shown above.
-
The values for
$HOME_NETand$EXTERNAL_NETare specified in the Sensor Profile:-
Modular Sensor Profiles – Feature Customization | IDS | Networks
-
-
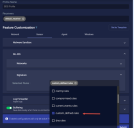
Once imported, custom rules are stored in the custom_defined.rules signature set. They are enabled in the sensor profiles for all sensors to which you applied them by default and can be seen in the Sensor Profile under Signature | Selected Rules, as illustrated below.
You can toggle your custom rules on and off using the custom_defined.rules entry shown below, as well.
Each time you import custom security rules to a sensor, the new rules completely overwrite any existing entries in the custom_defined.rules signature set. New rules are not appended to the existing rules.

Troubleshooting Custom Security Rules
-
You can check the Sensor's ids feedback message to see the result of an upload and deploy. For example, here is the result of a successful upload and deploy:
Copy"ids": {
"msg": "Success",
"status": true,
"timestamp": 1690000900,
"datetime": "2023-07-21 21:41:40"
}, -
You can keep track of IDS events and malware detections by using the
show maltracecommand from the Sensor's CLI. For example:CopyDataSensor> show maltrace
Maltrace Event:
Captured: 0
Truncated: 0
Prefiltered: 0
Verdict Found in Local Cache: 0
Verdict Found in Remote Cache: 0
Passed to Local Scan Engine: 0
Filtered on Local Scan Engine: 0
File Analyses Failure on Local Scan Engine: 0
Local Scan Engine Failure: 0
Verdict Given by Local Scan Engine: 0
Uploaded to Sandbox: 0
Failure Over Sandbox: 0
Sandbox Scan Succeeded: 0
Sandbox Timeout: 0
Sent Result to Central Manager: 0
IDS Event:
Received: 67
Excluded: 0
Sent Result: 0
Unknown Score: 67
Output buffering:
Buffered: 67
Outputed: 66
Rebooting Sensors Remotely
Sensors can be rebooted remotely. Select the Manage | Reboot option to reboot one or more sensors remotely. A dialog box similar to the following appears:
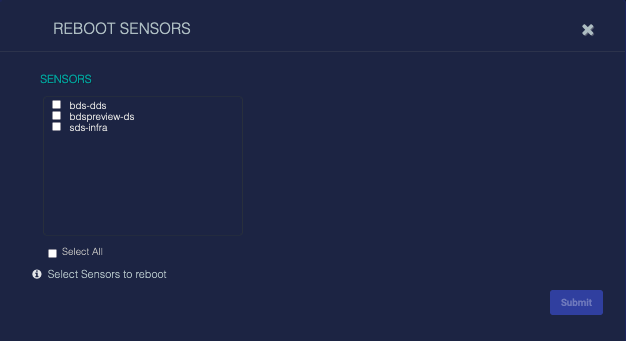
Select the sensors to reboot by checking their boxes in the SENSORS list. Click the Submit button to start the reboot process on the selected sensors.
Rebooting a sensor does not reboot the host on which the sensor is installed.
