Network Visibility
Observing network traffic patterns is a basic technique for detecting all kinds of network problems, including security breaches. In the process of collecting data to find anomalies, Stellar Cyber accumulates a massive amount of information about the networks for which it has sensors. The Visualize| Predefined | Network Visibility page makes this information easily accessible. The top of the dashboard provides a tab menu that is used to select the display composition, as shown below:

The default setting when the screen first appears is Overview. Each option is discussed in the following sections on this page.
The data shown on this screen is selected by the current filter settings as set by the filter controls at the top of the screen. See the Filters page for more information on working with these controls.
On line charts in the display, when the pointing device cursor is hovered over parts of the data plot the numeric values used in the plot are displayed.
Overview
The Overview aggregates all information to produce a picture of all activity on the networks. A sample is provided in the following image:
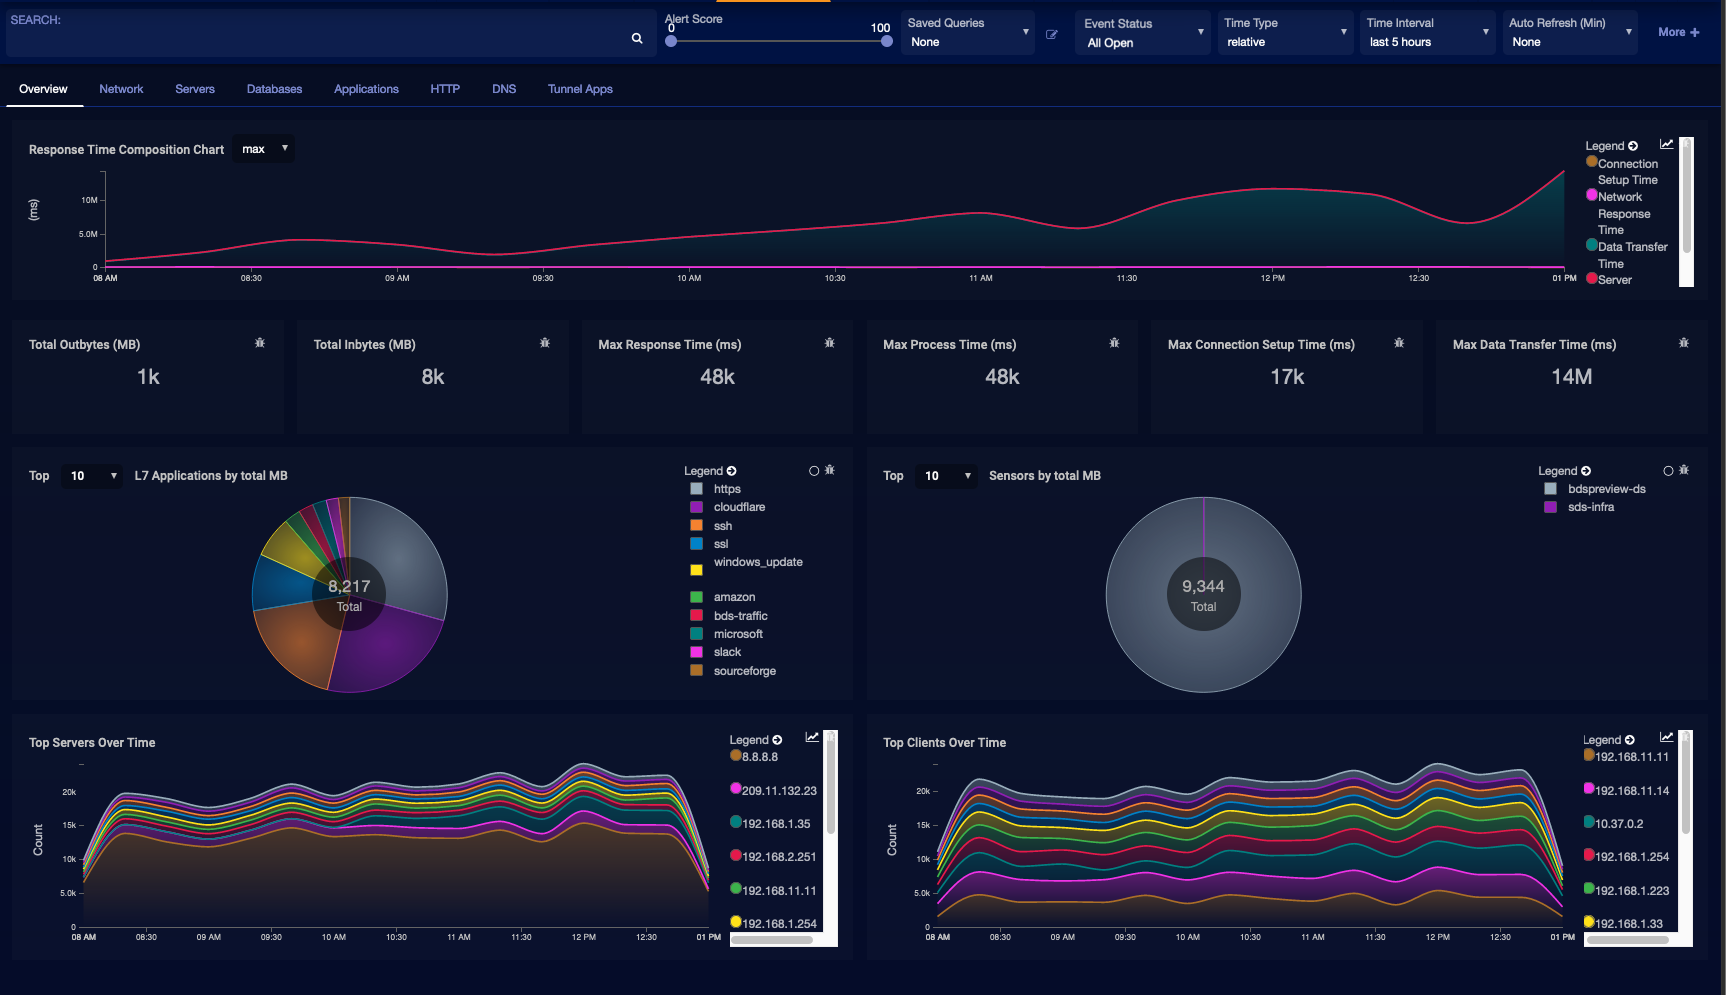
The main features of this dashboard include:
-
Response Time Composition Chart—This line graph summarizes some key indicators of server performance plotted over a time axis.
-
Major Traffic Gauges—This section provides a group of scalars computed across observed traffic:
-
Total Outbytes (MB)—The total amount of traffic sent by all hosts.
-
Total Inbytes (MB)—The total amount of traffic received by all hosts.
-
Max Response Time (ms)—The largest time it took for any host to respond to a request.
-
Max Process Time (ms)—The largest time it took for any host to process a request.
-
Max Connection Setup Time (ms)—The largest time it took for a TCP connection to be set up.
-
Max Data Transfer Time (ms)—The largest time it took to transfer data.
-
-
L7 Applications by total MB—This pie chart calls out the top applications operating in the network.
-
Sensors by total MB—A pie chart that shows which sensors in the network processed the most data.
-
Top Servers Over Time—This plot shows which server hosts transferred the most data over the given time period.
-
Top Clients Over Time—This plot shows which client hosts transferred the most data over the given time period.
The data shown in the Overview might indicate anomalies. Sudden spikes in traffic associated with a given host or application could indicate active malware. These visual clues can indicate which of the associated displays on this screen will be likely to yield more data of interest.
Network
The Network display focuses on distilling data observed from network traffic information. A sample of this display is shown in the following image:
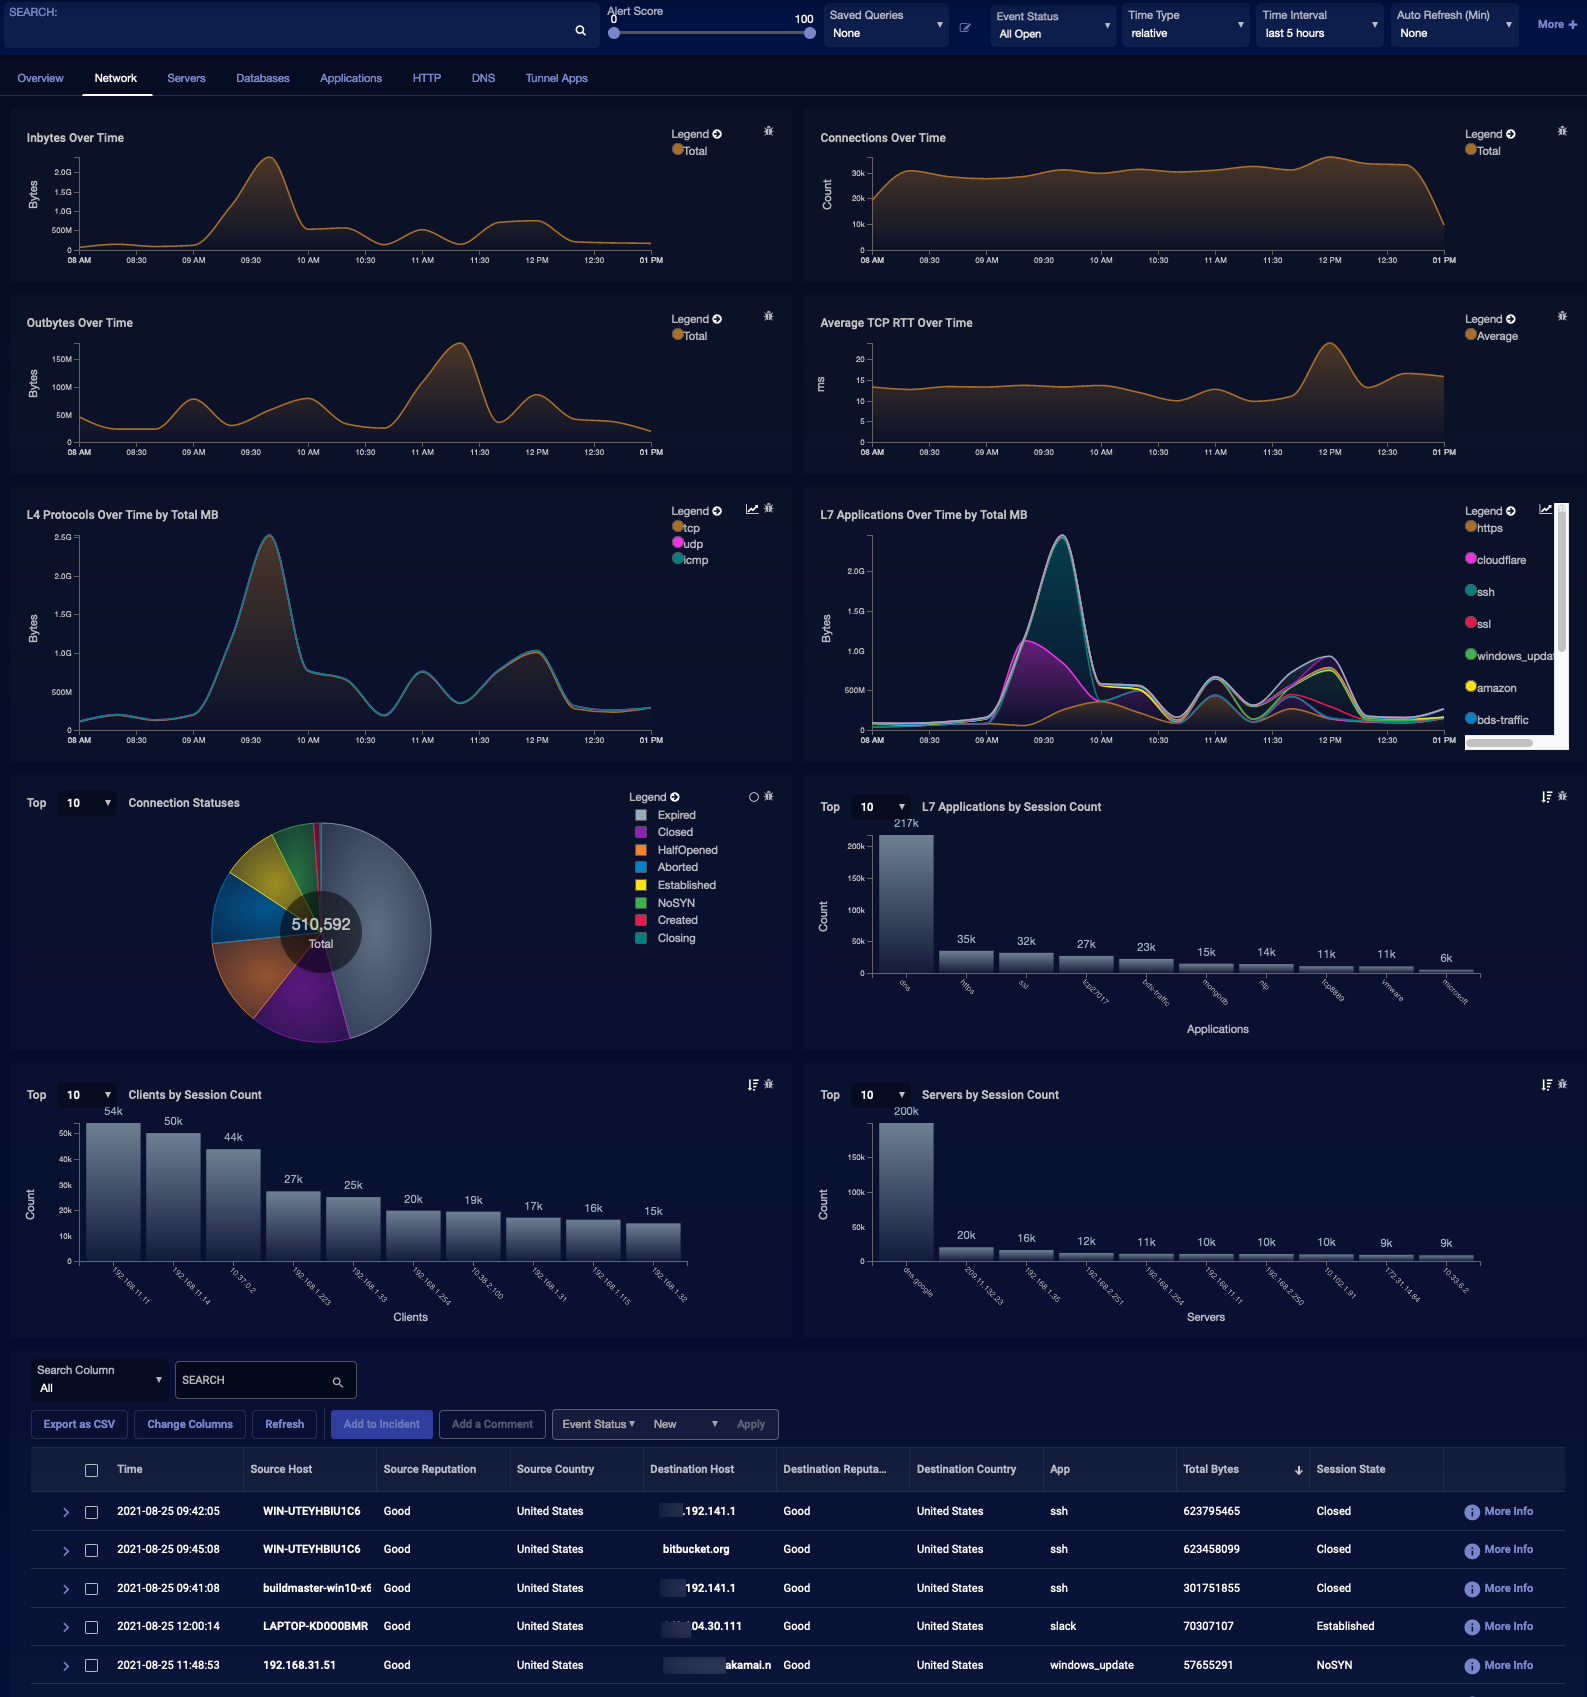
The features in this display include:
-
Inbytes Over Time (MB)
-
Connections Over Time
-
Outbytes Over Time (MB)
-
Average TCP RTT Over Time
-
L4 Protocols Over Time by Total MB
-
L7 Applications Over Time by Total MB
-
Connection Statuses
-
L7 Applications by Session Count
-
Clients by Session Count
-
Servers by Session Count
-
Interflow Record Table
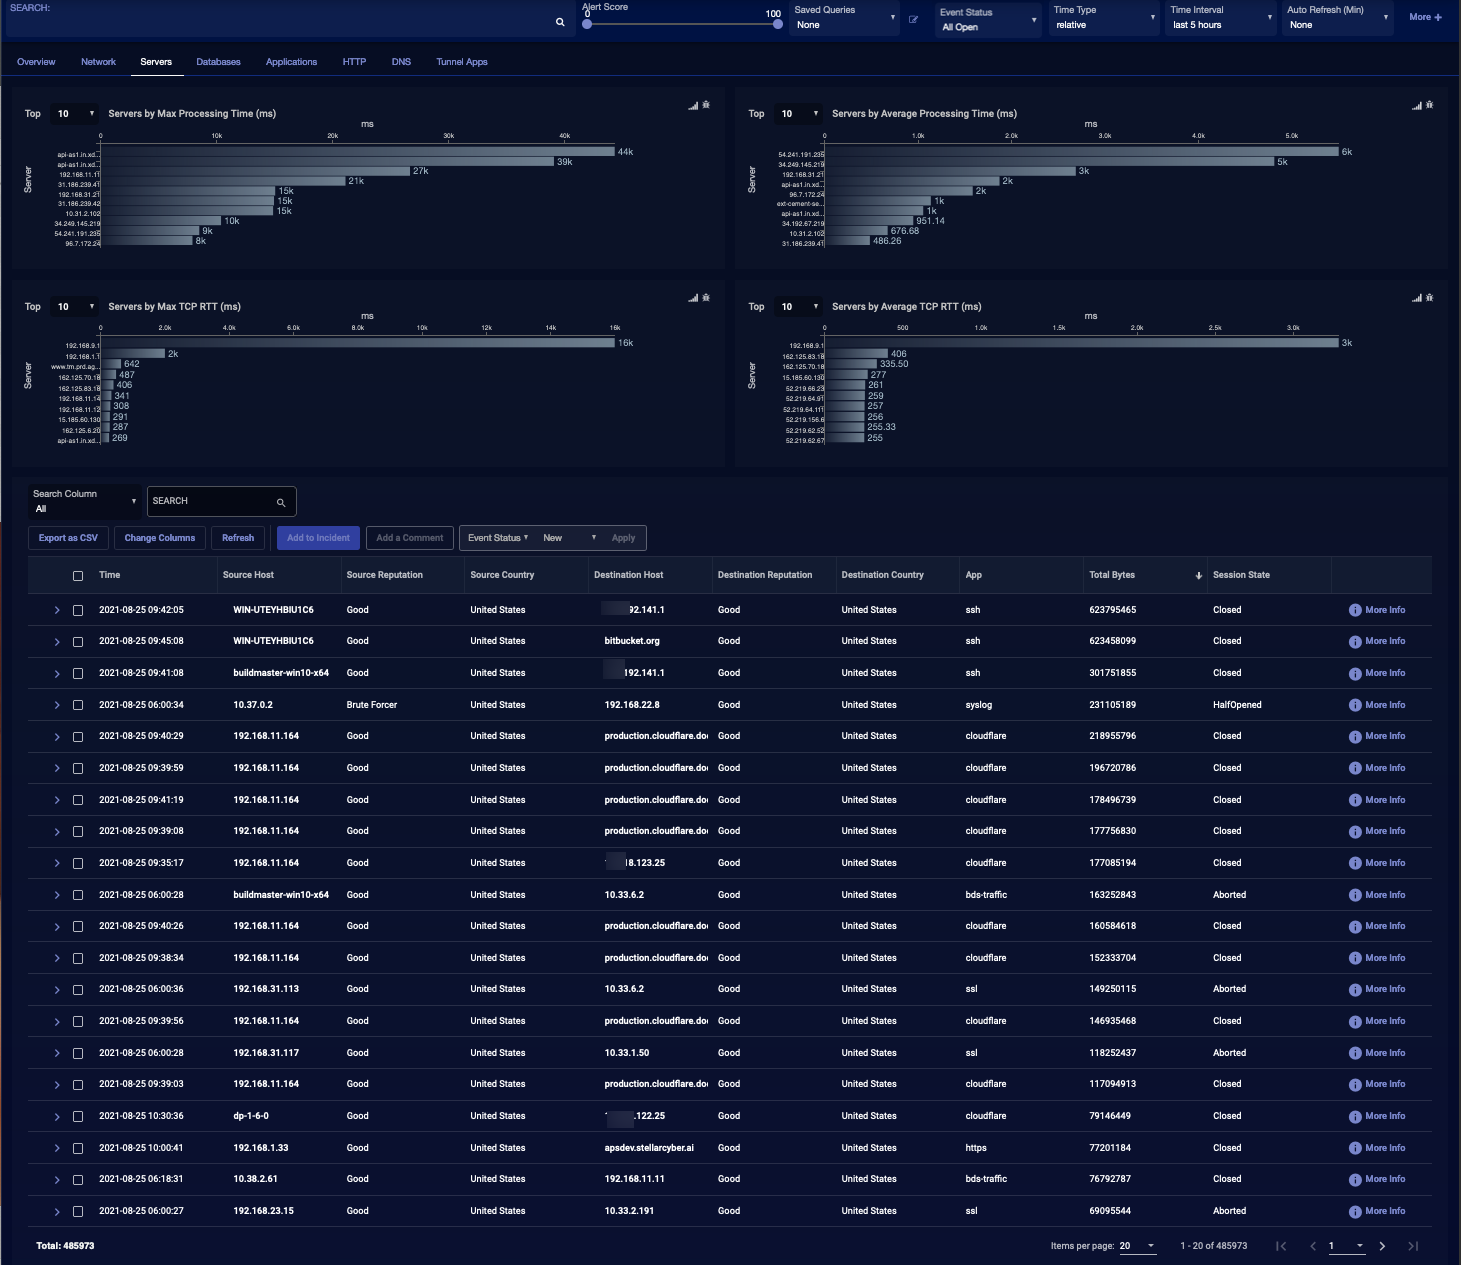
Servers
The Servers display contains the following components:
-
Servers by Max Processing Time (ms)
-
Servers by Average Processing Time (ms)
-
Servers by Max TCP RTT (ms)
-
Servers by Average TCP RTT (ms)
-
Interflow Record Table
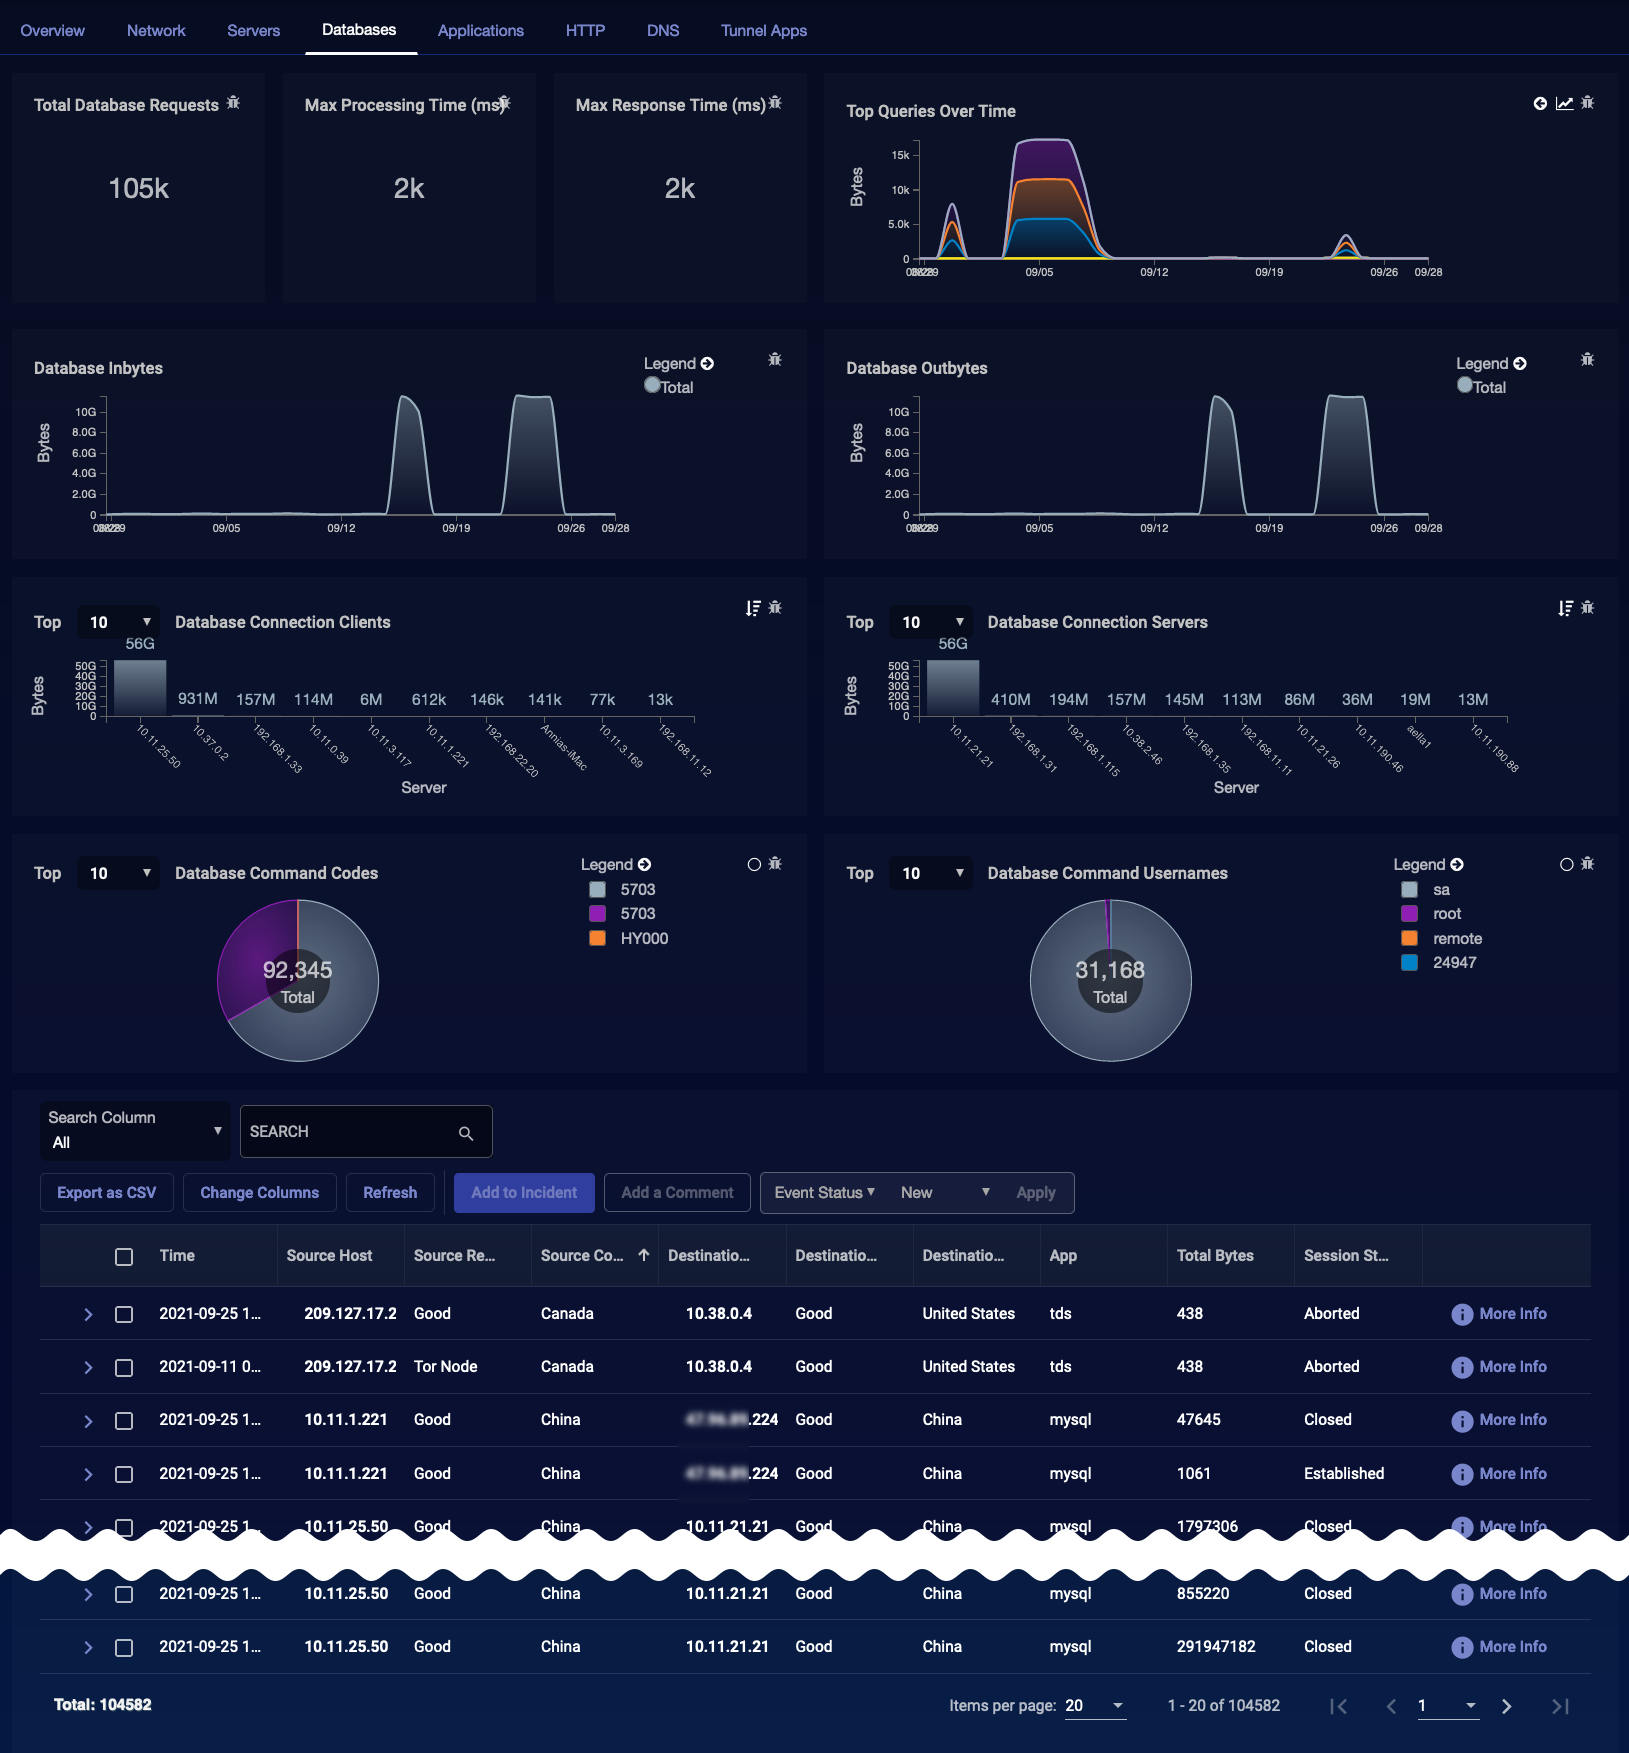
Databases
The Databases dashboard includes:
-
Total Database Requests
-
Max Processing Time (ms)
-
Max Response Time (ms)
-
Top Queries Over Time
-
Database Inbytes
-
Database Outbytes
-
Database Connection Clients
-
Database Connection Servers
-
Database Command Codes
-
Database Command Usernames
-
Interflow Record Table
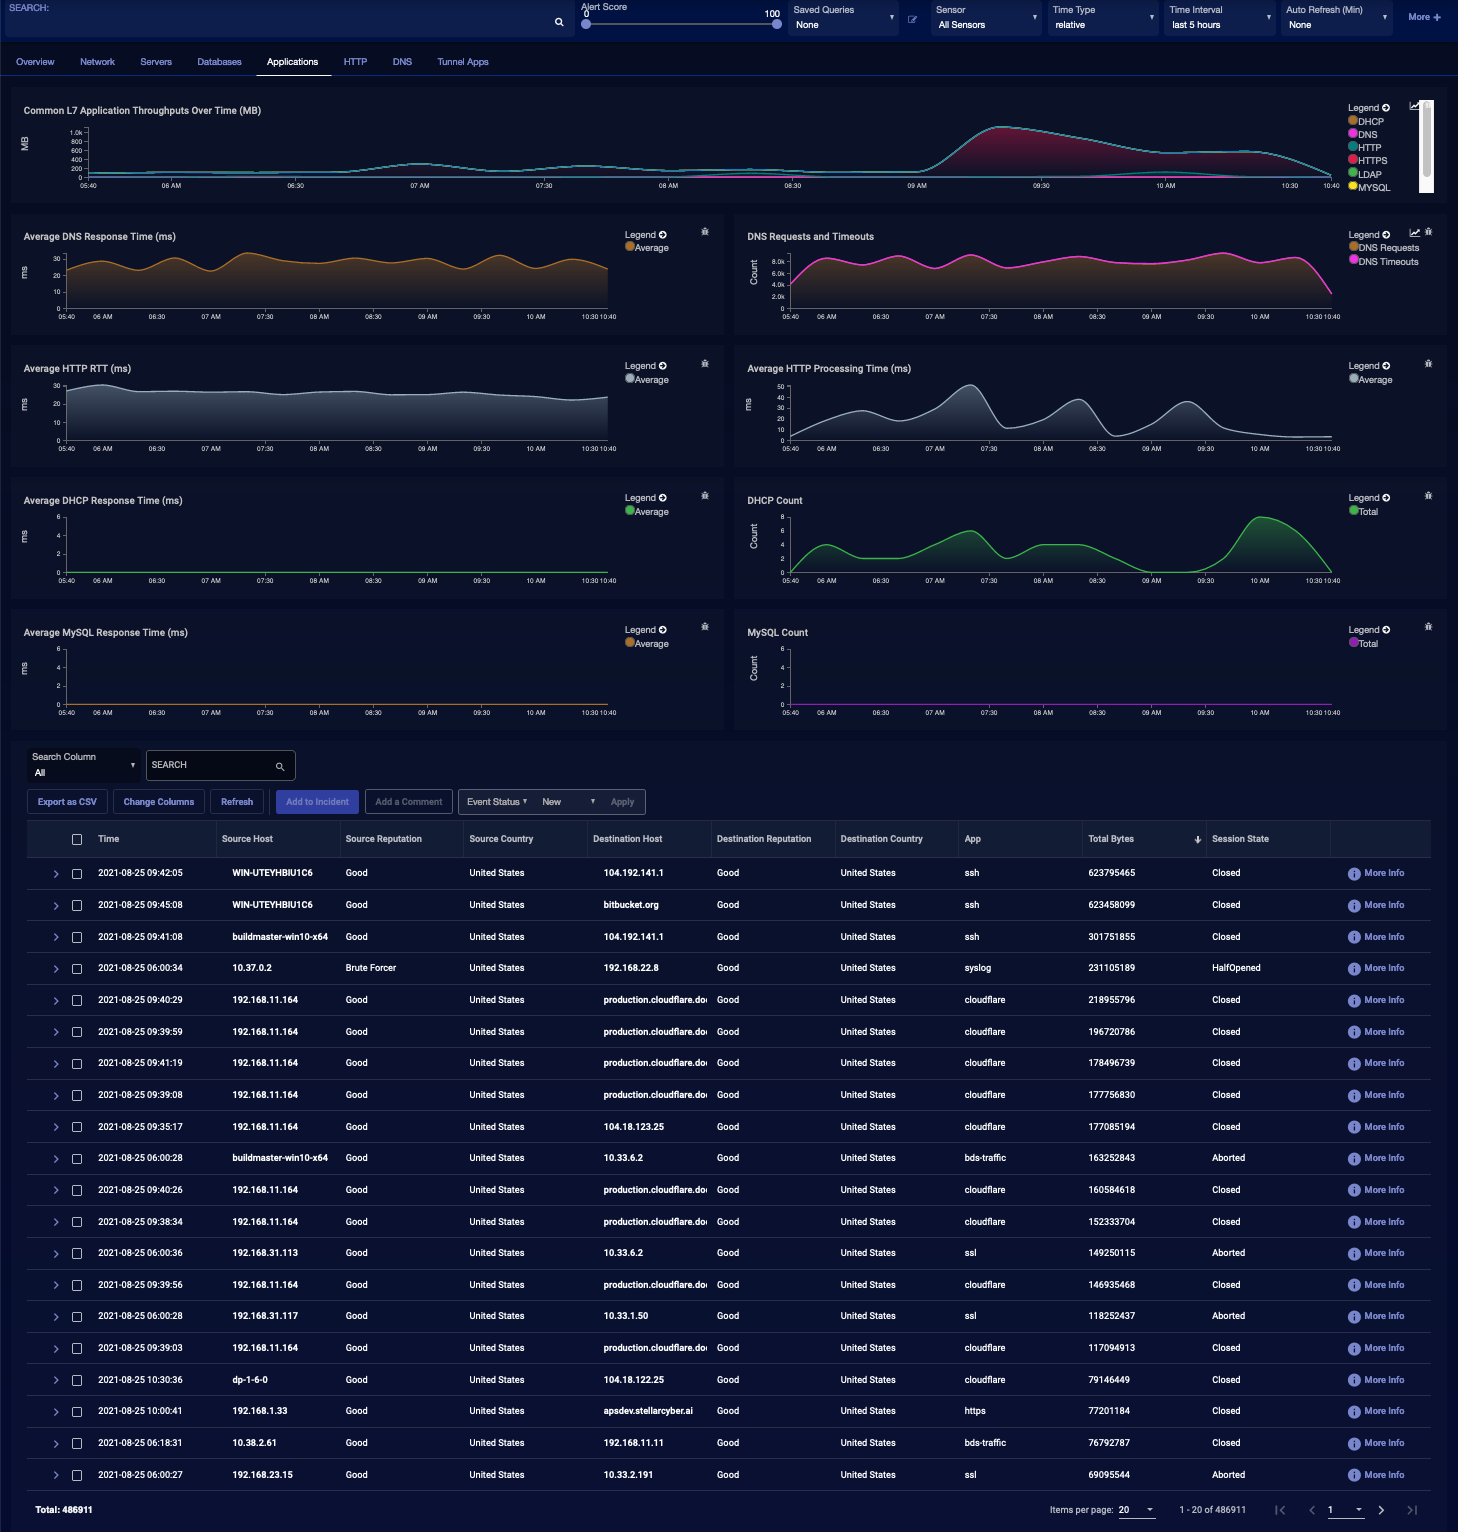
Applications
When the Applications display includes:
-
Common L7 Application Throughputs Over Time (MB)
-
Average DNS Response Time (ms)
-
DNS Requests and Timeouts
-
Average HTTP RTT (ms)
-
Average HTTP Processing Time (ms)
-
Average DHCP Response Time (ms)
-
DHCP Count
-
Average MySQL Response Time (ms)
-
MySQL Count
-
Interflow Record Table
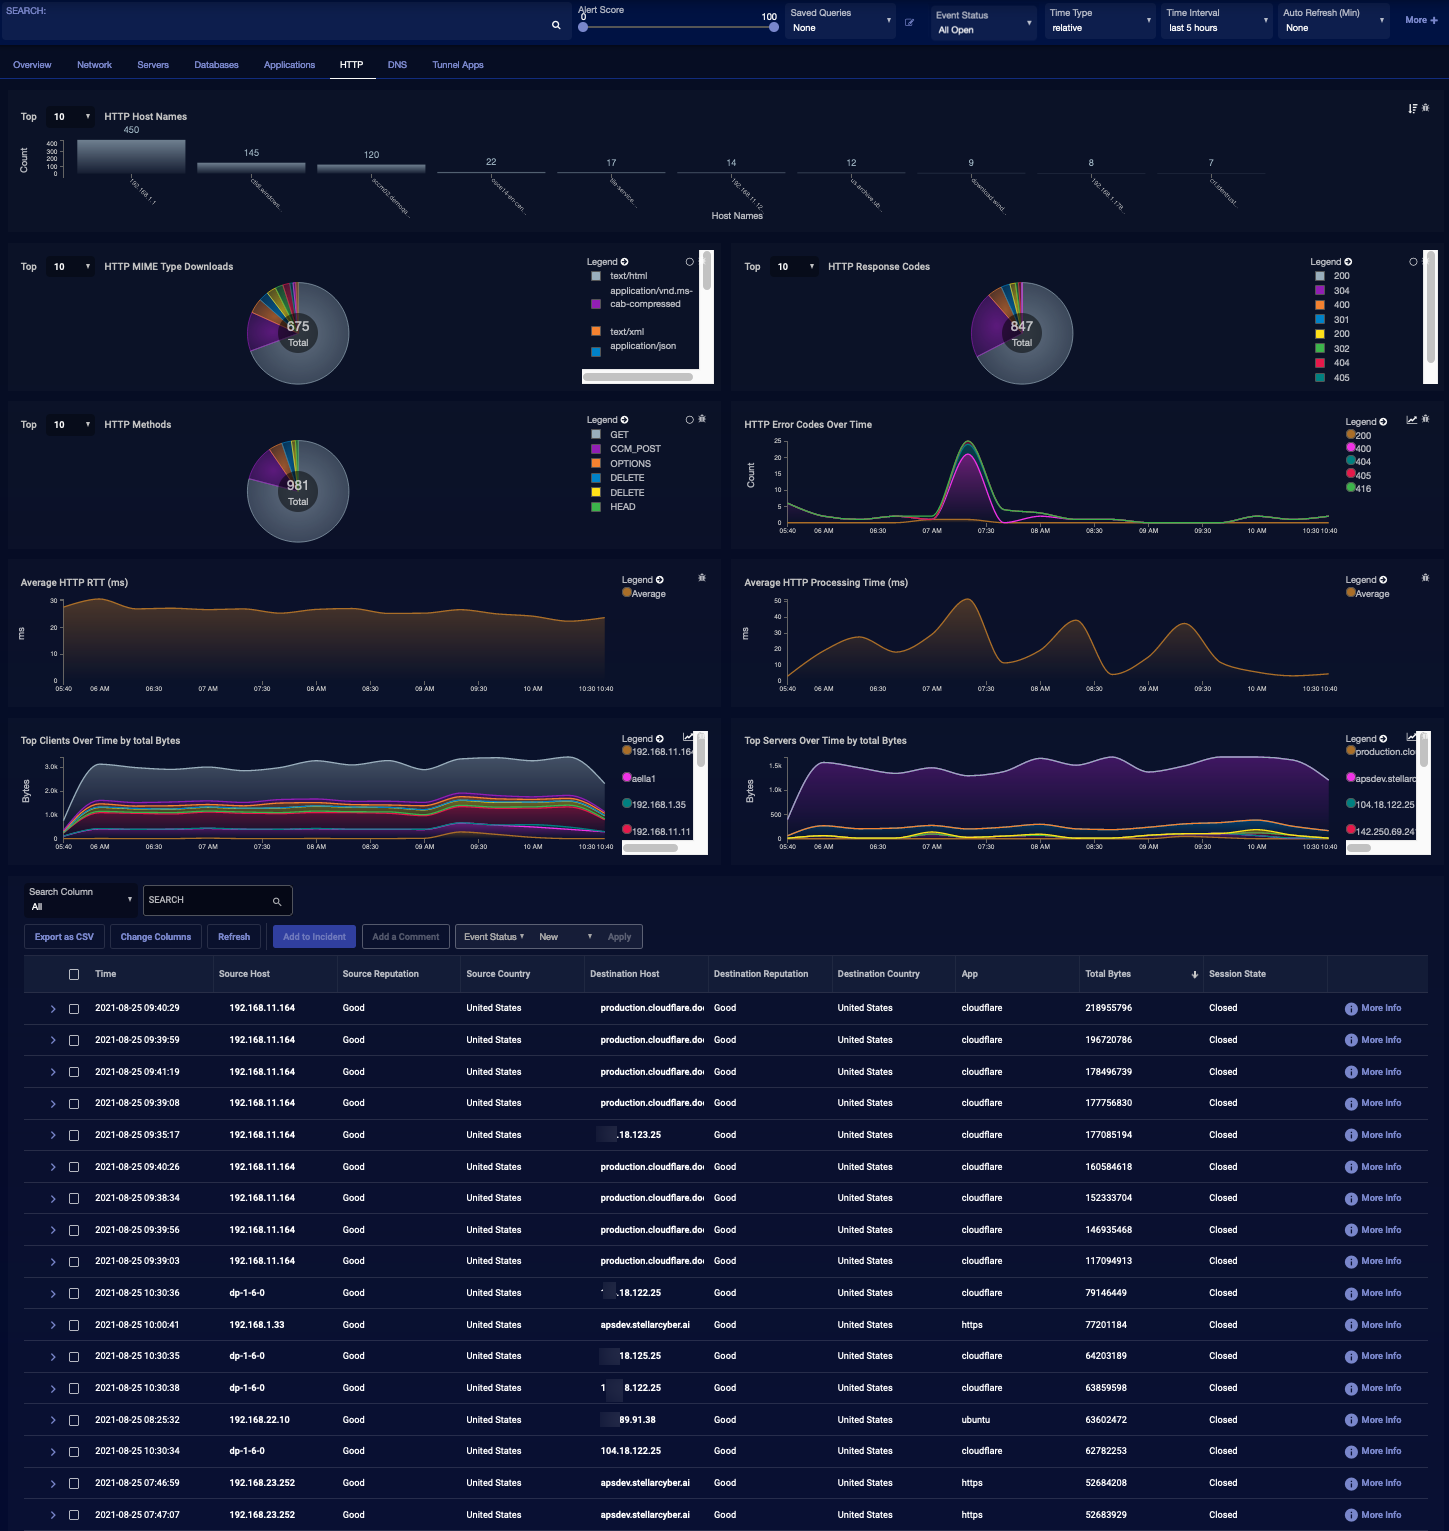
HTTP
The HTTP display includes:
- HTTP Host Names
- HTTP MIME Type Downloads
- HTTP Response Codes
- HTTP Methods
- HTTP Error Codes Over Time
- Average HTTP RTT (ms)
- Average HTTP Processing Time (ms)
- Top Clients Over Time by total Bytes
- Top Servers Over Time by total Bytes
- Interflow Record Table
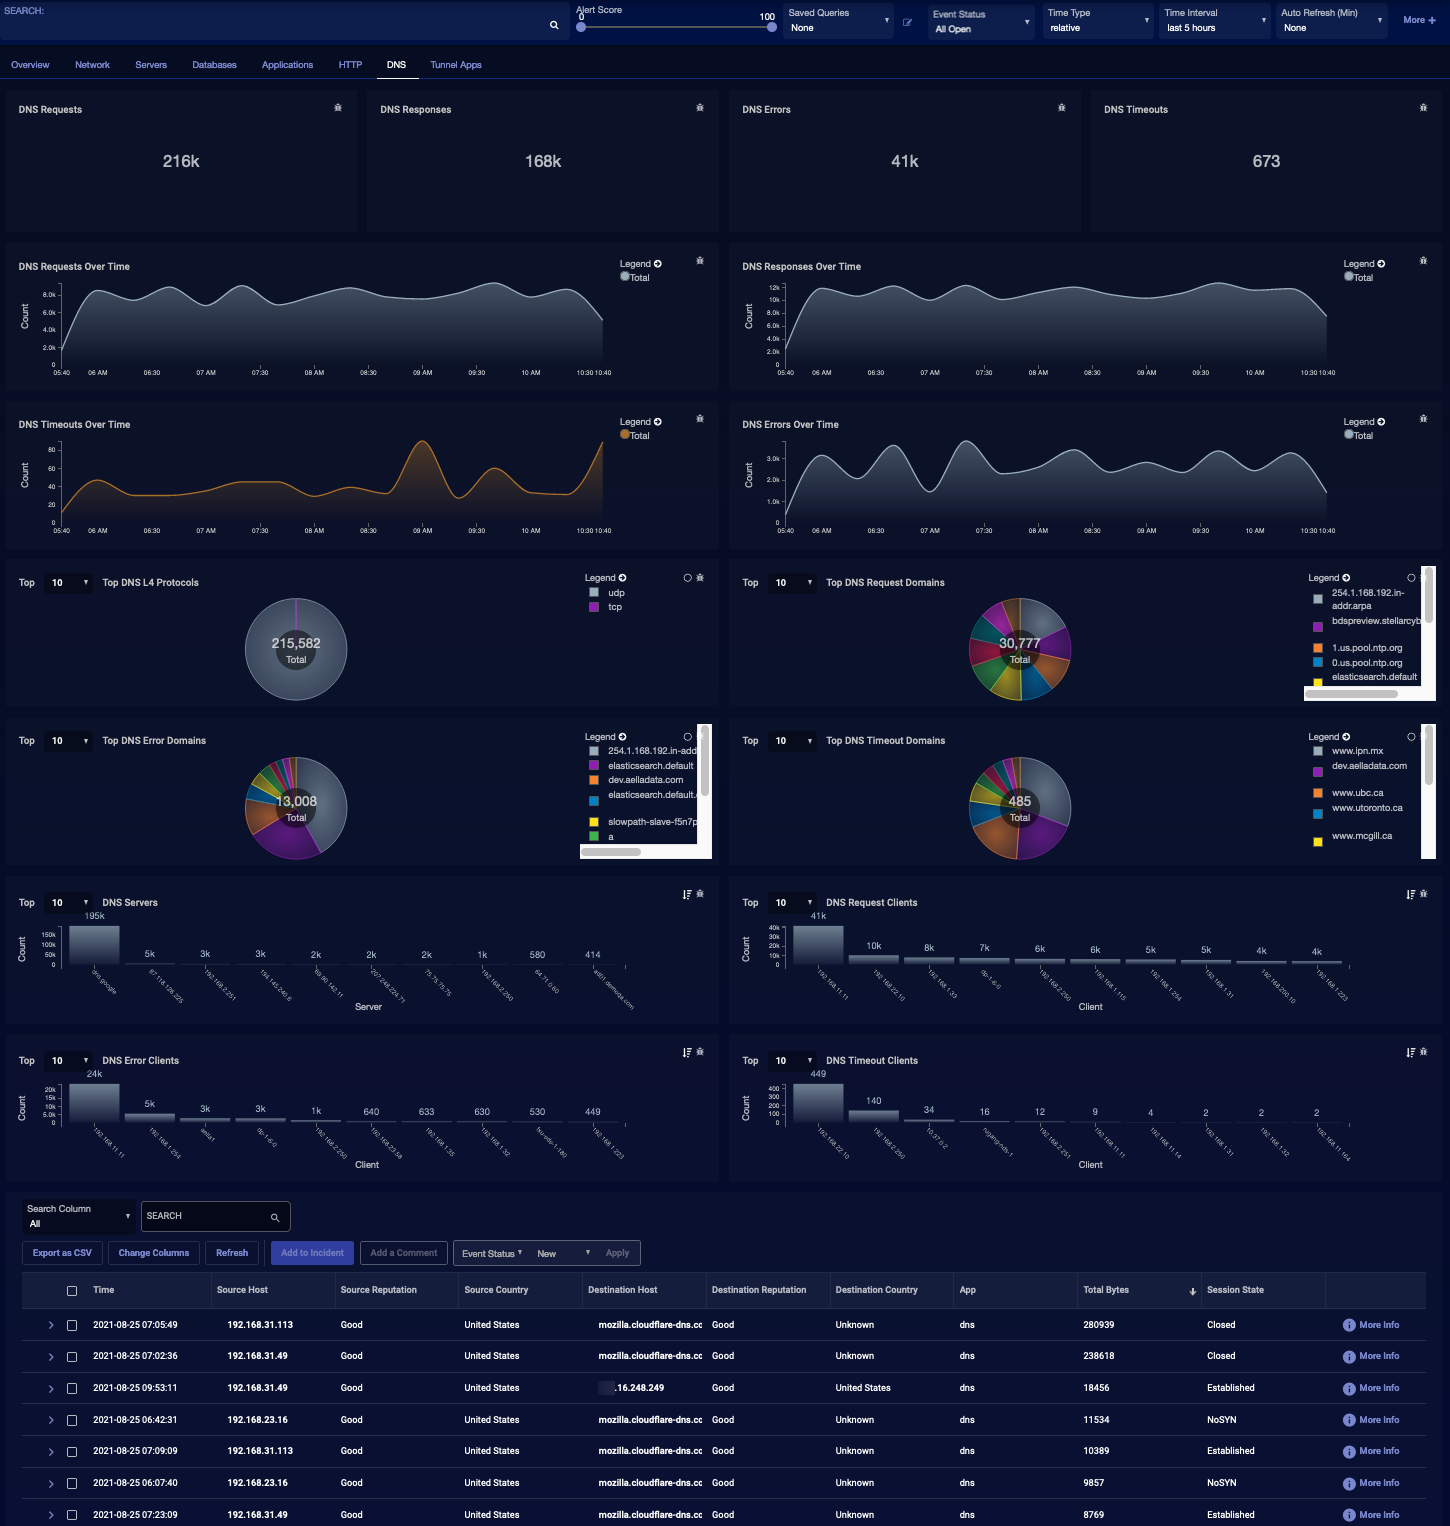
DNS
The DNS display includes:
-
DNS Requests
-
DNS Responses
-
DNS Errors
-
DNS Timeouts
-
DNS Requests Over Time
-
DNS Responses Over Time
-
DNS Timeouts Over Time
-
DNS Errors Over Time
-
Top DNS L4 Protocols
-
Top DNS Request Domains
-
Top DNS Error Domains
-
Top DNS Timeout Domains
-
DNS Servers
-
DNS Request Clients
-
DNS Error Clients
-
DNS Timeout Clients
-
Interflow Record Table
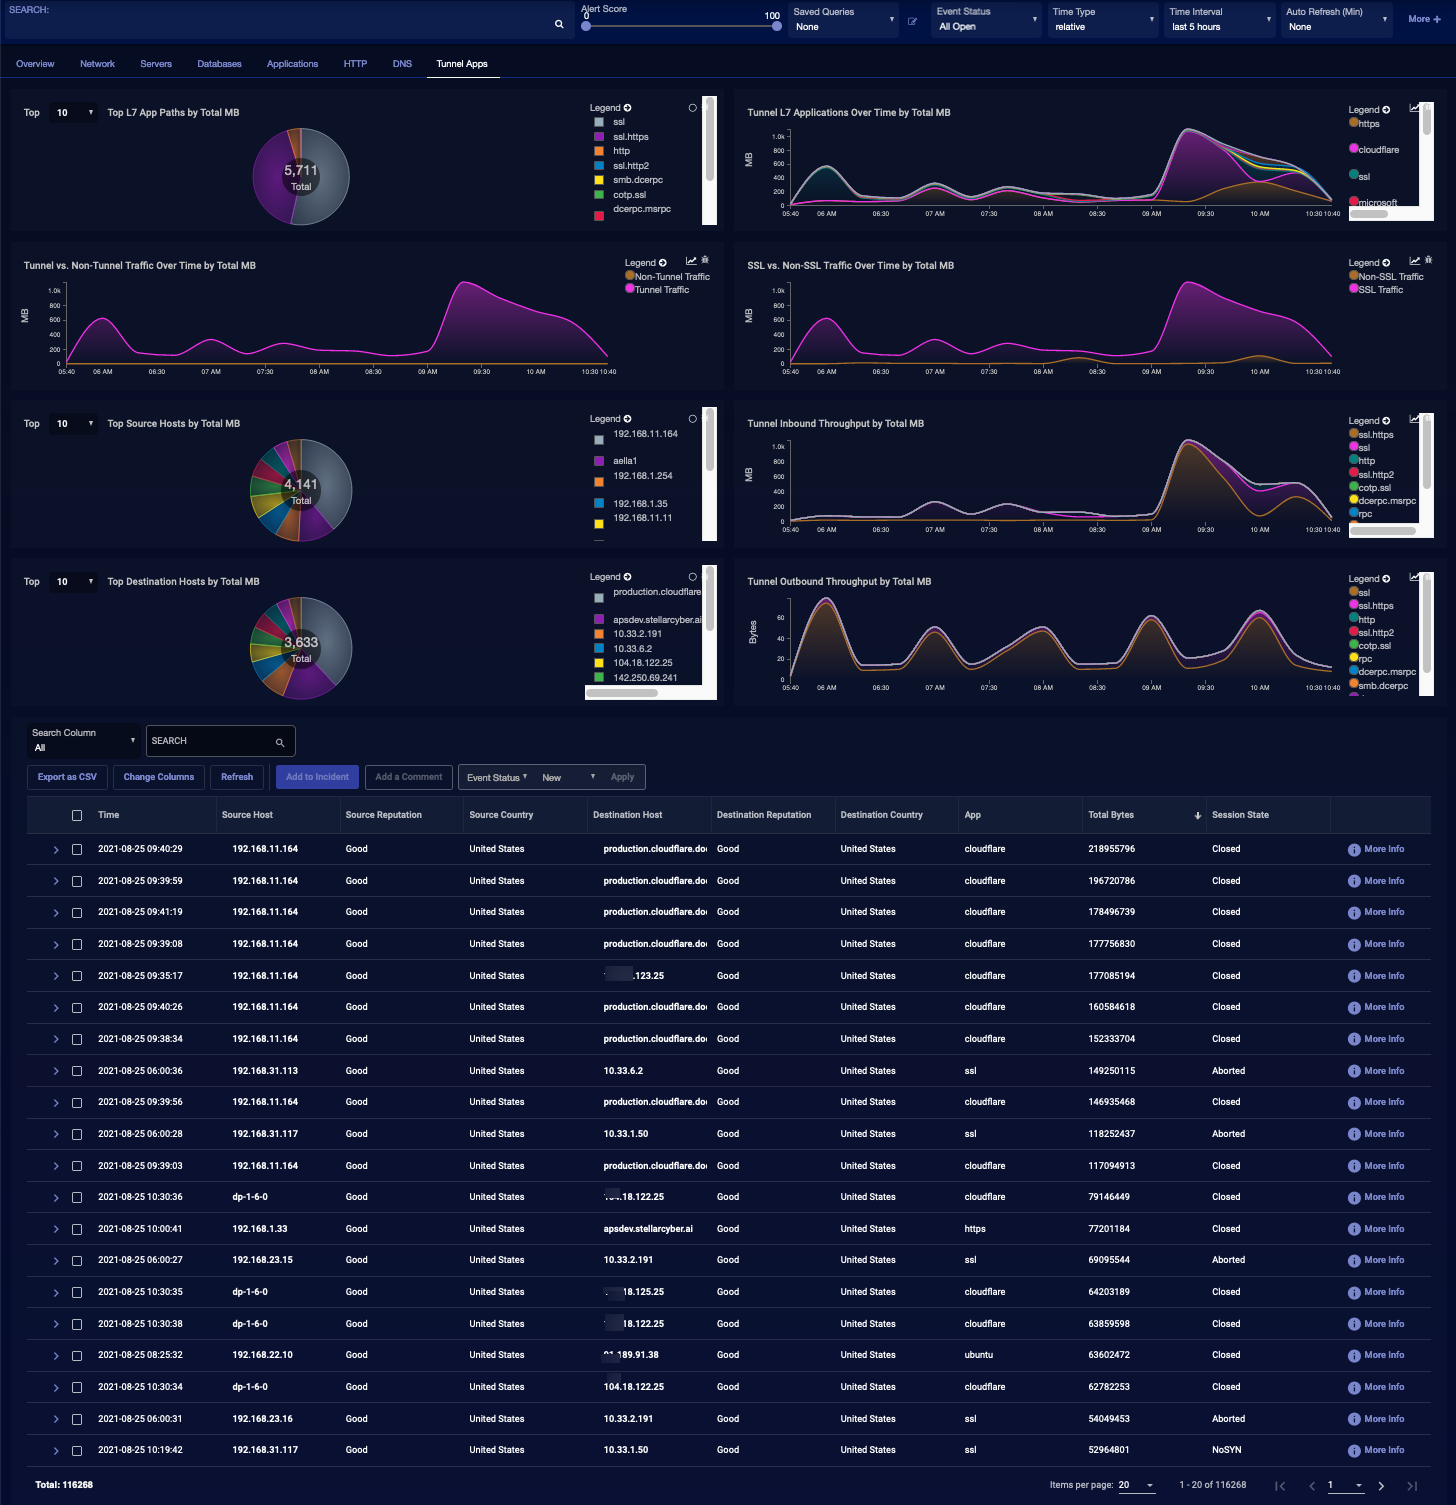
Tunnel Apps
The Tunnel Apps display includes:
-
Top L7 App Ports by Total MB
-
Tunnel L7 Applications Over Time by Total MB
-
Tunnel vs. Non-Tunnel Traffic Over Time by Total MB
-
SSL vs. Non-SSL Traffic Over Time by Total MB
-
Top Source Hosts by Total MB
-
Tunnel Inbound Throughput by Total MB
-
Top Destination Hosts by Total MB
-
Tunnel Outbound Throughput by Total MB
-
Interflow Record Table