Configuring Palo Alto Networks CORTEX XDR Connectors
This connector allows Stellar Cyber to ingest logs from Palo Alto Networks CORTEX XDR and add the records to the data lake.
The Palo Alto Networks CORTEX XDR connector integrates with the Palo Alto Networks CORTEX XDR API to process XDR information and query for several content types.
Stellar Cyber connectors with the Collect function (collectors) may skip collecting some data when the ingestion volume is large, which potentially can lead to data loss. This can happen when the processing capacity of the collector is exceeded.
Connector Overview: Palo Alto Networks CORTEX XDR
Capabilities
-
Collect: Yes
-
Respond: No
-
Native Alerts Mapped: No
-
Runs on: DP
-
Interval: N/A
Collected Data
|
Content Type |
Index |
Locating Records |
|---|---|---|
|
Alerts Audit Agent Report Logs Audit Management Logs Endpoints Incidents Risky Hosts Risky Users Users |
Syslog |
The Alerts Content Type can result in more than one msg_class as follows:
-
one
palo_alto_networks_cortex_xdr_alerts -
multiple
palo_alto_networks_cortex_xdr_events
You cannot select palo_alto_networks_cortex_xdr_events as a Content Type.
Domain
|
<FQDN> where <FQDN> is a variable from the configuration of this connector |
Response Actions
N/A
Third Party Native Alert Integration Details
N/A
Required Credentials
-
API Key ID, API Key, and FQDN
Let us know if you find the above overview useful.
Adding a CORTEX XDR Connector
To add a Palo Alto Networks CORTEX XDR connector:
Obtaining CORTEX XDR Credentials
Before you configure the connector in Stellar Cyber, you must obtain the following Palo Alto Networks CORTEX XDR credentials:
-
API Key ID
-
API Key
The API Key has an optional expiration time that can be set by the user.
-
FQDN
To generate the API Key:
-
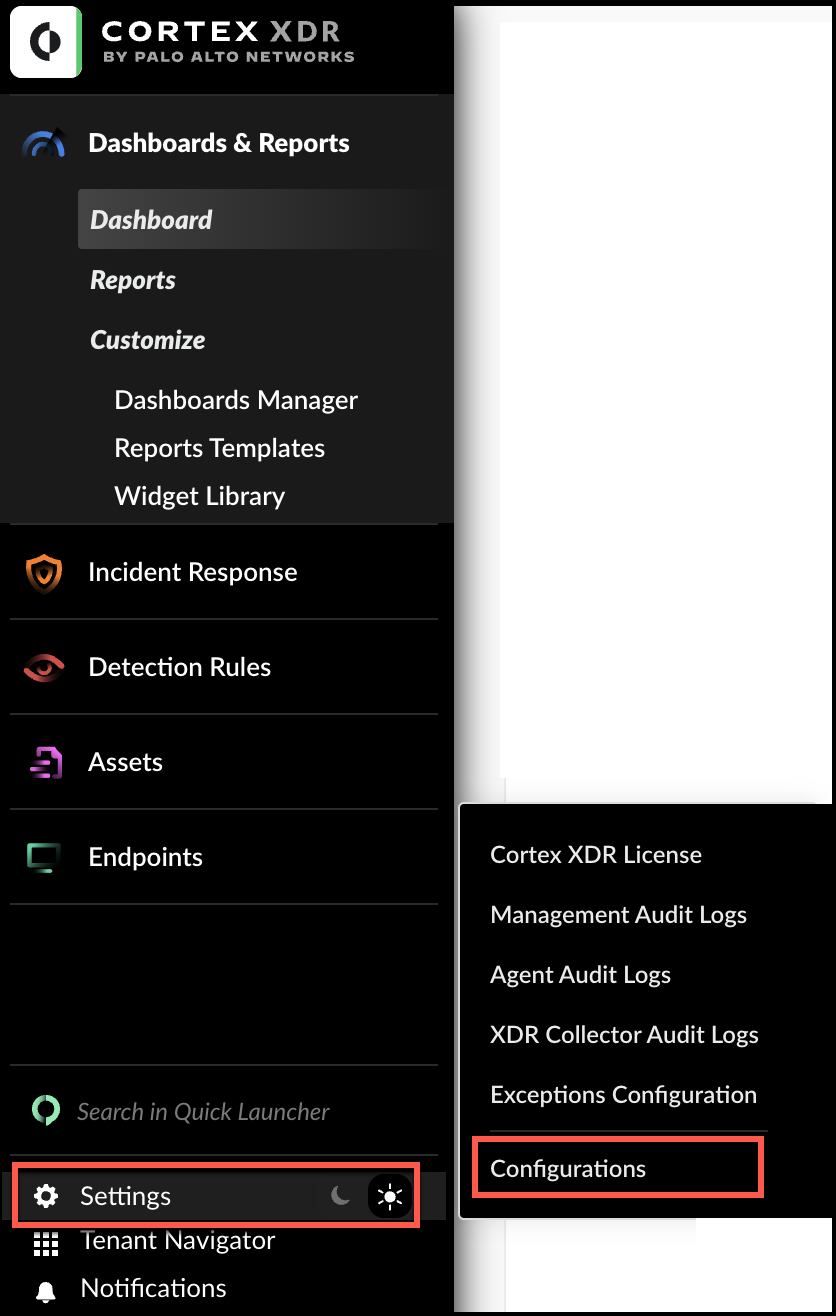
Log in as an administrative user to the CORTEX XDR portal.
-
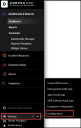
Navigate to Settings | Configurations.
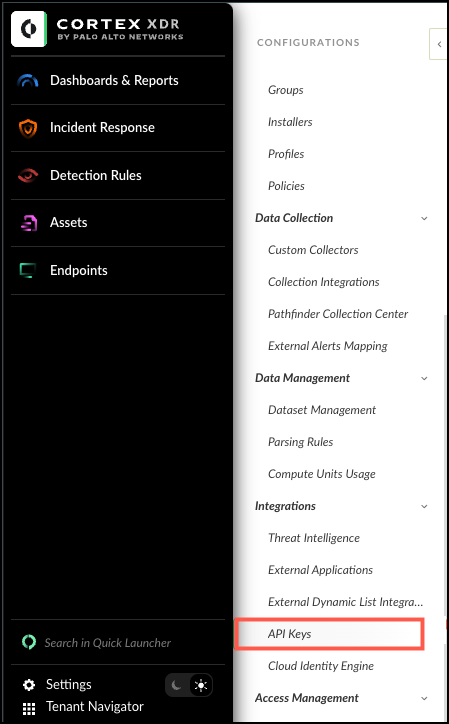
-
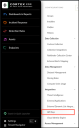
In Configurations, select API Keys under Integrations.
-
In the top-right corner, click New Key.
-
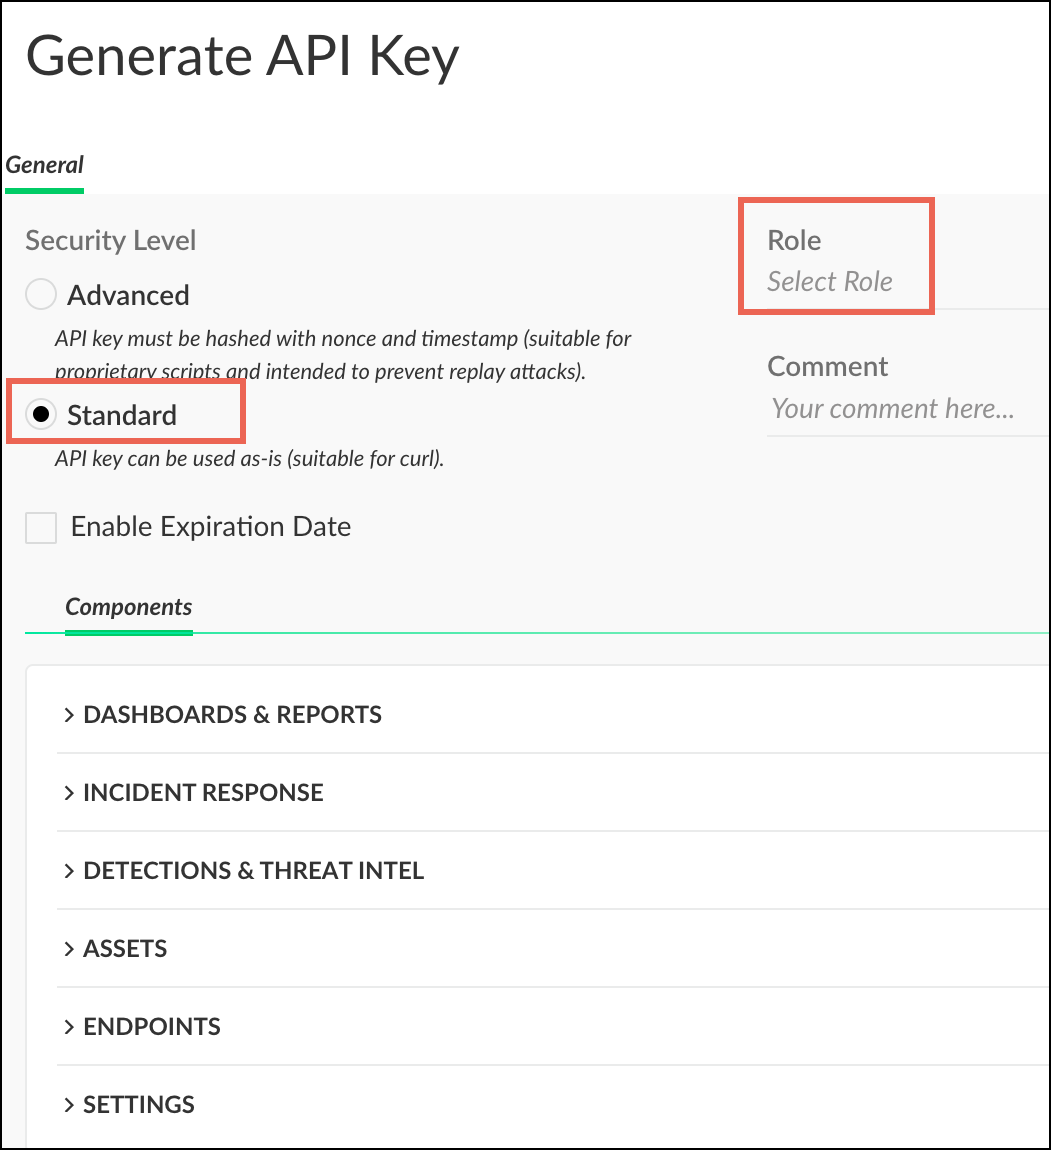
In the Generate API Key page, select either Standard or Advanced for the Security Level of the API key, then select the Role that gives you the appropriate access level for this key.
Ensure that the role associated with the account has permission for the content type.
For Standard:
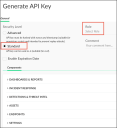
For Advanced:
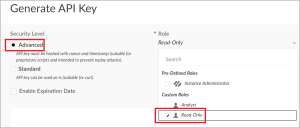
To integrate with CORTEX XSOAR, you must generate an Advanced key.
-
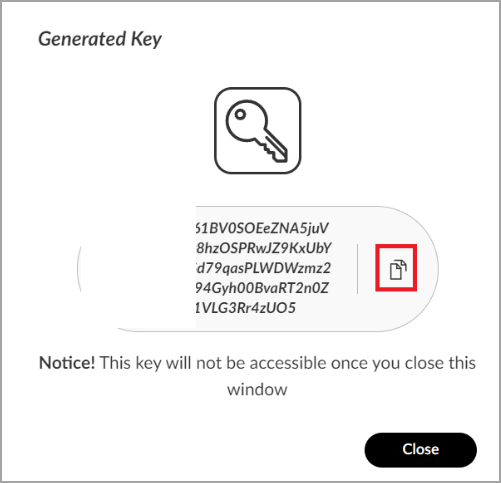
Click Generate.
-
Copy the API key, which you will need when configuring the connector in Stellar Cyber.
Store the API key in a safe location. It cannot be retrieved later although it can be regenerated.
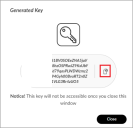
-
Click Close.
-
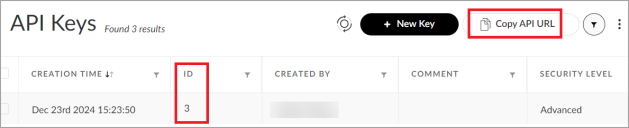
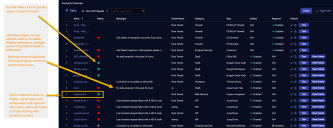
In the API Keys page, locate the API key in the table and note the API key ID, which you will need when configuring the connector in Stellar Cyber.
-
In the API Keys page, select the API key in the table and click Copy API URL. This is the FQDN, which you will need when configuring the connector in Stellar Cyber. It will have the format: https://api-{fqdn}.


Adding the Connector in Stellar Cyber
To add a Palo Alto Networks CORTEX XDR connector in Stellar Cyber:
-
Log in to Stellar Cyber.
-
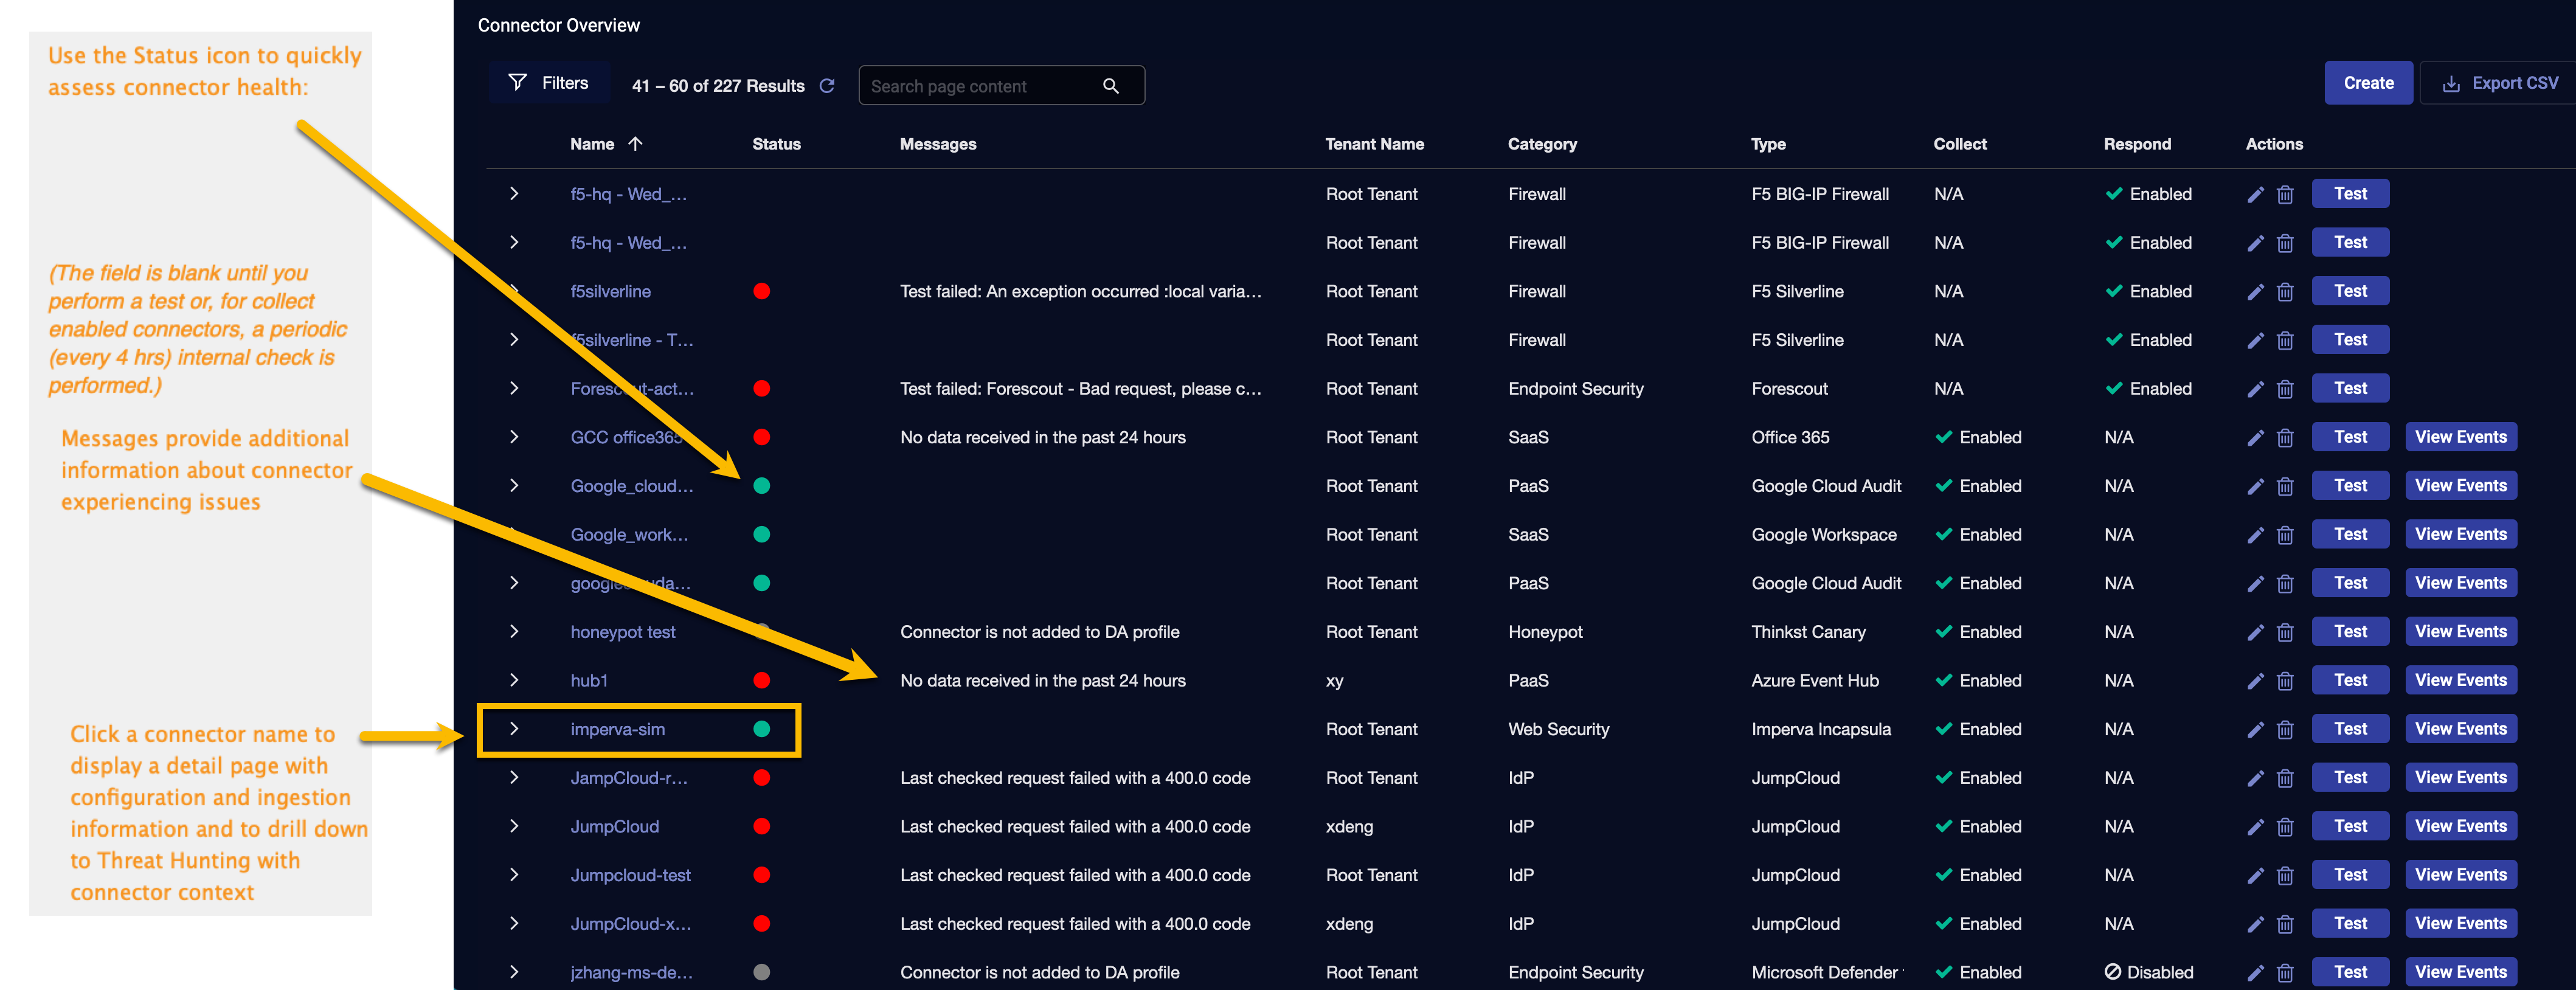
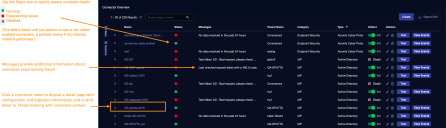
Click System | Integration | Connectors. The Connector Overview appears.
-
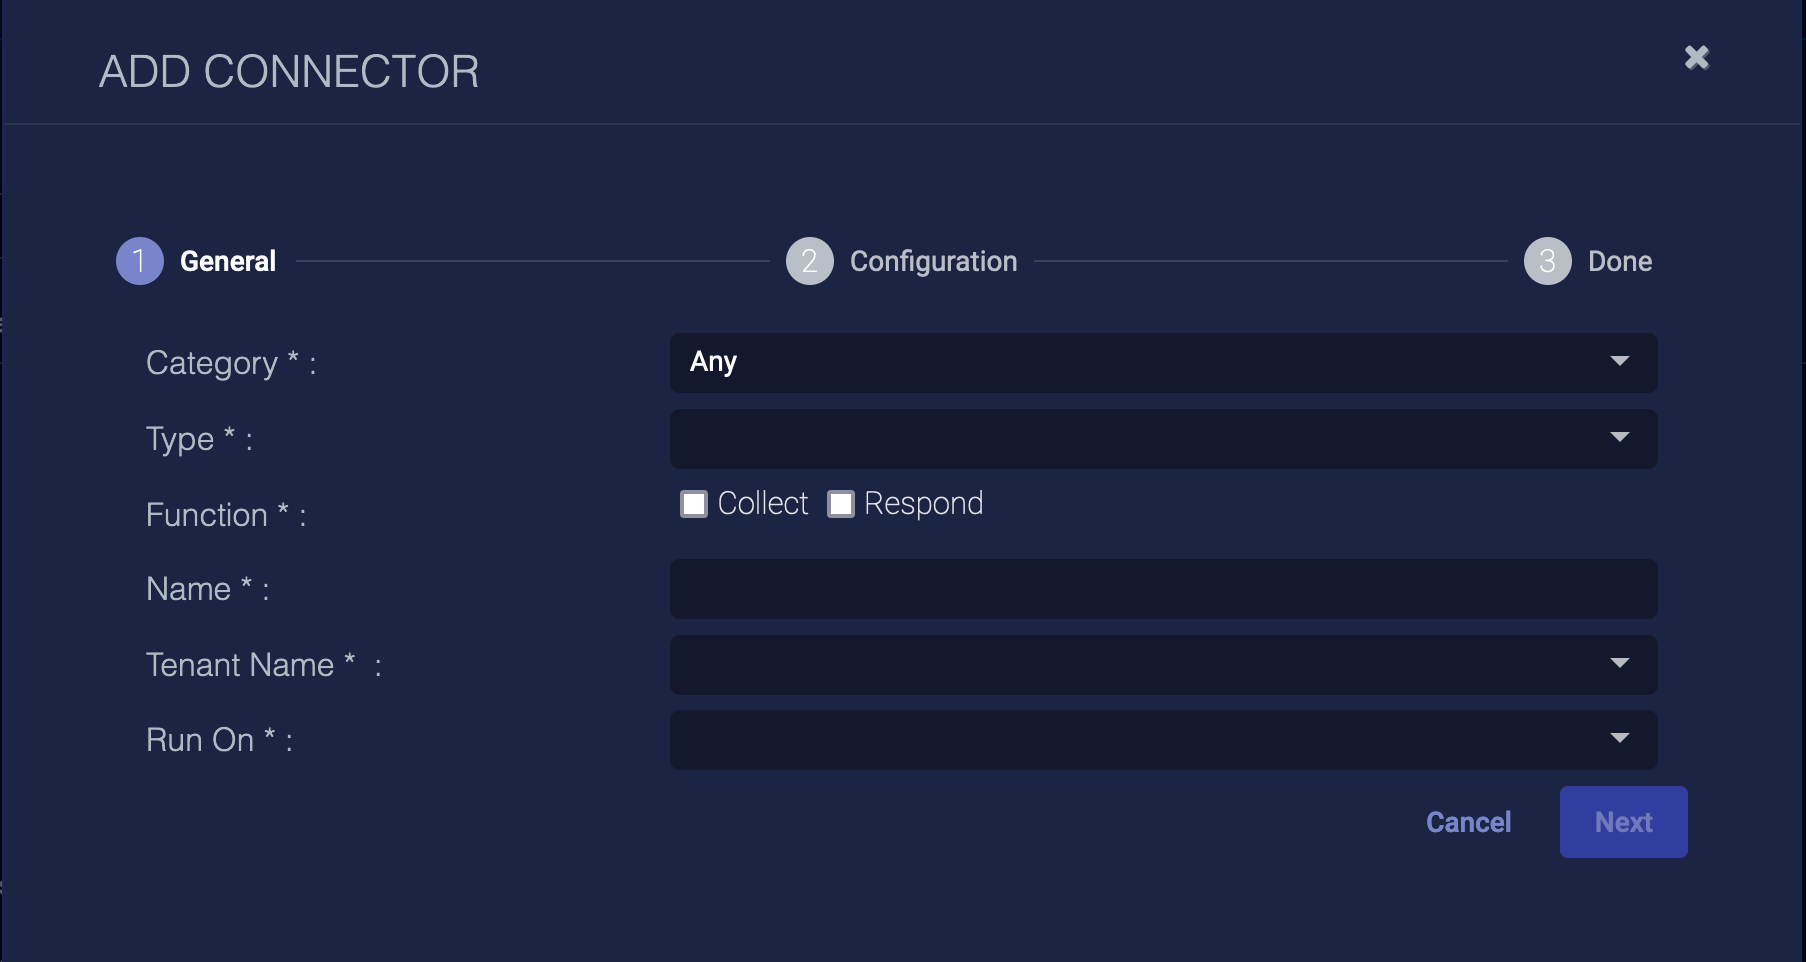
Click Create. The General tab of the Add Connector screen appears. The information on this tab cannot be changed after you add the connector.

The asterisk (*) indicates a required field.
-
Choose Endpoint Security from the Category drop-down.
-
Choose Palo Alto Networks CORTEX XDR from the Type drop-down.
-
For this connector, the supported Function is Collect, which is enabled already.
-
Enter a Name.
Notes:- This field does not accept multibyte characters.
- It is recommended that you follow a naming convention such as tenantname-connectortype.
-
Choose a Tenant Name. The Interflow records created by this connector include this tenant name.
-
Choose the device on which to run the connector.
-
(Optional) When the Function is Collect, you can apply Log Filters. For information, see Managing Log Filters.

-
Click Next. The Configuration tab appears.
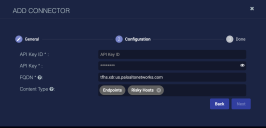
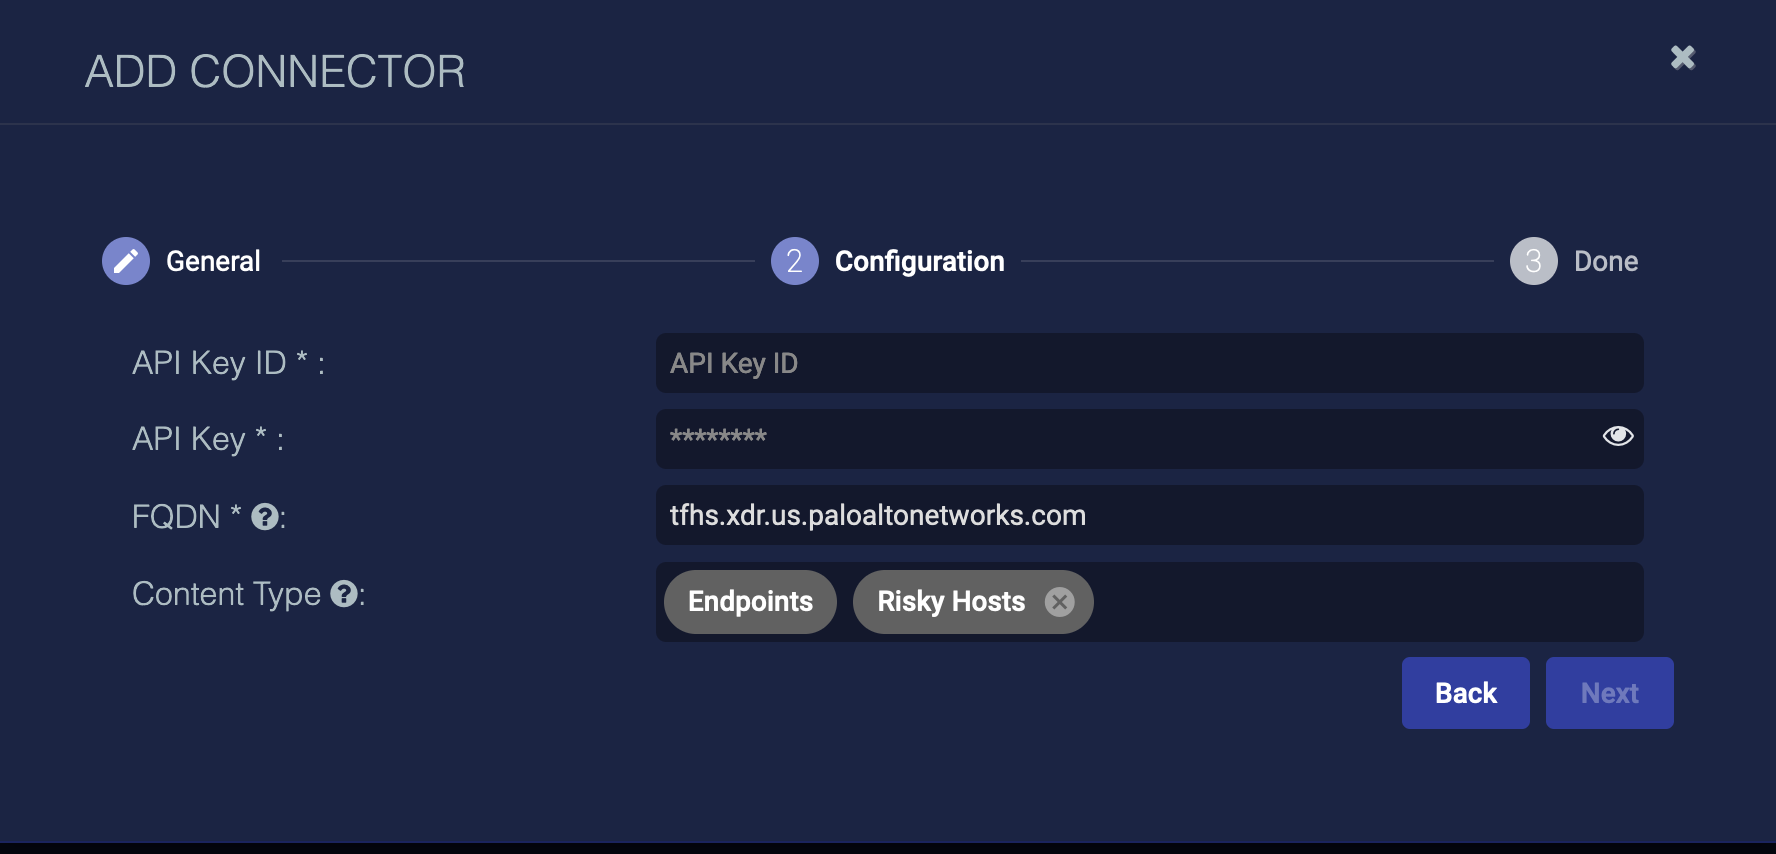
The asterisk (*) indicates a required field.
-
Enter the API Key ID you noted above in Obtaining CORTEX XDR Credentials.
-
Enter the API Key you noted above.
-
Enter the FQDN you noted above.
-
Choose the Content Type you would like to collect. The logs for Alerts, Audit Agent Report Logs, Audit Management Logs, Endpoints, Incidents, Risky Hosts, Risky Users, and Users are supported.
The Endpoints content type is always selected and cannot be removed from the configuration as it is required for host information.
The logs for Endpoints, Risky Hosts, Risky Users, and Users are queried every 24 hours.
The content types require different licenses as follows:
Content Type
Required License
Alerts Cortex XDR Prevent, Cortex XDR Pro per Endpoint, or Cortex XDR Pro per GB Audit Agent Report Logs Cortex XDR Prevent, Cortex XDR Pro per Endpoint, or Cortex XDR Pro per GB Audit Management Logs Endpoints Cortex XDR Prevent or Cortex XDR Pro per Endpoint Incidents Cortex XDR Prevent, Cortex XDR Pro per Endpoint, or Cortex XDR Pro per GB Risky Hosts Identity Threat Module Risky Users Identity Threat Module Users Cortex XDR Pro per Endpoint, Cortex XDR Pro, or Cortex XDR Pro per GB -
Click Next. The final confirmation tab appears.

-
Click Submit.
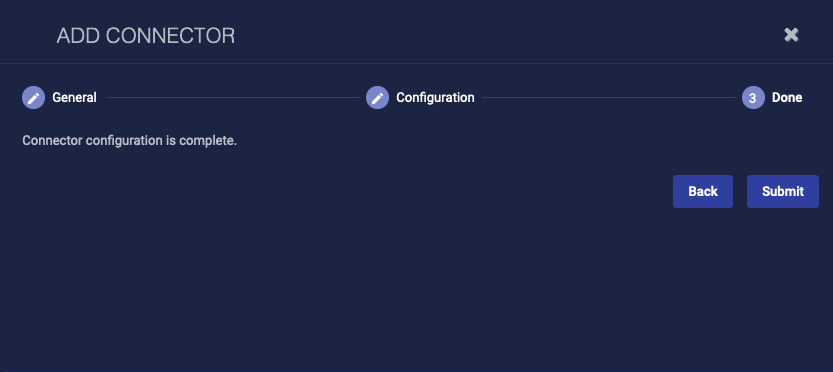
The new connector is immediately active.
Testing the Connector
When you add (or edit) a connector, we recommend that you run a test to validate the connectivity parameters you entered. (The test validates only the authentication / connectivity; it does not validate data flow).
For connectors running on a sensor, Stellar Cyber recommends that you allow 30-60 seconds for new or modified configuration details to be propagated to the sensor before performing a test.
-
Click System | Integrations | Connectors. The Connector Overview appears.
-
Locate the connector that you added, or modified, or that you want to test.
-
Click Test at the right side of that row. The test runs immediately.
Note that you may run only one test at a time.
Stellar Cyber conducts a basic connectivity test for the connector and reports a success or failure result. A successful test indicates that you entered all of the connector information correctly.
To aid troubleshooting your connector, the dialog remains open until you explicitly close it by using the X button. If the test fails, you can select the button from the same row to review and correct issues.
The connector status is updated every five (5) minutes. A successful test clears the connector status, but if issues persist, the status reverts to failed after a minute.
Repeat the test as needed.


If the test fails, the common HTTP status error codes are as follows:
| HTTP Error Code | HTTP Standard Error Name | Explanation | Recommendation |
|---|---|---|---|
| 400 | Bad Request | This error occurs when there is an error in the connector configuration. |
Did you configure the connector correctly? |
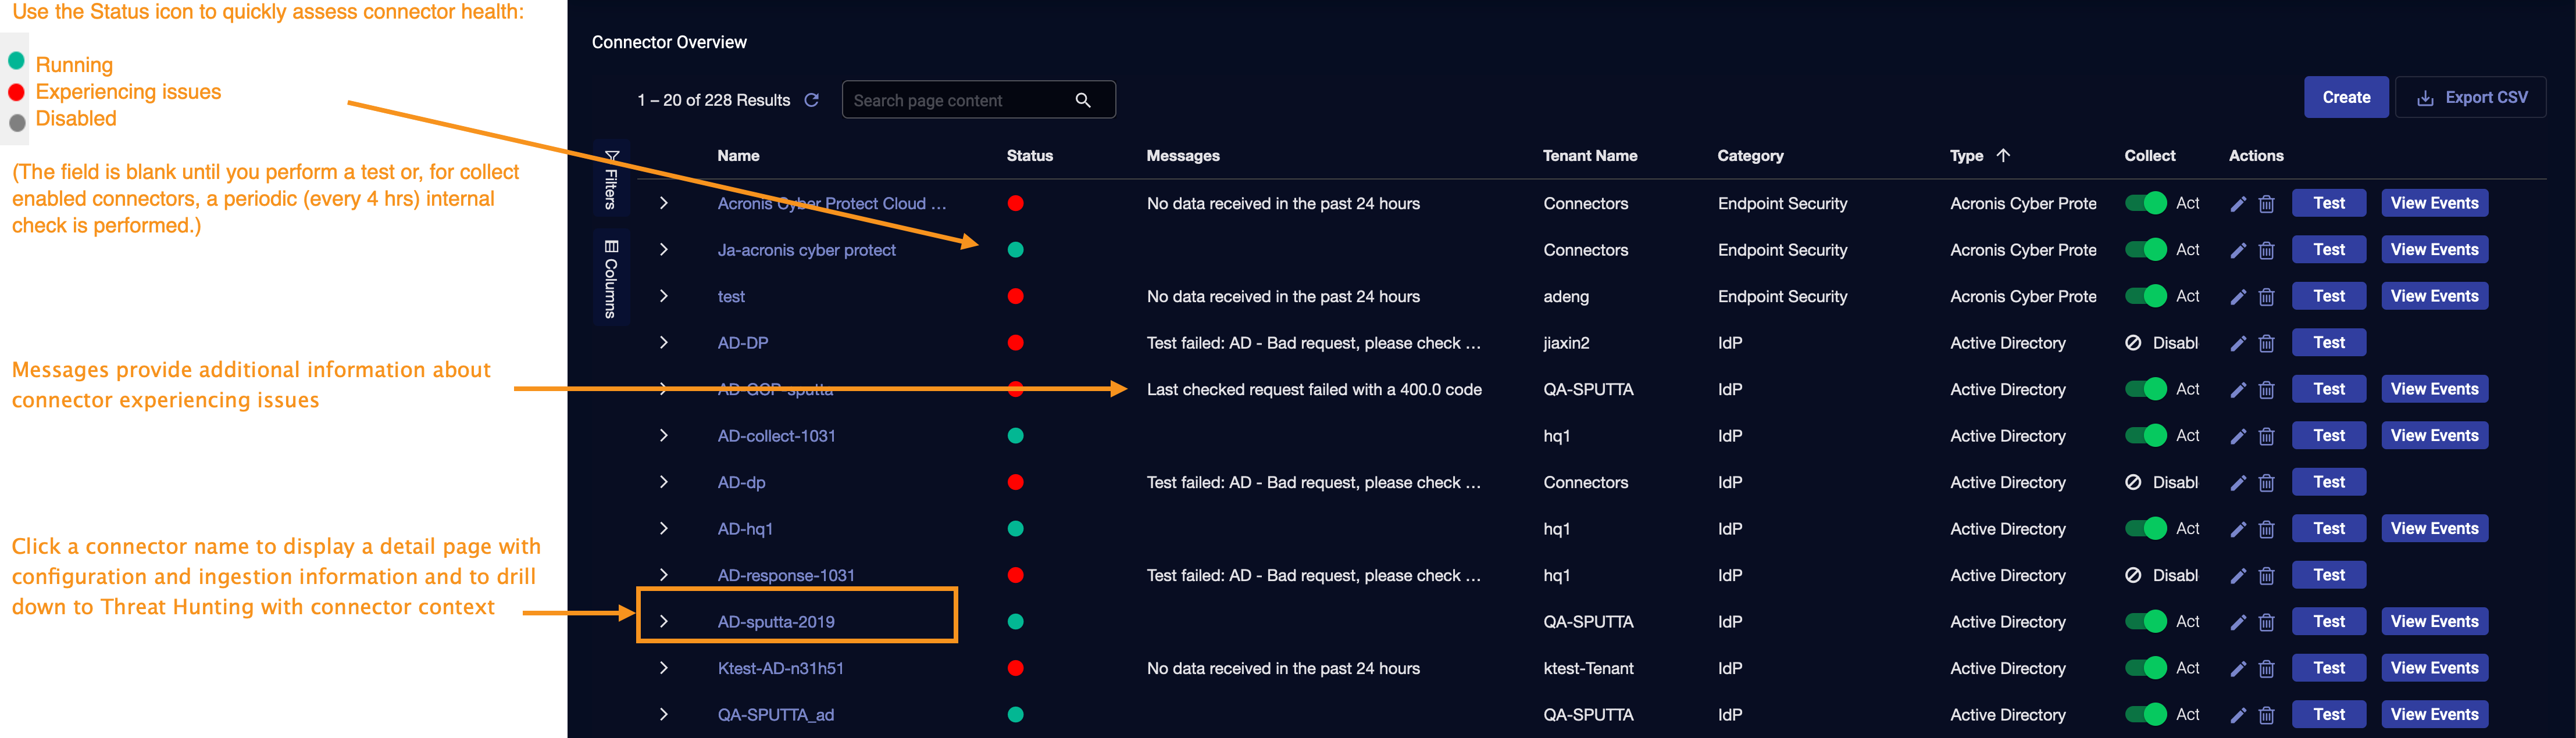
| 401 | Unauthorized |
This error occurs when an authentication credential is invalid or when a user does not have sufficient privileges to access a specific API. |
Did you enter your credentials correctly? Are your credentials expired? Are your credentials entitled or licensed for that specific resource? |
| 403 | Forbidden | This error occurs when the permission or scope is not correct in a valid credential. |
Did you enter your credentials correctly? Do you have the required role or permissions for that credential? |
| 404 | Not Found | This error occurs when a URL path does not resolve to an entity. | Did you enter your API URL correctly? |
| 429 | Too Many Requests |
This error occurs when the API server receives too much traffic or if a user’s license or entitlement quota is exceeded. |
The server or user license/quota will eventually recover. The connector will periodically retry the query. If this occurs unexpectedly or too often, work with your API provider to investigate the server limits, user licensing, or quotas. |
For a full list of codes, refer to HTTP response status codes.
Verifying Ingestion
To verify ingestion:
- Click Investigate | Threat Hunting. The Interflow Search tab appears.
- Change the Indices to Syslog. The table immediately updates to show ingested Interflow records.
