Overview of New User Interface
This topic covers a feature that is not available for all customers yet. See Early Access Program Features and Topics Under Development.
Stellar Cyber has a new user interface that some customers will be able to access in a 5.5.0 Public Preview release.
This document describes how to switch from the legacy user interface to the new user interface, the menus and icons in the new user interface, and a mapping of the legacy user interface's menus and menu items to the new user interface's menus and menu items.
See the following:
Switching User Interfaces
This section describes how to switch the logged in user from the legacy user interface to the new user interface, switch themes in the new user interface, and switch back to the legacy user interface.
Switching from the Legacy UI to the New UI
You can switch from the legacy user interface to the new user interface on a per-user basis. The user interface only changes for that user.
To switch the logged in user from the legacy user interface to the new user interface:
-
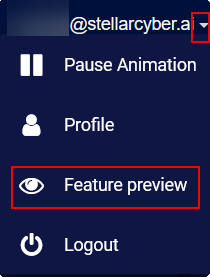
Locate the logged in user. It is to the right of the System menu at the top of the screen.

-
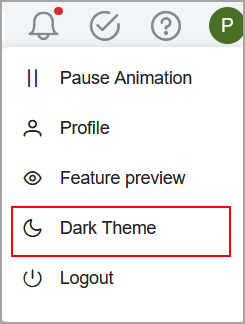
Click the down arrow to view the menu items.
-
Select Feature preview.
-
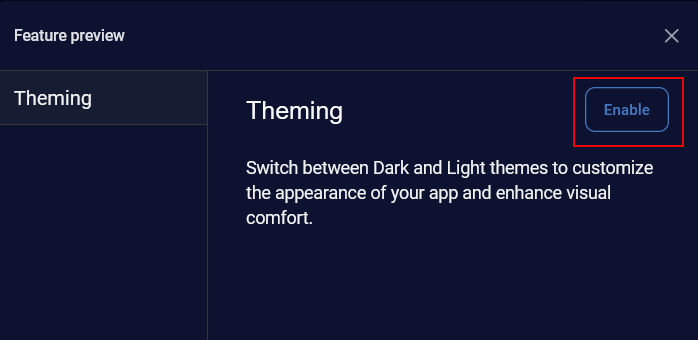
In the Feature preview dialog, click Enable for Theming.
-
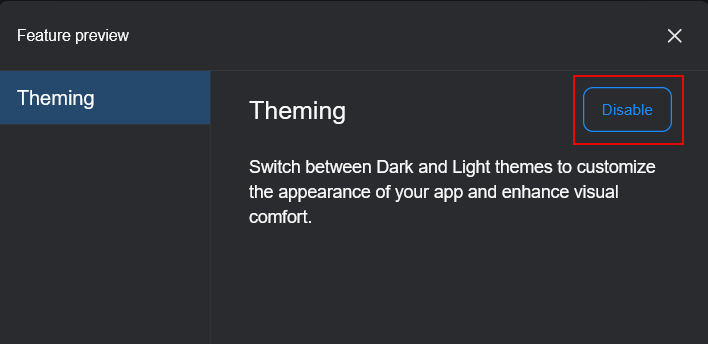
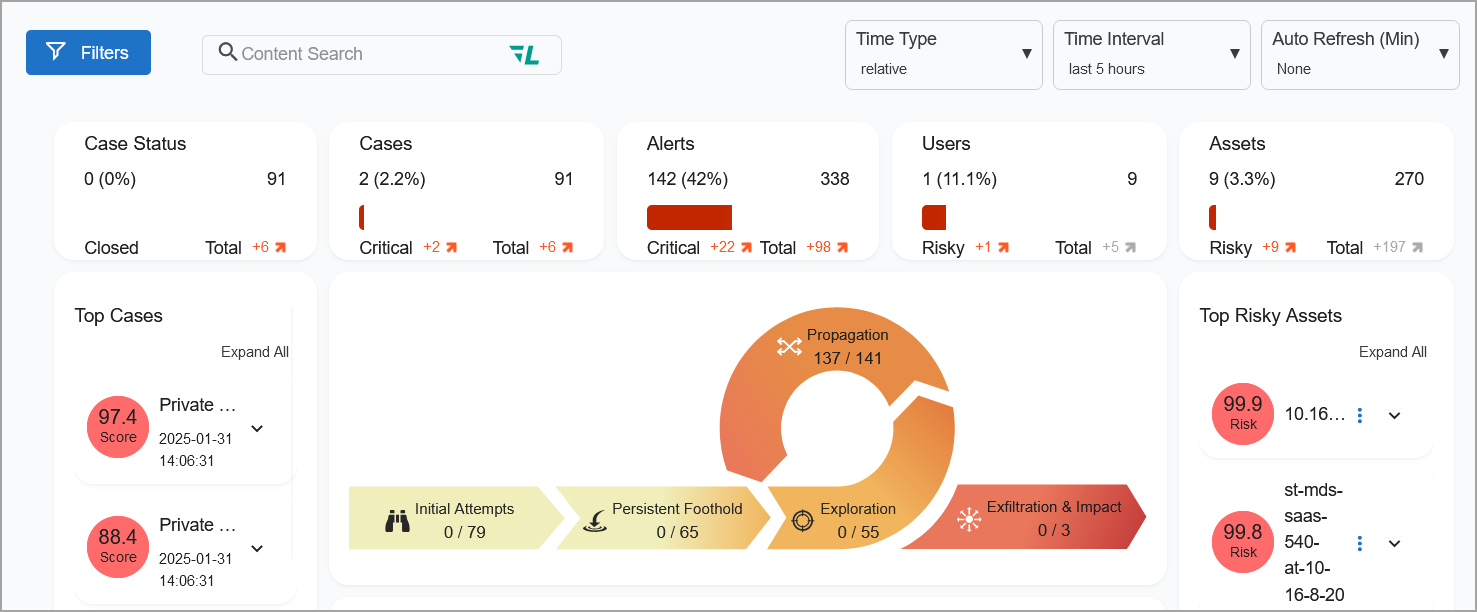
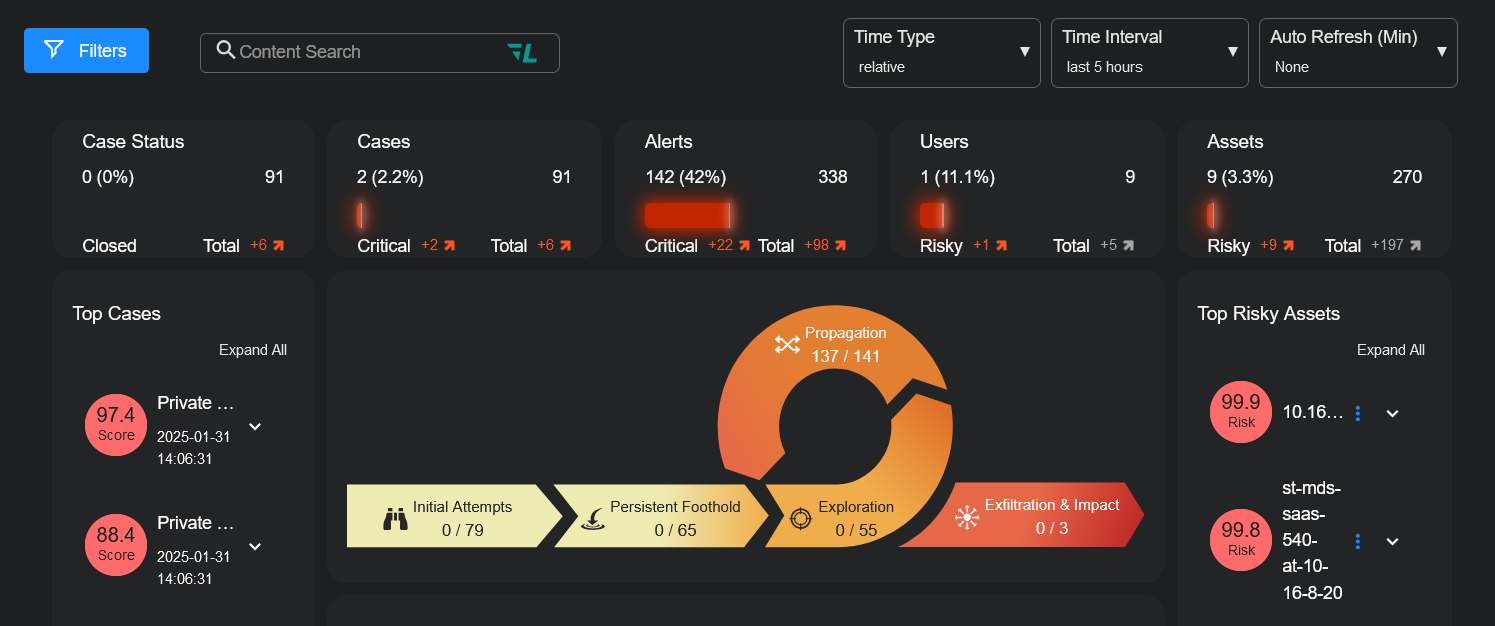
The user interface changes to a Dark theme and Theming changes to Disable.
The default is the Dark theme.
-
Click the X in the top right-hand corner of the dialog to exit the Feature preview dialog and view the new user interface.
Switching Dark and Light Themes
To switch themes from Dark to Light or Light to Dark in the new user interface:
-
Locate the right-most icon in the top right corner of the screen in the new user interface. In this example, it is a
 icon.
icon.
-
Click the right-most icon to view the menu items. In this example, it is a
icon. -
If you are in Dark Theme, select Light Theme to switch to Light Theme.
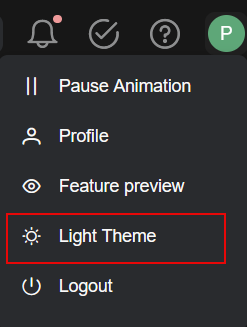
The user interface changes to a light theme.
-
If you are in Light Theme, select Dark Theme to switch to Dark Theme.
The user interface changes to a dark theme.
Switching Back to the Legacy UI
To switch back to the legacy user interface:
-
Select Feature preview from the menu on the right-most icon. In this example, it is a
icon.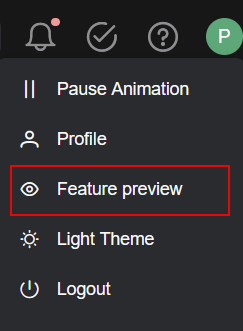
-
For Theming, click Disable.
-
Click the X in the top right-hand corner of the dialog to exit the Feature preview dialog and view the legacy user interface.
Navigating in the New User Interface
The new user interface has icons on the left side of the screen. Click the ![]() icon to expand all the icons into text menus. The menus in the new user interface are described in the sections that follow.
icon to expand all the icons into text menus. The menus in the new user interface are described in the sections that follow.
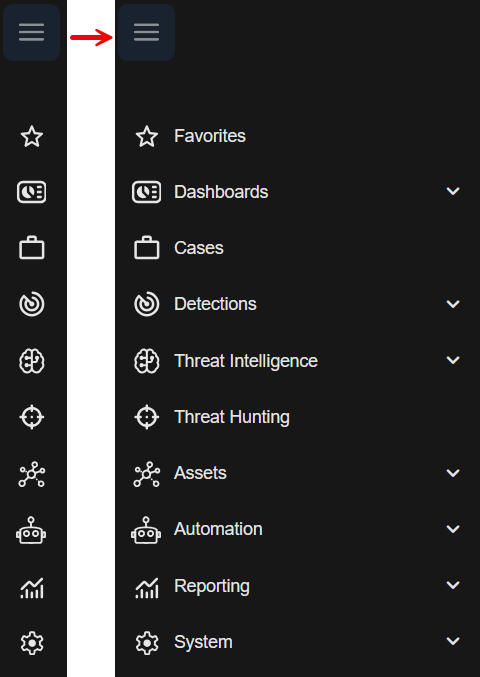
By comparison, the legacy user interface has text menus across the top of the screen, as well as icons on the top right of the screen.

Icons in New UI
The new user interface has icons on the top right of the screen.
![]()
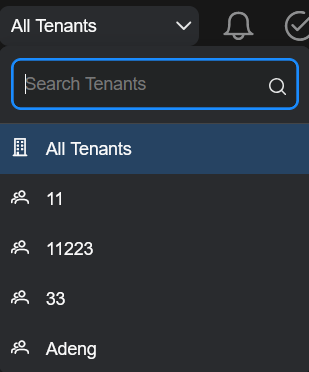
Click All Tenants to view the tenants menu items. There is a Search Tenants box and menu items for the names of tenants.
Use the Search Tenants box to search for tenants by name.
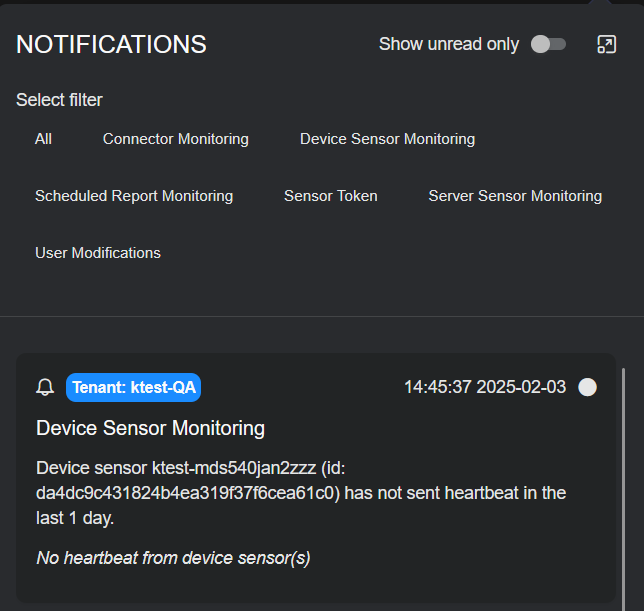
Click the ![]() icon to open Notifications.
icon to open Notifications.
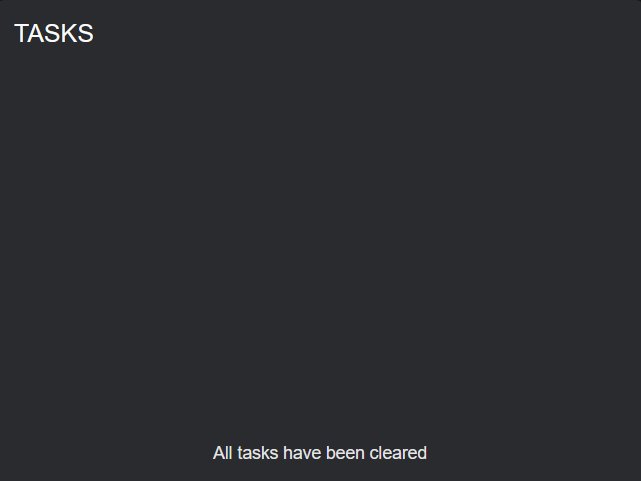
Click the ![]() icon to open Tasks.
icon to open Tasks.
Click the ![]() icon to open the System Status page.
icon to open the System Status page.
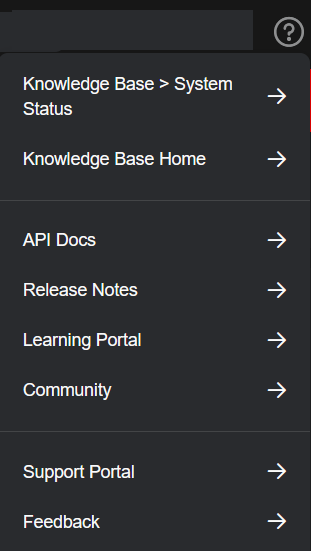
Click the  icon to view the menu items: Knowledge Base <specific article>, Knowledge Base Home, API Docs, Release Notes, Learning Portal, Community, Support Portal, and Feedback.
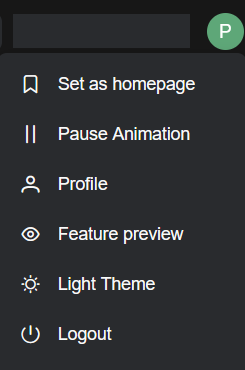
Click the right-most icon to view the menu items: Set as homepage, Pause Animation, Profile, Feature Preview, Light/Dark Theme, and Logout. In this example, it is a ![]() icon.
icon.
Favorites Menu
You can add your favorite menu items to the Favorites or ![]() menu. Navigate to a menu item and click the
menu. Navigate to a menu item and click the ![]() icon.
icon.
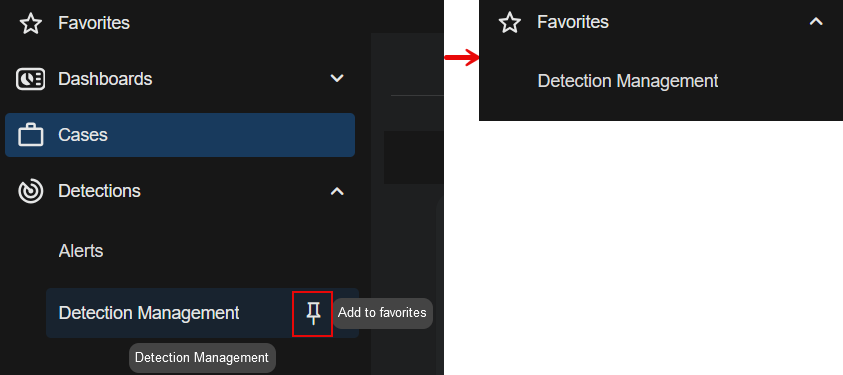
The selected menu item is pinned to Favorites.
Dashboards Menu
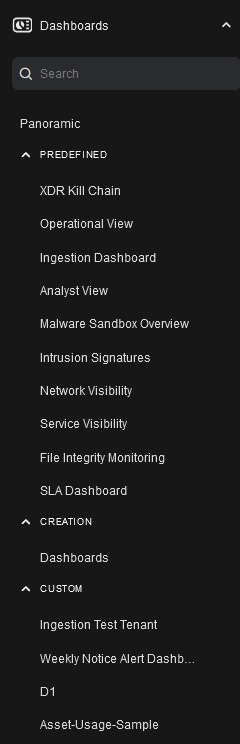
Click the ![]() icon to expand Dashboard to view the menu items in the Dashboards or
icon to expand Dashboard to view the menu items in the Dashboards or ![]() menu. There is a Search box, a menu item for Panoramic, and three sections of menu items: PREDEFINED, CREATION, and CUSTOM.
menu. There is a Search box, a menu item for Panoramic, and three sections of menu items: PREDEFINED, CREATION, and CUSTOM.
The section headings in all caps are not selectable menu items.
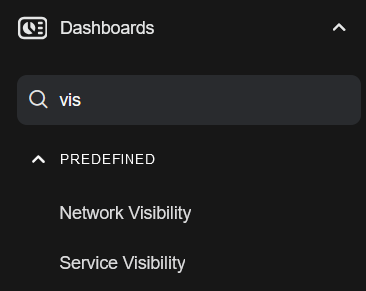
Dashboards Search Box
Use the Dashboards Search box to search for menu items within the Dashboards menu. For example, if you search for vis, the search result is as follows.
Panoramic
Click Panoramic to access Panoramic views.
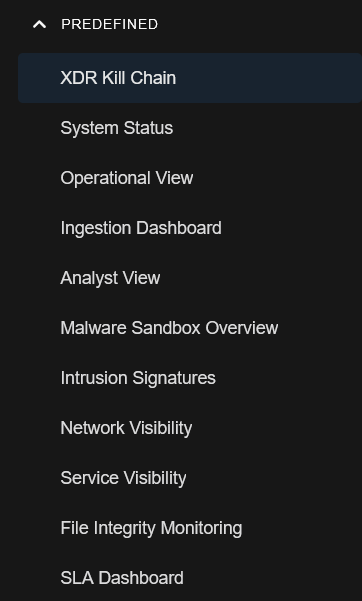
PREDEFINED
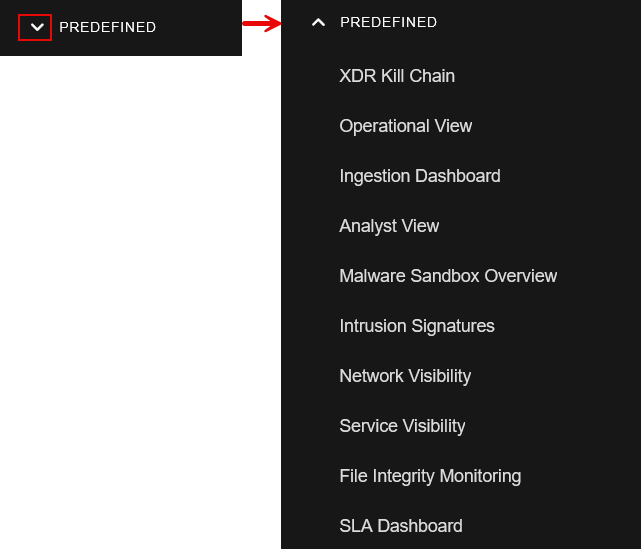
Click the ![]() icon to expand the PREDEFINED section of the Dashboards menu to view the menu items: XDR Kill Chain, System Status, Operational View, Ingestion Dashboard, Analyst View, Malware Sandbox Overview, Intrusion Signatures, Network Visibility, Service Visibility, File Integrity Monitoring, and SLA Dashboard.
icon to expand the PREDEFINED section of the Dashboards menu to view the menu items: XDR Kill Chain, System Status, Operational View, Ingestion Dashboard, Analyst View, Malware Sandbox Overview, Intrusion Signatures, Network Visibility, Service Visibility, File Integrity Monitoring, and SLA Dashboard.
CREATION
Click the ![]() icon to expand the CREATION section of the Dashboards menu to view the menu item: Dashboards.
icon to expand the CREATION section of the Dashboards menu to view the menu item: Dashboards.

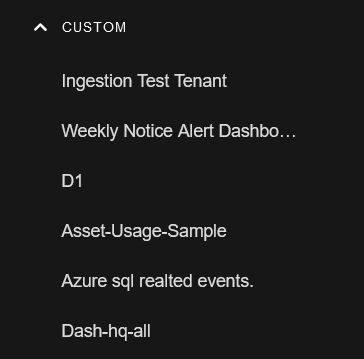
CUSTOM
Click the ![]() icon to expand the CUSTOM section of the Dashboards menu to view the names of custom dashboards, such as the following.
icon to expand the CUSTOM section of the Dashboards menu to view the names of custom dashboards, such as the following.
Cases Menu
Click Cases or ![]() to go to the Cases page. There are no other menu items under the Cases menu.
to go to the Cases page. There are no other menu items under the Cases menu.
Detections Menu
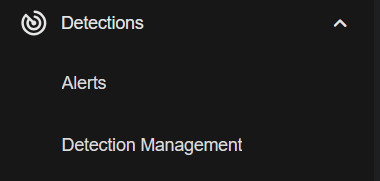
Click the ![]() icon to expand the Detections or
icon to expand the Detections or ![]() menu to view the menu items: Alerts and Detection Management.
menu to view the menu items: Alerts and Detection Management.
Threat Intelligence Menu
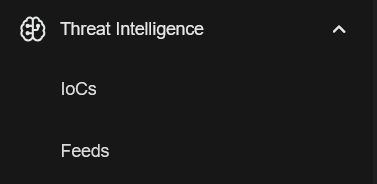
Click the ![]() icon to expand the Threat Intelligence or
icon to expand the Threat Intelligence or ![]() menu to view the menu items: IoCs and Feeds.
menu to view the menu items: IoCs and Feeds.
Threat Hunting Menu
Click Threat Hunting or ![]() to go to the Threat Hunting page. There are no other menu items under the Threat Hunting menu.
to go to the Threat Hunting page. There are no other menu items under the Threat Hunting menu.
Assets Menu
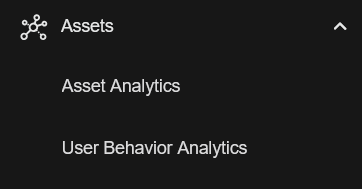
Click the ![]() icon to expand the Assets or
icon to expand the Assets or ![]() menu to view the menu items: Asset Analytics and User Behavior Analytics.
menu to view the menu items: Asset Analytics and User Behavior Analytics.
Automation Menu
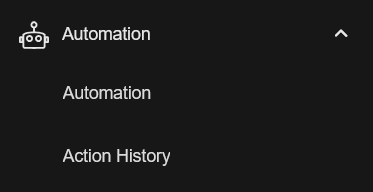
Click the ![]() icon to expand the Automation or
icon to expand the Automation or ![]() menu to view the menu items: Automation and Action History.
menu to view the menu items: Automation and Action History.
Reporting Menu
Click the ![]() icon to expand the Reporting or
icon to expand the Reporting or ![]() menu to view the menu item: Reports.
menu to view the menu item: Reports.

System Menu
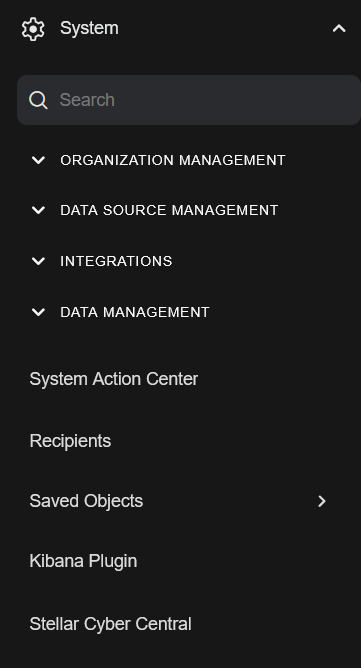
Click the ![]() icon to expand the System or
icon to expand the System or ![]() menu to view the System menu items. There is a Search box and four sections of menu items: ORGANIZATION MANAGEMENT, DATA SOURCE MANAGEMENT, INTEGRATIONS, and DATA MANAGEMENT.
menu to view the System menu items. There is a Search box and four sections of menu items: ORGANIZATION MANAGEMENT, DATA SOURCE MANAGEMENT, INTEGRATIONS, and DATA MANAGEMENT.
The section headings in all caps are not selectable menu items.
In addition, there are a few menu items at the bottom of the System menu: System Action Center, Recipients, Saved Objects, Kibana Plugin, and Stellar Cyber Central.
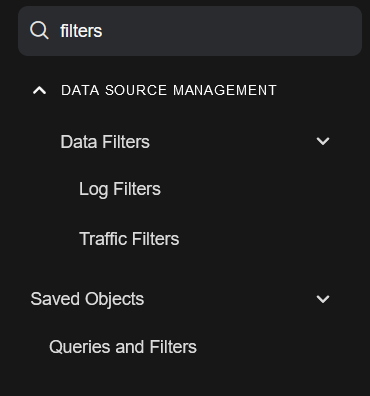
System Search Box
Use the System Search box to search for menu items within the System menu. For example, if you search for filters, the search result is as follows.
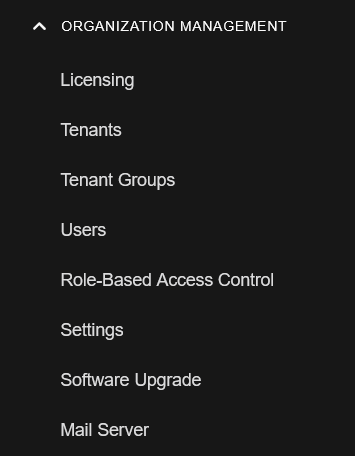
ORGANIZATION MANAGEMENT
Click the ![]() icon to expand the ORGANIZATION MANAGEMENT section of the System menu to view the menu items: Licensing, Tenants, Tenant Groups, Users, Role-Based Access Control, Settings, Software Upgrade, and Mail Server.
icon to expand the ORGANIZATION MANAGEMENT section of the System menu to view the menu items: Licensing, Tenants, Tenant Groups, Users, Role-Based Access Control, Settings, Software Upgrade, and Mail Server.
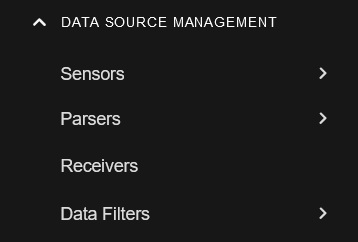
DATA SOURCE MANAGEMENT
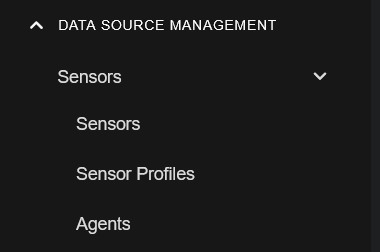
Click the ![]() icon to expand the DATA SOURCE MANAGEMENT section of the System menu to view the menu items: Sensors, Parsers, Receivers, and Data Filters.
icon to expand the DATA SOURCE MANAGEMENT section of the System menu to view the menu items: Sensors, Parsers, Receivers, and Data Filters.
Click the ![]() icon to expand Sensors to view the menu items: Sensors, Sensor Profiles, and Agents.
icon to expand Sensors to view the menu items: Sensors, Sensor Profiles, and Agents.
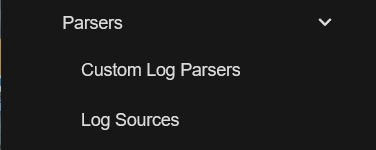
Click the ![]() icon to expand Parsers to view the menu items: Custom Log Parsers and Log Sources.
icon to expand Parsers to view the menu items: Custom Log Parsers and Log Sources.
There are no other menu items under Receivers.
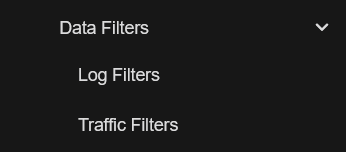
Click the ![]() icon to expand Data Filters to view the menu items: Log Filters and Traffic Filters.
icon to expand Data Filters to view the menu items: Log Filters and Traffic Filters.
INTEGRATIONS
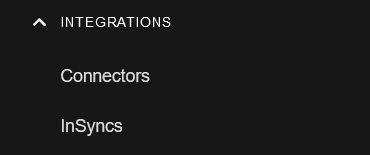
Click the ![]() icon to expand the INTEGRATIONS section of the System menu to view the menu items: Connectors and InSyncs.
icon to expand the INTEGRATIONS section of the System menu to view the menu items: Connectors and InSyncs.
DATA MANAGEMENT
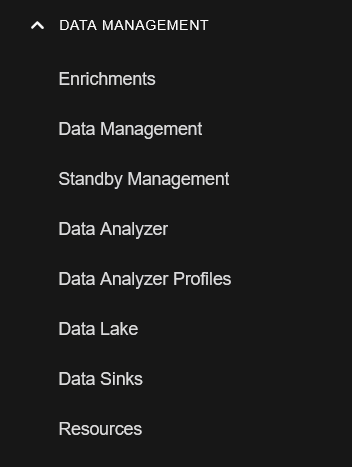
Click the ![]() icon to expand the DATA MANAGEMENT section of the System menu to view the menu items: Enrichments, Data Management, Standby Management, Data Analyzer, Data Analyzer Profiles, Data Lake, Data Sinks, and Resources.
icon to expand the DATA MANAGEMENT section of the System menu to view the menu items: Enrichments, Data Management, Standby Management, Data Analyzer, Data Analyzer Profiles, Data Lake, Data Sinks, and Resources.
Additional System Menu Items
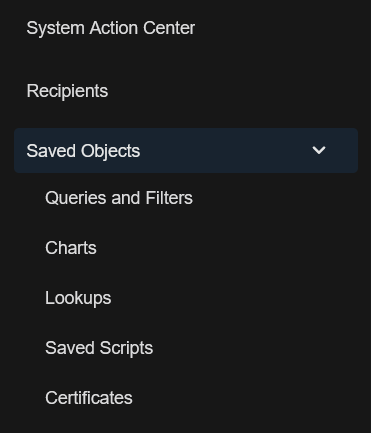
There are a few additional menu items at the bottom of the System menu: System Action Center, Recipients, and Saved Objects.
Click the ![]() icon to expand Saved Objects to view the menu items: Queries and Filters, Charts, Lookups, Saved Scripts, and Certificates.
icon to expand Saved Objects to view the menu items: Queries and Filters, Charts, Lookups, Saved Scripts, and Certificates.
AI Investigator Menu
Click AI Investigator or ![]() to go to the AI Investigator page. There are no other menu items under AI Investigator.
to go to the AI Investigator page. There are no other menu items under AI Investigator.
Mapping the Legacy UI Menu Items to the New UI
The table below maps the menus and menu items in the legacy user interface to the menus and menu items in the new user interface.
In the legacy user interface, a section heading, such as Predefined under the Visualize menu, was not a selectable part of the path. In the new user interface, a section heading, such as PREDEFINED under the Dashboards menu, is also not a selectable part of the path, however, you may need to click the expand icon ![]() to see the menu items under the section heading.
to see the menu items under the section heading.
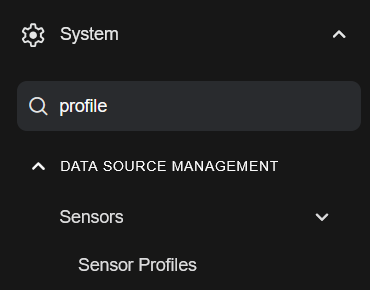
In some cases, you may need to expand multiple items. For example, to select the Sensor Profiles menu item under the System menu, expand System, expand DATA SOURCE MANAGEMENT, and expand Sensors. You can then select Sensor Profiles.
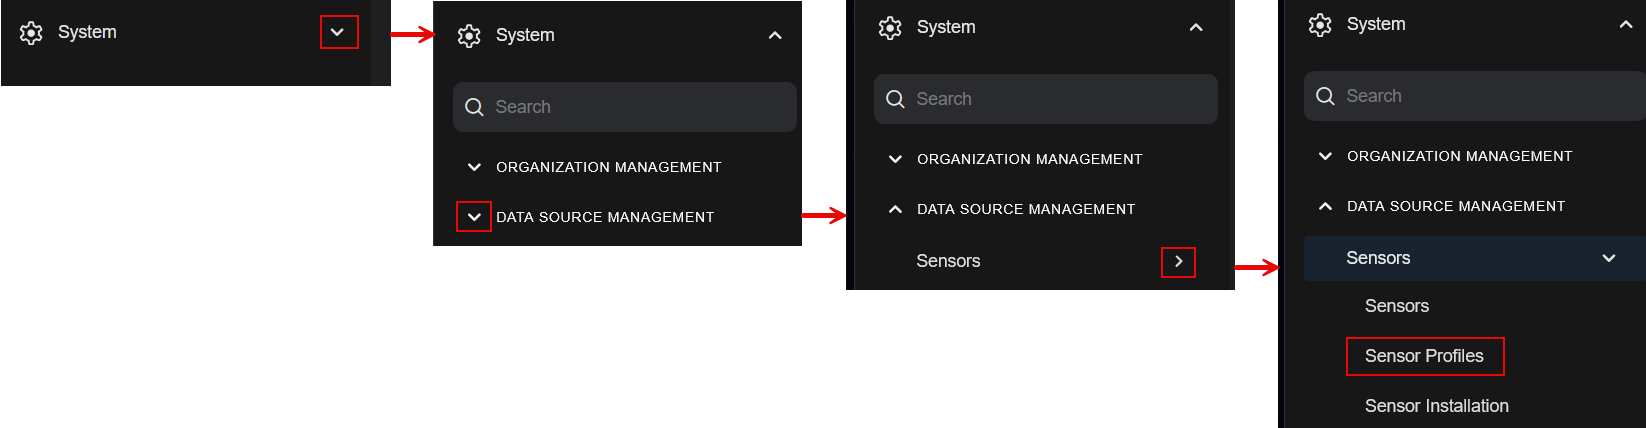
Alternatively, you can use the Search boxes under Dashboards or System to locate a menu item. For example, to find the Sensor Profiles menu item, type profile in the System Search box.
Mapping Table
|
Legacy User Interface |
Section Heading |
New User Interface |
Section Heading |
|---|---|---|---|
| AI Investigator |
|
AI Investigator | |
| Cases |
|
Cases | |
| Alerts |
|
Detections | Alerts | |
| Visualize | XDR Kill Chain |
Predefined |
Dashboards | XDR Kill Chain | PREDEFINED |
|
Visualize | System Status |
Predefined |
Dashboards | System Status |
PREDEFINED |
| Visualize | Operational View |
Predefined |
Dashboards | Operational View | PREDEFINED |
|
Visualize | Ingestion Dashboard |
Predefined |
Dashboards | Ingestion Dashboard |
PREDEFINED |
|
Visualize | Analyst View |
Predefined |
Dashboards | Analyst View |
PREDEFINED |
|
Visualize | Malware Sandbox Overview |
Predefined |
Dashboards | Malware Sandbox Overview |
PREDEFINED |
|
Visualize | Intrusion Signatures |
Predefined |
Dashboards | Intrusion Signatures |
PREDEFINED |
| Visualize | Network Visibility |
Predefined |
Dashboards | Network Visibility | PREDEFINED |
|
Visualize | Service Visibility |
Predefined |
Dashboards | Service Visibility |
PREDEFINED |
|
Visualize | File Integrity Monitoring |
Predefined |
Dashboards | File Integrity Monitoring |
PREDEFINED |
|
Visualize | SLA Dashboard |
Predefined |
Dashboards | SLA Dashboard |
PREDEFINED |
| Visualize | Dashboards |
Creation |
Dashboards | Dashboards | CREATION |
|
Visualize | Charts |
Creation |
System | Charts |
Saved Objects |
| Visualize | <name> |
Custom |
Dashboards | <name> |
CUSTOM |
|
Investigate | Threat Hunting |
|
Threat Hunting |
|
|
Investigate | Asset Analytics |
|
Assets | Asset Analytics |
|
|
Investigate | User Behavior Analytics |
|
Assets| User Behavior Analytics |
|
|
Investigate | Panoramic |
|
Dashboards | Panoramic |
|
|
Investigate | Kibana Plugin |
|
System | Kibana Plugin |
|
|
Respond | Automation |
|
Automation | Automation |
|
|
Respond | Actions |
|
Automation | Action History |
|
|
Respond | Reports |
|
Reporting | Reports |
|
|
System | Sensors |
Collection |
System | Sensors |
DATA SOURCE MANAGEMENT > Sensors |
|
System | Sensor Profiles |
Collection |
System | Sensor Profiles |
DATA SOURCE MANAGEMENT > Sensors |
|
System | Receivers |
Collection |
System | Receivers |
DATA SOURCE MANAGEMENT |
|
System | Custom Log Parsers |
Collection |
System | Custom Log Parsers |
DATA SOURCE MANAGEMENT > Parsers |
|
System | Log Filters |
Collection |
System | Log Filters |
DATA SOURCE MANAGEMENT > Data Filters |
|
System | Traffic Filters |
Collection |
System | Traffic Filters |
DATA SOURCE MANAGEMENT > Data Filters |
|
System | Log Sources |
Collection |
System | Log Sources |
DATA SOURCE MANAGEMENT > Parsers |
|
System | Connectors |
Integrations |
System | Connectors |
INTEGRATIONS |
|
System | Threat Intelligence Platform |
Integrations |
Threat Intelligence | IoCs Threat Intelligence | Feeds |
|
|
System | InSyncs |
Integrations |
System | InSyncs |
INTEGRATIONS |
|
System | Enrichments |
Data Processor |
System | Enrichments |
DATA MANAGEMENT |
|
System | Data Management |
Data Processor |
System | Data Management |
DATA MANAGEMENT |
|
System | Standby Management |
Data Processor |
System | Standby Management |
DATA MANAGEMENT |
|
System | Data Analyzer |
Data Processor |
System | Data Analyzer |
DATA MANAGEMENT |
|
System | Data Analyzer Profiles |
Data Processor |
System | Data Analyzer Profiles |
DATA MANAGEMENT |
|
System | Data Lake |
Data Processor |
System | Data Lake |
DATA MANAGEMENT |
|
System | Data Sinks |
Data Processor |
System | Data Sinks |
DATA MANAGEMENT |
|
System | Resources |
Data Processor |
System | Resources |
DATA MANAGEMENT |
|
System | Detection Management |
Detections |
Detections | Detection Management |
|
|
System | Queries and Filters |
Configurations |
System | Queries and Filters |
Saved Objects |
|
System | Recipients |
Configurations |
System | Recipients |
|
|
System | Saved Scripts |
Configurations |
System | Saved Scripts |
Saved Objects |
|
System | Lookups |
Configurations |
System | Lookups |
Saved Objects |
|
System | Stellar Cyber Central |
Deployment |
System | Stellar Cyber Central |
|
|
System | Agents |
Deployment |
System | Agents |
DATA SOURCE MANAGEMENT > Sensors |
|
System | Licensing |
Administration |
System | Licensing |
ORGANIZATION MANAGEMENT |
|
System | Software Upgrade |
Administration |
System | Software Upgrade |
ORGANIZATION MANAGEMENT |
|
System | Role-Based Access Control |
Administration |
System | Role-Based Access Control |
ORGANIZATION MANAGEMENT |
|
System | Users |
Administration |
System | Users |
ORGANIZATION MANAGEMENT |
|
System | Tenants |
Administration |
System | Tenants |
ORGANIZATION MANAGEMENT |
|
System | Tenant Groups |
Administration |
System | Tenant Groups |
ORGANIZATION MANAGEMENT |
|
System | Settings |
Administration |
System | Settings |
ORGANIZATION MANAGEMENT |
|
System | Mail Server |
Administration |
System | Mail Server |
ORGANIZATION MANAGEMENT |
|
System | Certificates |
Administration |
System | Certificates |
Saved Objects |
|
System | System Action Center |
Administration |
System | System Action Center |
|
