ATH Example: Log Source Inactivity
Create an Automated Threat Hunting (ATH) playbook that detects when any of the log sources that send data to a Modular Sensor stop doing so. This behavior might indicate a network issue, device outage, log pipeline failure, or misconfiguration. The playbook queries the Sensor Monitoring index for modular sensor heartbeat messages (msgtype:31) that show when zero records were sent from one or more sources. By identifying periods of inactivity, the playbook helps you respond quickly to potential coverage loss or sensor-side issues across your environment.
Configure the Alert
Configure an alert that runs at regular intervals to check whether any log source has stopped sending logs to a Modular Sensor. This example uses a 20-minute interval and analyzes data from the Sensor Monitoring index. The playbook filters for Modular Sensor messages with msgtype:31 and zero records (in_records_delta:0), which indicates that the sensor did not receive any logs from one or more log sources during that period.
-
Navigate to Automation | Automation and select the Create button to add a playbook.
-
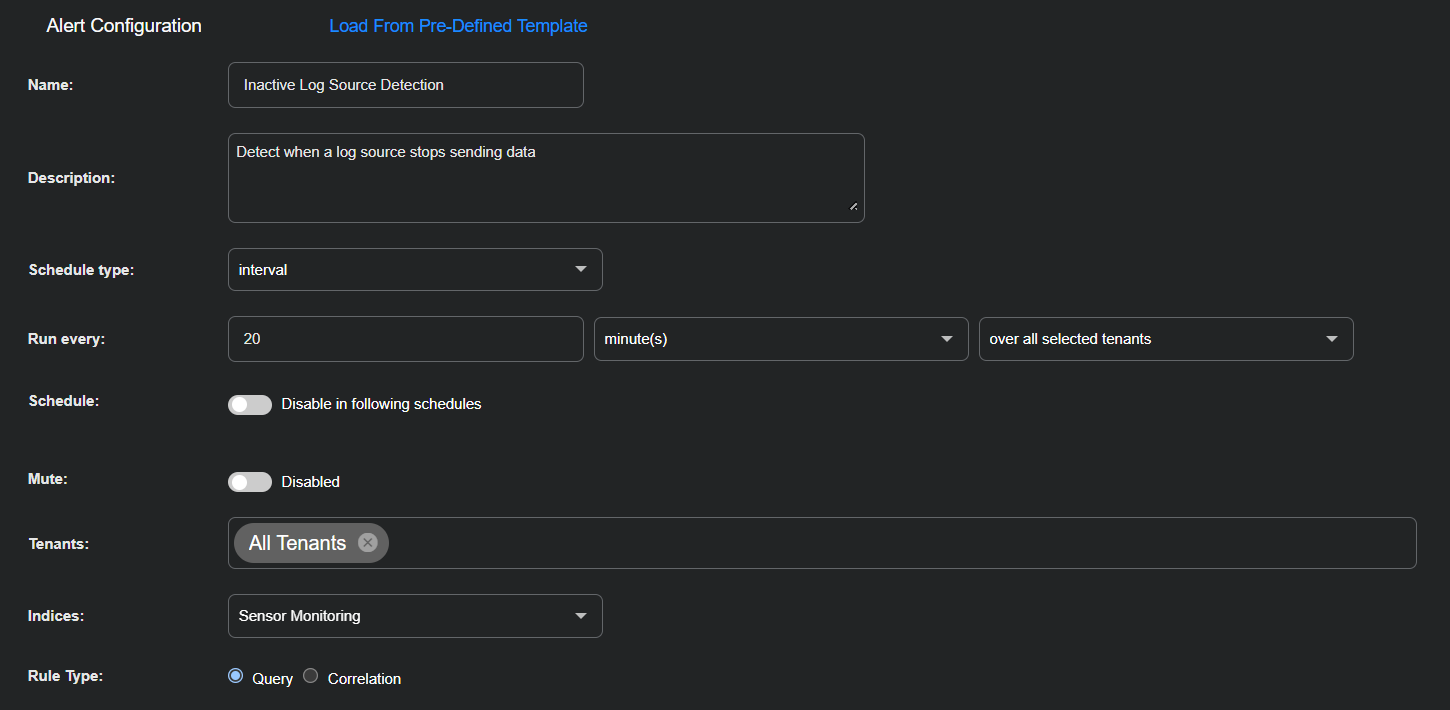
Enter the following in the Alert Configuration section:
Name: Inactive Log Source Detection
Description: Detect when a log source stops sending data
Schedule type: interval
Run every: 20 minute(s) over all selected tenants
Schedule: Toggle off (default setting)
Mute: Toggle off (default setting)
Tenants: All Tenants
Indices: Sensor Monitoring
Rule Type: Query
Build a Query
Build a query that identifies log source inactivity by filtering for Modular Sensor heartbeat messages (msgtype:31) that report no records received from any log source. These messages are generated once per minute, and a value of zero in in_records_delta indicates that the sensor did not receive any logs from one of these systems during that minute.
-
Select New Query.
-
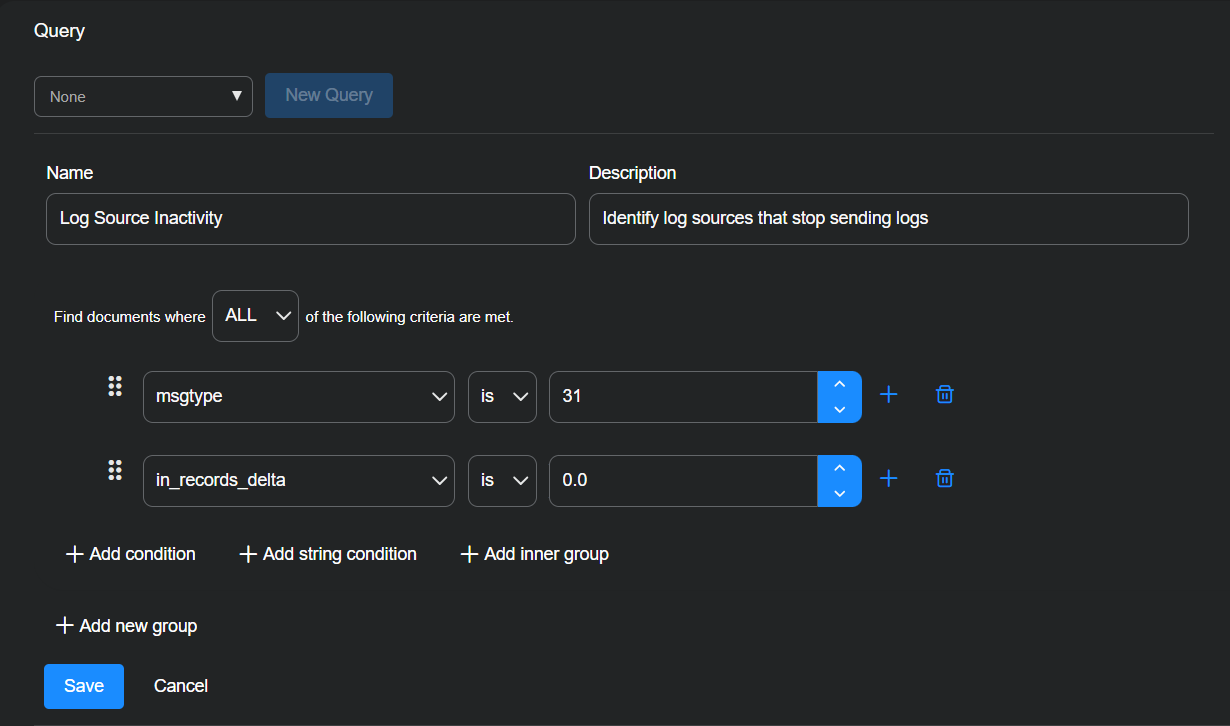
Enter the following and then select Save:
Query Name: Log Source Inactivity
Description: Identify log sources that stop sending logs
Find documents where ALL of the following criteria are met.
Select + Add condition and enter msgtype, is, 31.
Select + Add condition and enter in_records_delta, is, 0.
Add Calculations
Add a calculation that identifies which log sources have stopped sending data to a Modular Sensor. To track repeated inactivity, the calculation uses the src_addr field, which represents the IP address of the log source. By calculating the top source addresses with zero reported records, the playbook can later trigger an alert based on persistent gaps in log collection.
-
Toggle Calculations on.
-
Select to add a calculation.
-
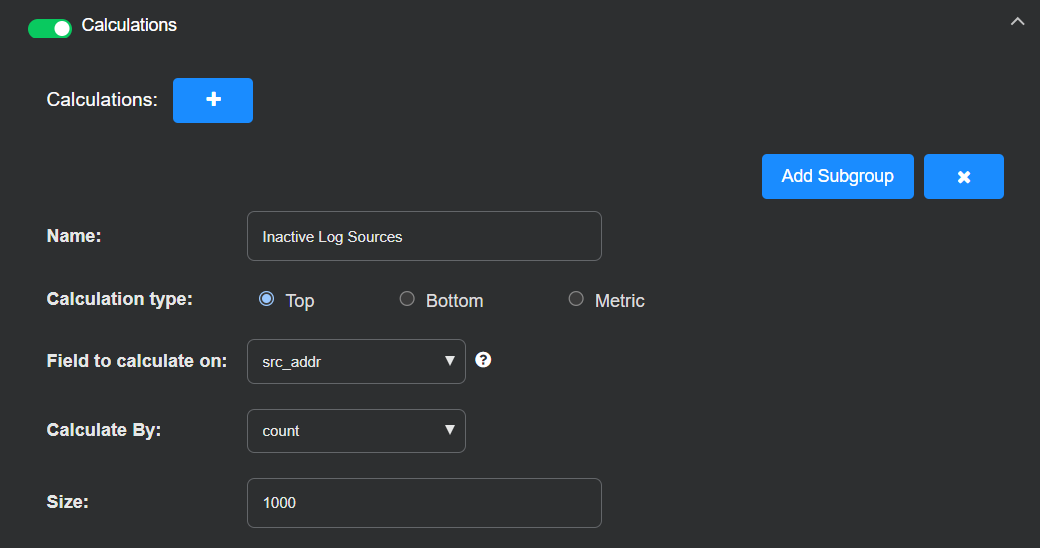
Enter the following:
Name: Inactive Log Sources
Calculation type: Top
Field to calculate on: src_addr
Calculation By: count
Size: 1000
Configure a Condition
Configure a condition that triggers when one or more log sources have stopped sending data to a Modular Sensor for a sustained period. In this example, the playbook runs every 20 minutes and the condition triggers if a log source appears 10 or more times in the calculation results, indicating persistent inactivity.
-
Enter the following in the Condition Configuration section:
Condition Name: Inactive for 10 Minutes
Type: Compare List
Comparison: At least one, Result counts of Inactive Log Sources, is greater than or equal to, 1
Configure Actions
Configure an action that notifies the appropriate recipients when one or more log sources stop sending data to a Modular Sensor. In this example, the playbook sends an email when the condition is met. Use this notification to initiate investigation and restore log visibility where needed.
-
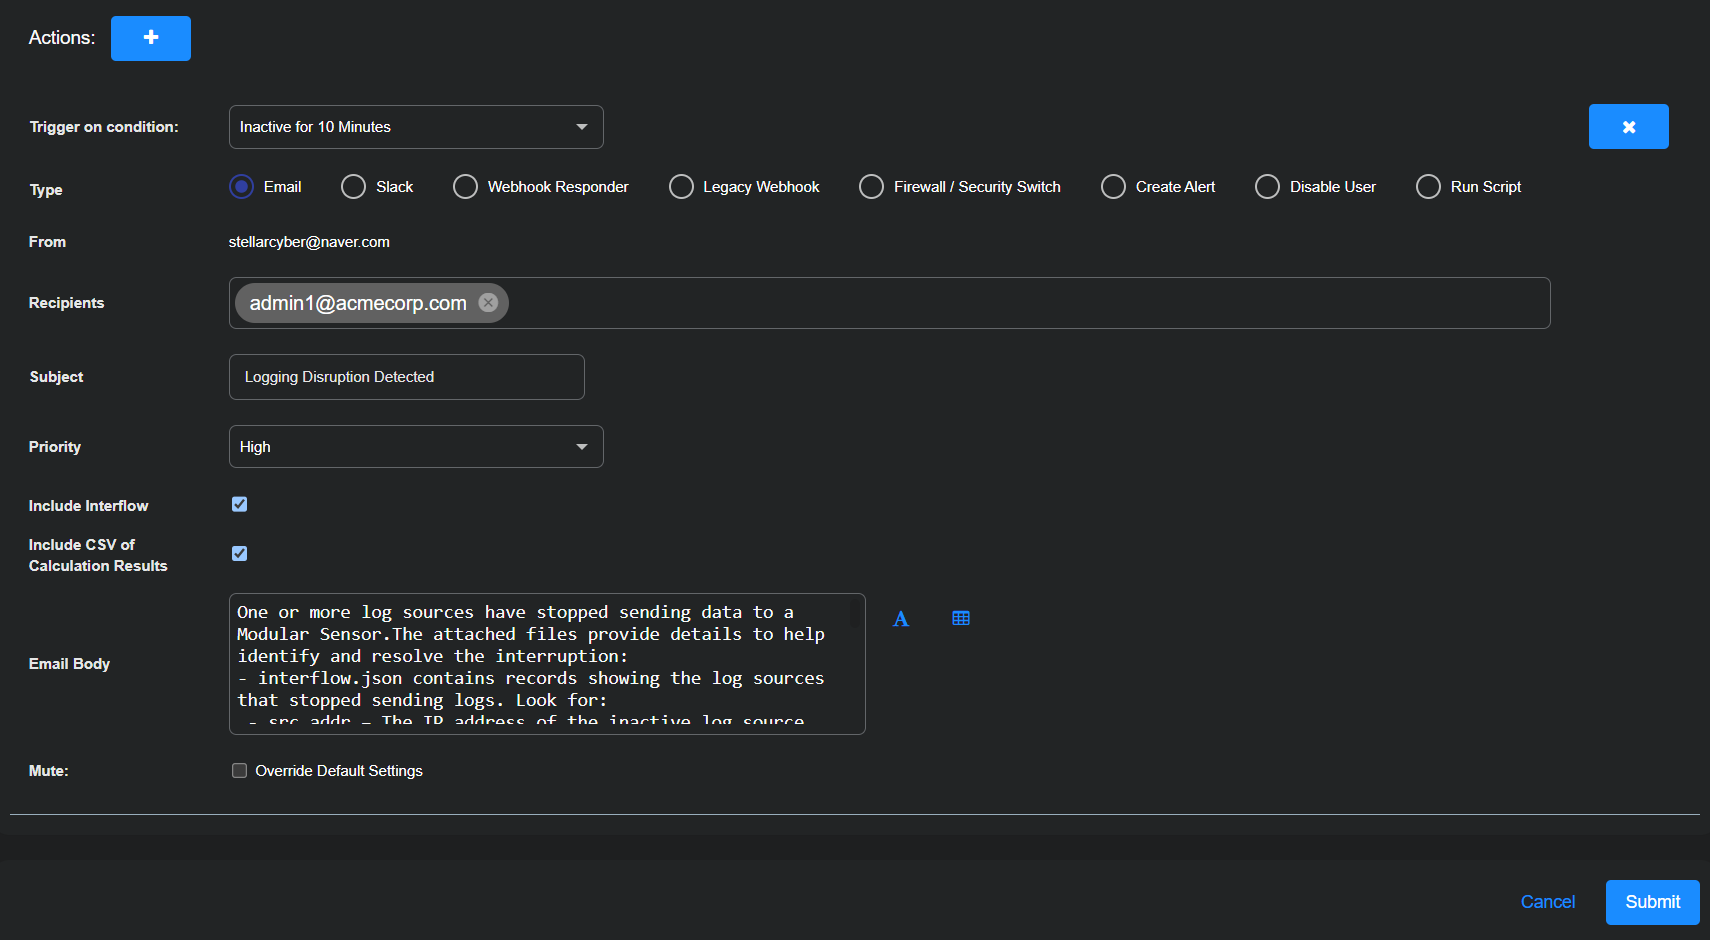
Set Trigger on condition to Inactive for 10 Minutes.
-
Choose Email and enter the following:
Recipients: Either type in an email address to use or choose a previously configured recipient from the drop-down list.
Refer to Adding a Recipient for information on managing recipients globally.
Subject: Logging Disruption Detected
Priority: High
Include Interflow: (select)
Include CSV of Calculation Results: (select)
Email Body: Enter the following:
One or more log sources stopped sending data to a Modular Sensor.
The attached files provide details to help identify and resolve the interruption.
interflow.json contains records showing the log sources that stopped sending logs. Look for:
- src_addr – IP address of the inactive log source
- in_records_delta: 0 – Confirms no logs were received during that interval
- timestamp – Shows when the inactivity occurred, in Unix time (milliseconds)
- in_tag – Identifies the expected log type (such as firewall logs)
- host.ip – IP address of the Modular Sensor that reported the inactivity
Inactive Log Sources.csv lists log sources that were inactive multiple times. Each row includes the following:
- IP address of the inactive log source (src_addr)
- Number of one-minute intervals in which no data was received
Note: To convert a timestamp value into a readable format:
- Use https://www.epochconverter.com/ and paste the value into the “Epoch timestamp in milliseconds” field.
- Or use https://www.unixtimestamp.com/ with the epoch-to-date converter.
Mute: (disable)
Save & Run the Playbook
Select Submit to save and immediately run the playbook.
The new playbook appears in the Automated Threat Hunting Playbooks list.


