Configuring CODA Footprint Connectors
This connector allows Stellar Cyber to ingest logs from CODA Intelligence's CODA Footprint and add the records to the data lake. It integrates with the CODA Footprint API to get scan results and associated vulnerabilities.
Due to a limitation on time window filtering in the CODA API, this connector will produce duplicate data, which may be critical for device vulnerabilities data. Some simple local filtering has been added to this connector, but it is best effort (not guaranteed) and may decrease connector performance.
Stellar Cyber connectors with the Collect function (collectors) may skip collecting some data when the ingestion volume is large, which potentially can lead to data loss. This can happen when the processing capacity of the collector is exceeded.
Connector Overview: CODA Footprint
Capabilities
-
Collect: Yes
-
Respond: No
-
Native Alerts Mapped: No
-
Runs on: DP
-
Interval: 8 hours
Collected Data
|
Content Type |
Index |
Locating Records |
|---|---|---|
|
Alert Device Device Application Device Vulnerability |
Syslog (for Alert and Device Application) Scans (for Device Vulnerability) Assets (for Device) |
Domain
|
<Base URL> where <Base URL> is a variable from the configuration of this connector |
Response Actions
N/A
Third Party Native Alert Integration Details
N/A
Required Credentials and Configurations
-
For API Keys Auth Method: Base URL, and API Key
-
For JWT Auth Method: Base URL, Username, and Password
Adding a CODA Footprint Connector
To add a CODA Footprint connector:
For a limitation on filtering APIs, see Filtering APIs on CODA Footprint Connectors.
Obtaining CODA Footprint Credentials
Before you configure the connector in Stellar Cyber, you must obtain the following CODA Footprint credentials.
For API Keys authentication method:
-
Base URL—The base URL for API access. The default is https://demo.codacloud.net. You can modify the URL, for example to https://footprint.codacloud.net.
-
API Key—The credentials for the API Keys authentication method.
For JWT authentication method:
-
Base URL—The base URL. The default is https://demo.codacloud.net. You can modify the URL, for example to https://footprint.codacloud.net.
-
Username and Password—The credentials for the JWT authentication method.
Obtaining API Key
Follow the guidance in the API Keys section in the CODA Intelligence documentation.
Obtaining Username and Password
Follow the guidance in the JSON Web Tokens section in the CODA Intelligence documentation.
Adding the Connector in Stellar Cyber
To add a CODA Footprint connector in Stellar Cyber:
-
Log in to Stellar Cyber.
-
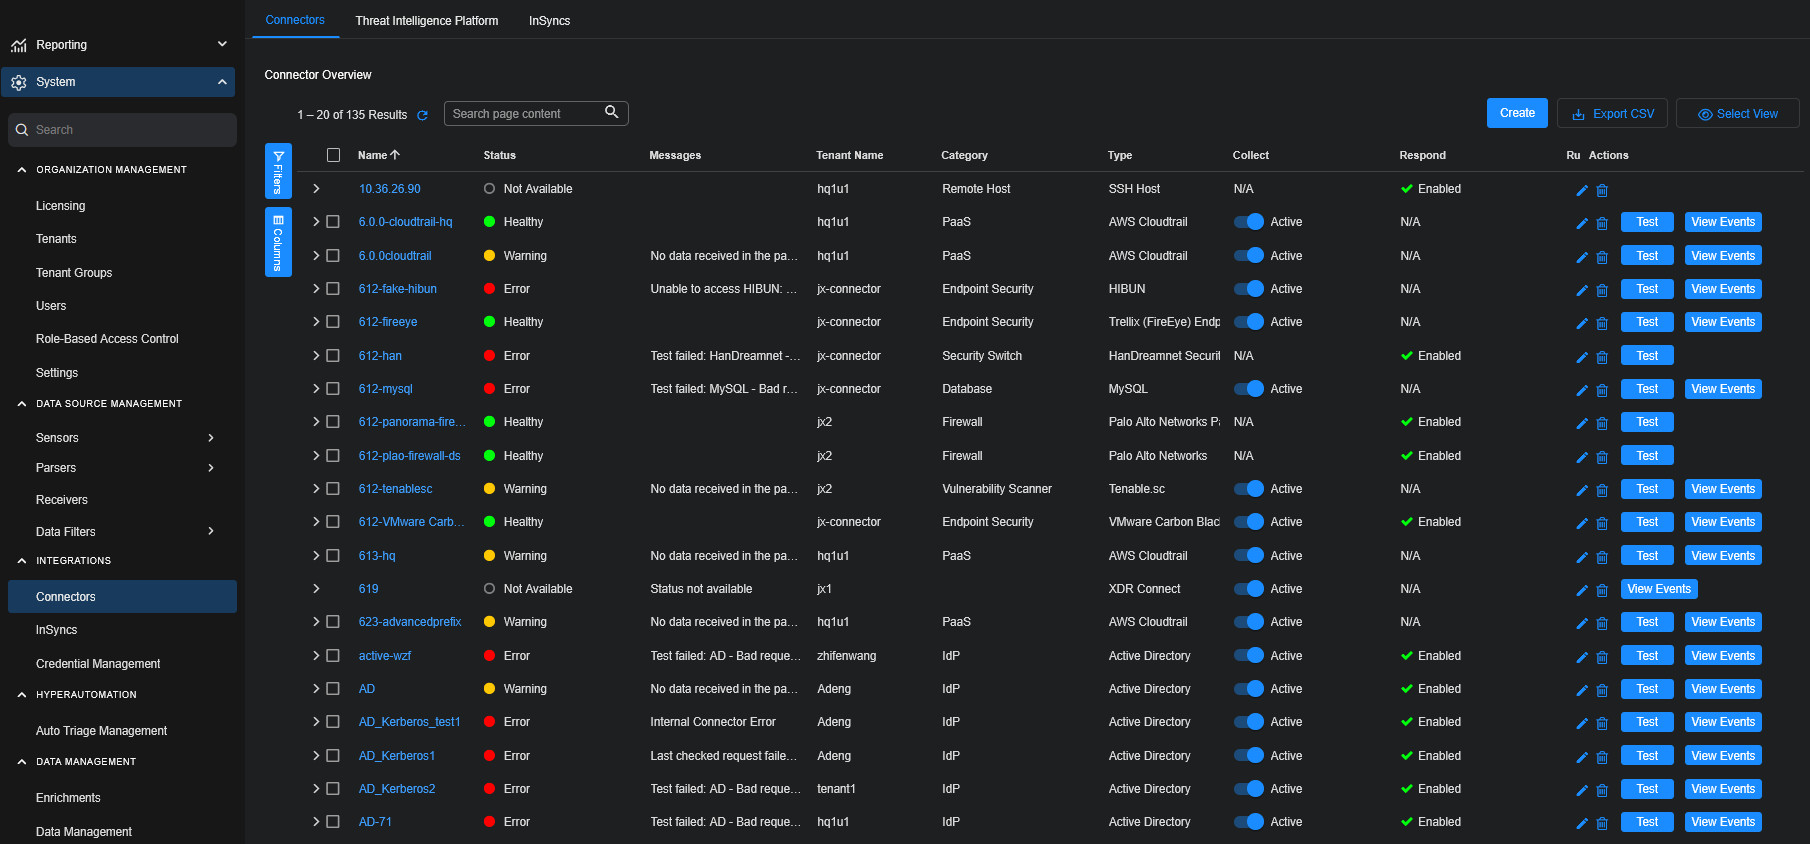
Click System | INTEGRATIONS | Connectors. The Connector Overview appears.
-
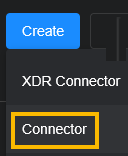
Click Create and select Connector.
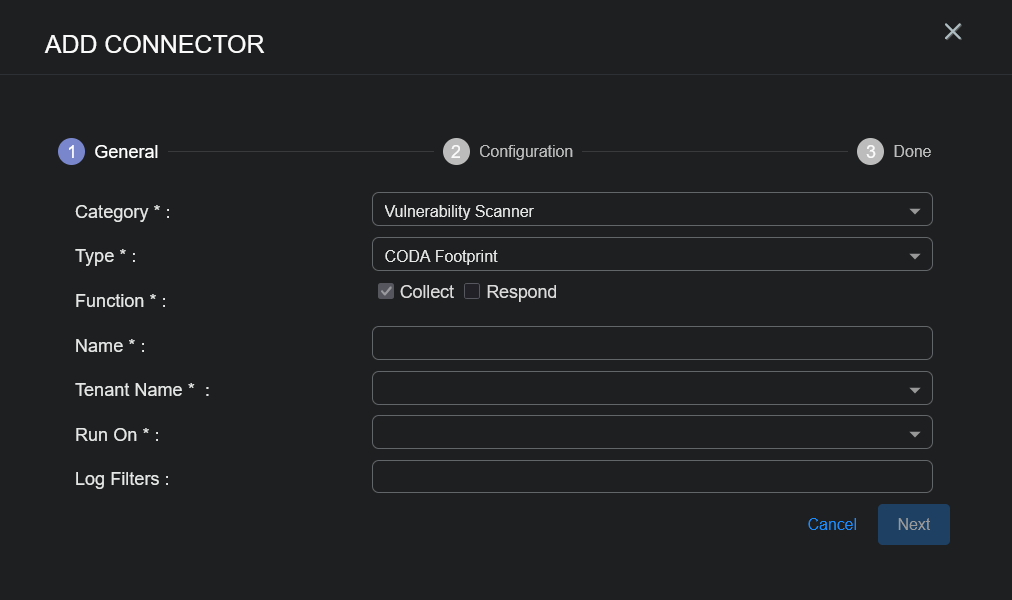
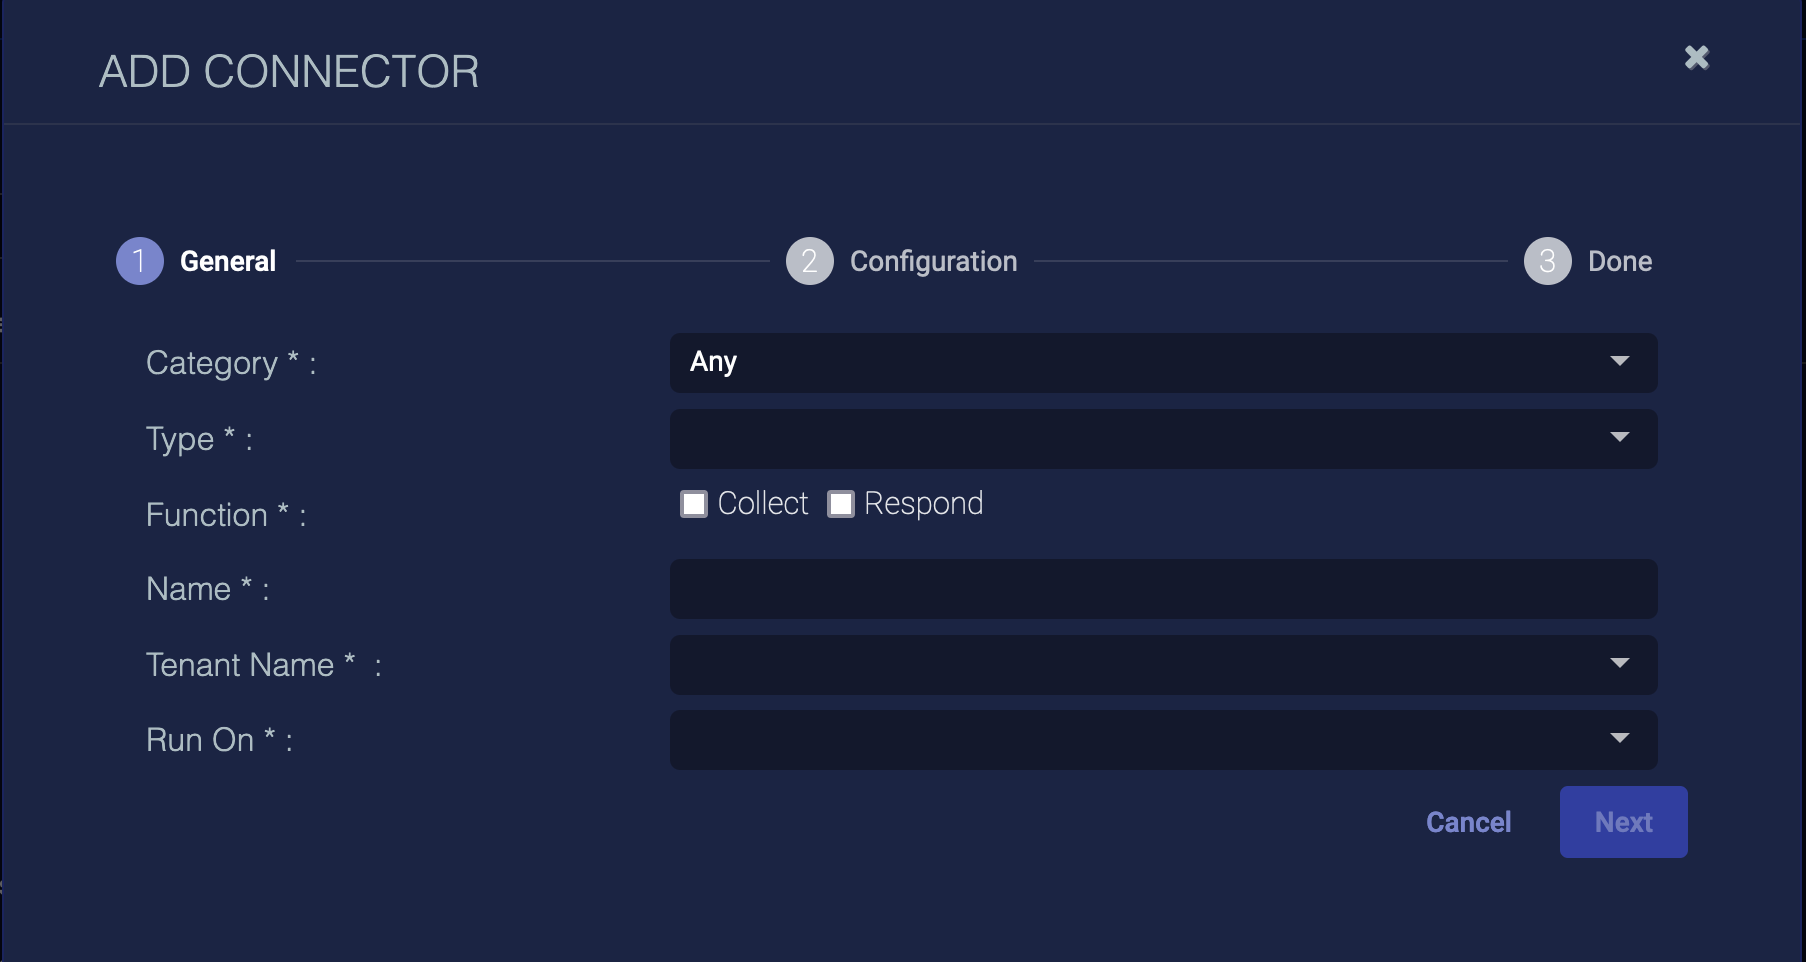
The General tab of the Add Connector screen appears. The information on this tab cannot be changed after you add the connector.
-
Choose Vulnerability Scanner from the Category dropdown.
-
Choose CODA Footprint from the Type dropdown.
The asterisk (*) indicates a required field.
-
For this connector, the supported Function is Collect, which is enabled already.
-
Enter a Name.
Notes:- This field does not accept multibyte characters.
- It is recommended that you follow a naming convention such as tenantname-connectortype.
-
Choose a Tenant Name. The Interflow records created by this connector include this tenant name.
-
Choose the device on which to run the connector.
-
Certain connectors can be run on either a Sensor or a Data Processor. The available devices are displayed in the Run On menu. If you want to associate your collector with a sensor, you must have configured that sensor prior to configuring the connector or you will not be able to select it during initial configuration.
-
If the device you're connecting to is on premises, we recommend you run on the local sensor. If you're connecting to a cloud service, we recommend you run on the DP.
-
-
(Optional) When the Function is Collect, you can apply Log Filters. For information, see Managing Log Filters.
-
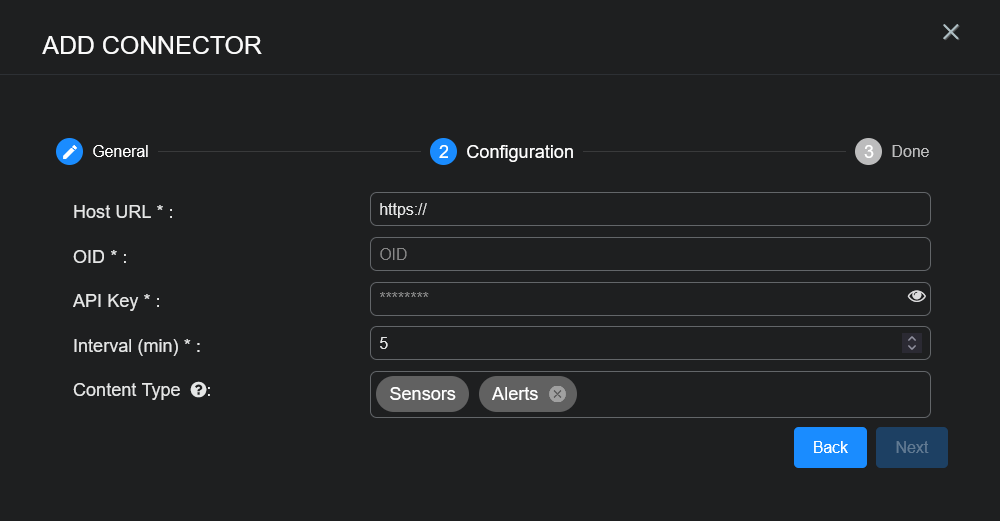
Click Next. The Configuration tab appears.
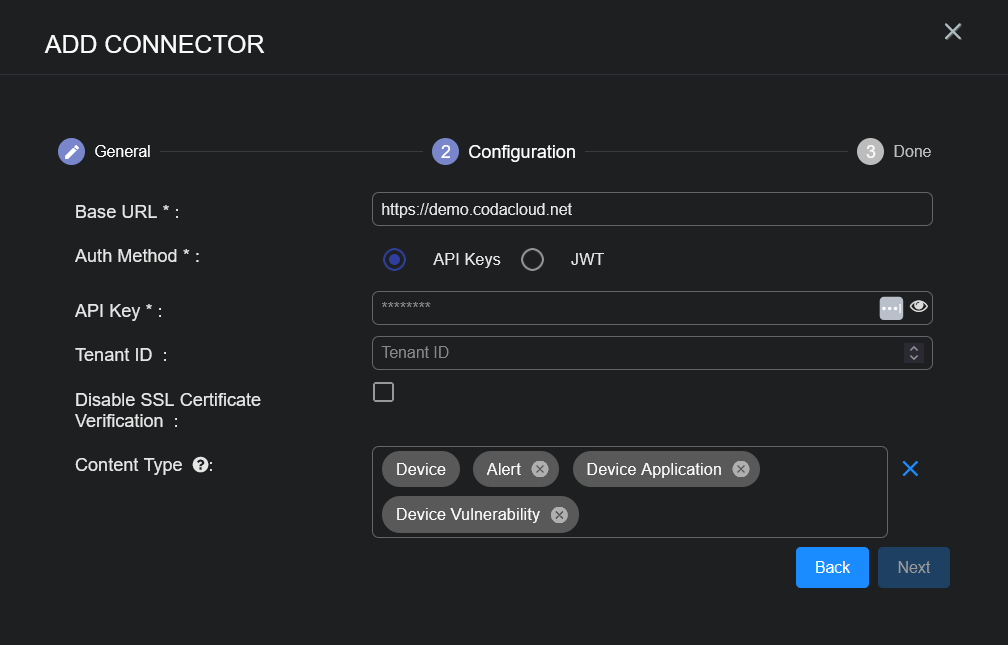
The asterisk (*) indicates a required field.
-
Choose the Auth Method to use API Keys or JWT.
For API Keys Auth Method:
-
Enter the API Key you noted above in Obtaining CODA Footprint Credentials.
-
(Optional) Enter the Tenant ID. Use this field if you want to get data from a specific CODA tenant.
For JWT Auth Method:
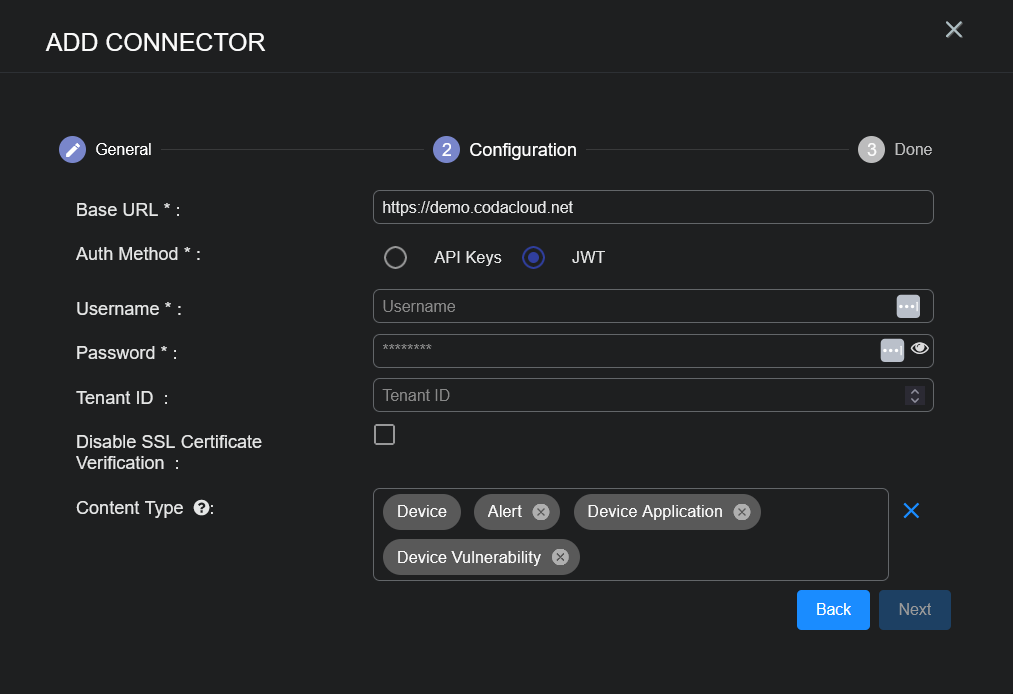
The asterisk (*) indicates a required field.
-
Enter the Username and Password you noted above in Obtaining CODA Footprint Credentials.
-
(Optional) Enter the Tenant ID. Use this field if you want to get data from a specific CODA tenant.
-
-
(Optional) Click Disable SSL Certificate Verification if you want to disable SSL certificate verification. Only disable SSL certificates if you have a reason to, otherwise, it is not a good security practice.
-
Choose the Content Type you would like to collect. The logs for Device, Alert, Device Application, and Device Vulnerability are supported.
The Device content type is always selected and cannot be removed from the configuration as it is required for host information.
-
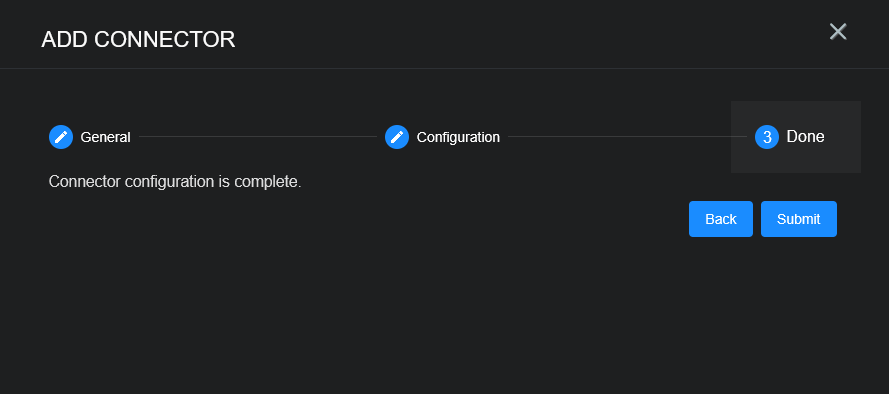
Click Next. The final confirmation tab appears.
-
Click Submit.
To pull data, a connector must be added to a Data Analyzer profile if it is running on the Data Processor.
-
If you are adding rather than editing a connector with the Collect function enabled and you specified for it to run on a Data Processor, a dialog box now prompts you to add the connector to the default Data Analyzer profile. Click Cancel to leave it out of the default profile or click OK to add it to the default profile.
-
This prompt only occurs during the initial create connector process when Collect is enabled.
-
Certain connectors can be run on either a Sensor or a Data Processor, and some are best run on one versus the other. In any case, when the connector is run on a Data Processor, that connector must be included in a Data Analyzer profile. If you leave it out of the default profile, you must add it to another profile. You need the Administrator Root scope to add the connector to the Data Analyzer profile. If you do not have privileges to configure Data Analyzer profiles, a dialog displays recommending you ask your administrator to add it for you.
-
The first time you add a Collect connector to a profile, it pulls data immediately and then not again until the scheduled interval has elapsed. If the connector configuration dialog did not offer an option to set a specific interval, it is run every five minutes. Exceptions to this default interval are the Proofpoint on Demand (pulls data every 1 hour) and Azure Event Hub (continuously pulls data) connectors. The intervals for each connector are listed in the Connector Types & Functions topic.
The Connector Overview appears.
-
The new connector is immediately active.
Testing the Connector
In addition to testing for connectivity, the Test button for the CODA Footprint connector tests that the Base URL and API Key or Username and Password are correct and data requests for the requested content types return successful responses.
When you add (or edit) a connector, we recommend that you run a test to validate the connectivity parameters you entered. (The test validates authentication and connectivity).
-
Click System | INTEGRATIONS | Connectors. The Connector Overview appears.
-
Locate the connector by name that you added, or modified, or that you want to test.
-
Click Test at the right side of that row. The test runs immediately.
Note that you may run only one test at a time.
Stellar Cyber conducts a basic connectivity test for the connector and reports a success or failure result. A successful test indicates that you entered all of the connector information correctly.
To aid troubleshooting your connector, the dialog remains open until you explicitly close it by using the X button. If the test fails, you can select the button from the same row to review and correct issues.
The connector status is updated every five (5) minutes. A successful test clears the connector status, but if issues persist, the status reverts to failed after a minute.
Repeat the test as needed.

If the test fails, the common HTTP status error codes are as follows:
| HTTP Error Code | HTTP Standard Error Name | Explanation | Recommendation |
|---|---|---|---|
| 400 | Bad Request | This error occurs when there is an error in the connector configuration. |
Did you configure the connector correctly? |
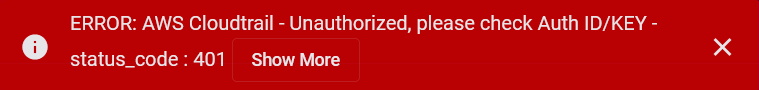
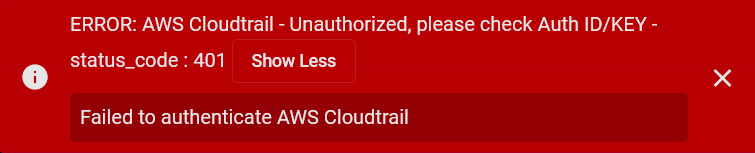
| 401 | Unauthorized |
This error occurs when an authentication credential is invalid or when a user does not have sufficient privileges to access a specific API. |
Did you enter your credentials correctly? Are your credentials expired? Are your credentials entitled or licensed for that specific resource? |
| 403 | Forbidden | This error occurs when the permission or scope is not correct in a valid credential. |
Did you enter your credentials correctly? Do you have the required role or permissions for that credential? |
| 404 | Not Found | This error occurs when a URL path does not resolve to an entity. | Did you enter your API URL correctly? |
| 429 | Too Many Requests |
This error occurs when the API server receives too much traffic or if a user’s license or entitlement quota is exceeded. |
The server or user license/quota will eventually recover. The connector will periodically retry the query. If this occurs unexpectedly or too often, work with your API provider to investigate the server limits, user licensing, or quotas. |
For a full list of codes, refer to HTTP response status codes.
Verifying Ingestion
To verify ingestion:
-
Select Threat Hunting.
The Interflow Search tab appears.
-
Change the Indices for the type of content you collected:
-
For Alert and Device Application, change the Indices to Syslog.
-
For Device Vulnerability change the Indices to Scans.
-
For Device change the Indices to Assets.
The table immediately updates to show ingested Interflow records.
-
Filtering APIs on CODA Footprint Connectors
Some vendor APIs integrated through Stellar Cyber connectors do not support time-bounded querying (for example, using start_time, end_time, or equivalent filters), and may lack time-series metadata on records. As a result, Stellar Cyber is required to pull the entire dataset during each polling cycle, regardless of whether the data has changed.
Potential Impact
-
Performance Overhead: The absence of time-based filtering may lead to increased load on the Stellar Cyber ingestion pipeline and degrade collection performance over time.
-
Inefficient Polling: The connector must fetch and process all available records each cycle, leading to longer collection durations and higher resource usage.
-
Scalability Limitations: For large or growing datasets (for example, alerts, logs, or assets), this limitation may result in delayed data availability or collection timeouts.
-
Data Inconsistency: Data may be duplicated or missed due to the quantity of data.
When working with connectors that have this limitation, consider the potential impact on performance and collection efficiency.
Recommendation
Where possible, we recommend working with your vendor to improve or add time range filtering capabilities to their APIs.
CODA Footprint Connector Content Types
The CODA Footprint connector content types impacted by this limitation are as follows:
-
Device (asset)
-
Device Application (filter by device ID)
-
Device Vulnerability (filter by device ID)
The Device Vulnerability and Device Application content types are pulled depending on the number of devices pulled when the Device content type was ingested. The Device content type can only be pulled for the entire dataset (no time range filter).
