Configuring Wiz Connectors
This connector allows Stellar Cyber to ingest logs from Wiz and add the records to the data lake. It integrates with the Wiz API to ingest Issues and Vulnerabilities data types.
Wiz is a cloud security platform that helps organizations make their cloud environments secure and more streamlined. They create a normalizing layer across different cloud environments, so companies can spot and remove high-priority risks faster.
The Wiz API has a rate limit that is based per service account on tenant level. The rate limit is 10 calls per second for a service account query. Depending on the amount of data, the connector may fail to pull data and receive a 429 response.
Stellar Cyber connectors with the Collect function (collectors) may skip collecting some data when the ingestion volume is large, which potentially can lead to data loss. This can happen when the processing capacity of the collector is exceeded.
Connector Overview: Wiz
Capabilities
-
Collect: Yes
-
Respond: No
-
Native Alerts Mapped: No
-
Runs on: DP
-
Interval: Configurable
Collected Data
|
Content Type |
Index |
Locating Records |
|---|---|---|
|
Issues Vulnerabilities |
Syslog (for Issues) Scans (for Vulnerabilities) |
Domain
|
<Base URL> where <Base URL> is a variable from the configuration of this connector |
Response Actions
N/A
Third Party Native Alert Integration Details
N/A
Required Credentials and Configurations
-
Auth URL, Base URL, Client ID, and Client Secret
or -
Auth URL (Custom URL), Custom Auth URL, Credential Audience, Base URL (Custom URL), Custom Base URL, Client ID, and Client Secret
Adding a Wiz Connector
To add a Wiz connector:
Obtaining Wiz Credentials
Before you configure the connector in Stellar Cyber, you must obtain the following Wiz credentials:
-
Auth URL—The authentication URL. There are three URLs, based on tenant. The values are:
-
https://auth.app.wiz.io for Wiz Commercial (default)
-
https://auth.app.wiz.us for Wiz for Gov
-
https://auth.gov.wiz.io for Wiz Commercial on GovCloud
-
Custom URL
-
-
Base URL—The base URL for API access. The base URL depends on the region. There are four regions (us1, us2, eu1, and eu2). The values are:
-
https://api.us1.app.wiz.io (default)
-
https://api.us2.app.wiz.us
-
https://api.eu1.app.wiz.io
-
https://api.eu2.app.wiz.io
-
Custom URL
-
-
Client ID and Client Secret—The authentication credentials.
or
-
Auth URL—The same values as above. Select Custom URL to display Custom Auth URL and Credential Audience fields.
-
Custom Auth URL—The default is: https://auth.app.wiz.io
-
Credential Audience—The credential audience may have a different value based on the tenant URL used in authentication. When Auth URL is custom, then the Credential Audience value is unknown, so it needs to be input by the user. The default is: wiz-api
-
Base URL—The same values as above. Select Custom URL to display Custom Base URL field.
-
Custom Base URL—The default is https://api.us1.app.wiz.io
-
Client ID and Client Secret—The authentication credentials.
Adding a Service Account
Add a service account for authenticating with the Wiz API. You will need to specify the permissions (API scopes).
Follow the guidance in your Wiz API documentation.
-
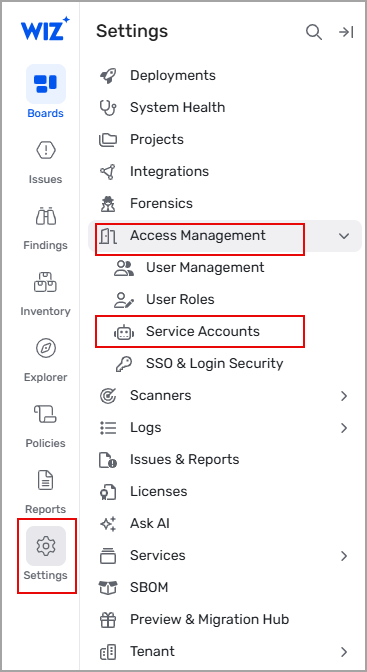
Log in as a Wiz administrative user with Write permission for Service Accounts.
- Select Settings > Access Management > Service Accounts.
-
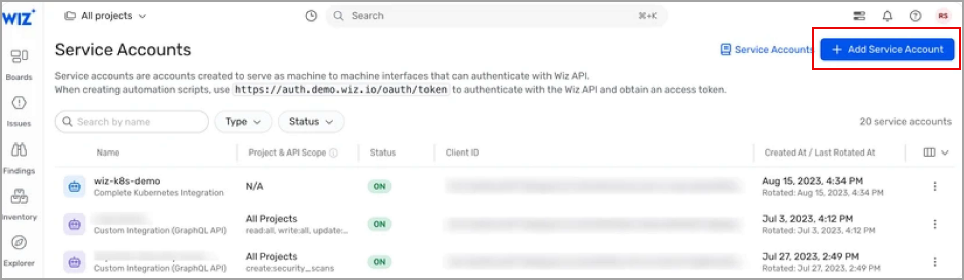
Click Add Service Account.
-
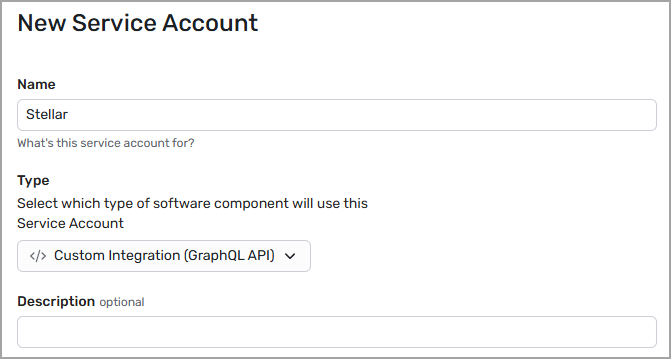
Enter a Name, an optional Description, and select a Type. For Type, choose Custom Integration (GraphQL API).
-
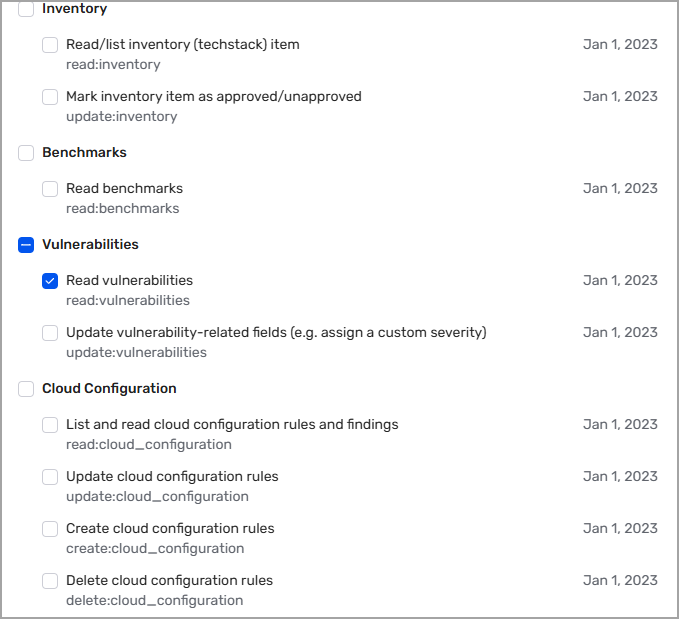
Select the API Scopes to grant to this new service account.
For example, under Resources, select Read graph resource.
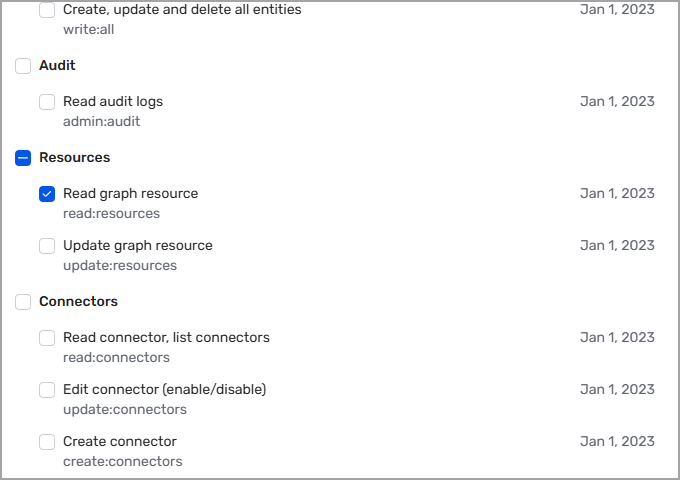
For example, under Issues, select Read an issue, list issues.
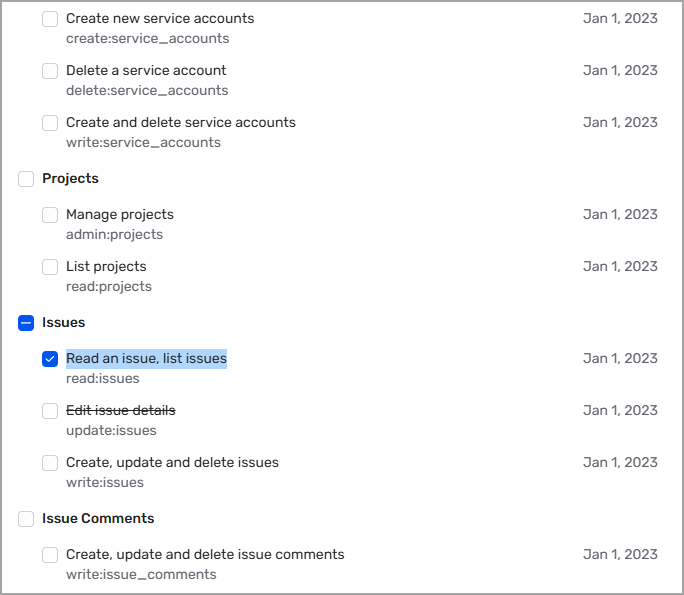
For example, under Vulnerabilities, select Read vulnerabilities.
-
Click Add Service Account.
-
The Client ID and Client Secret are displayed for the new service account. They will be needed when configuring the connector in Stellar Cyber.
Copy the Client ID and Client Secret and store them in a safe location.
Adding the Connector in Stellar Cyber
To add a Wiz connector in Stellar Cyber:
-
Log in to Stellar Cyber.
-
Click System | INTEGRATIONS | Connectors. The Connector Overview appears.
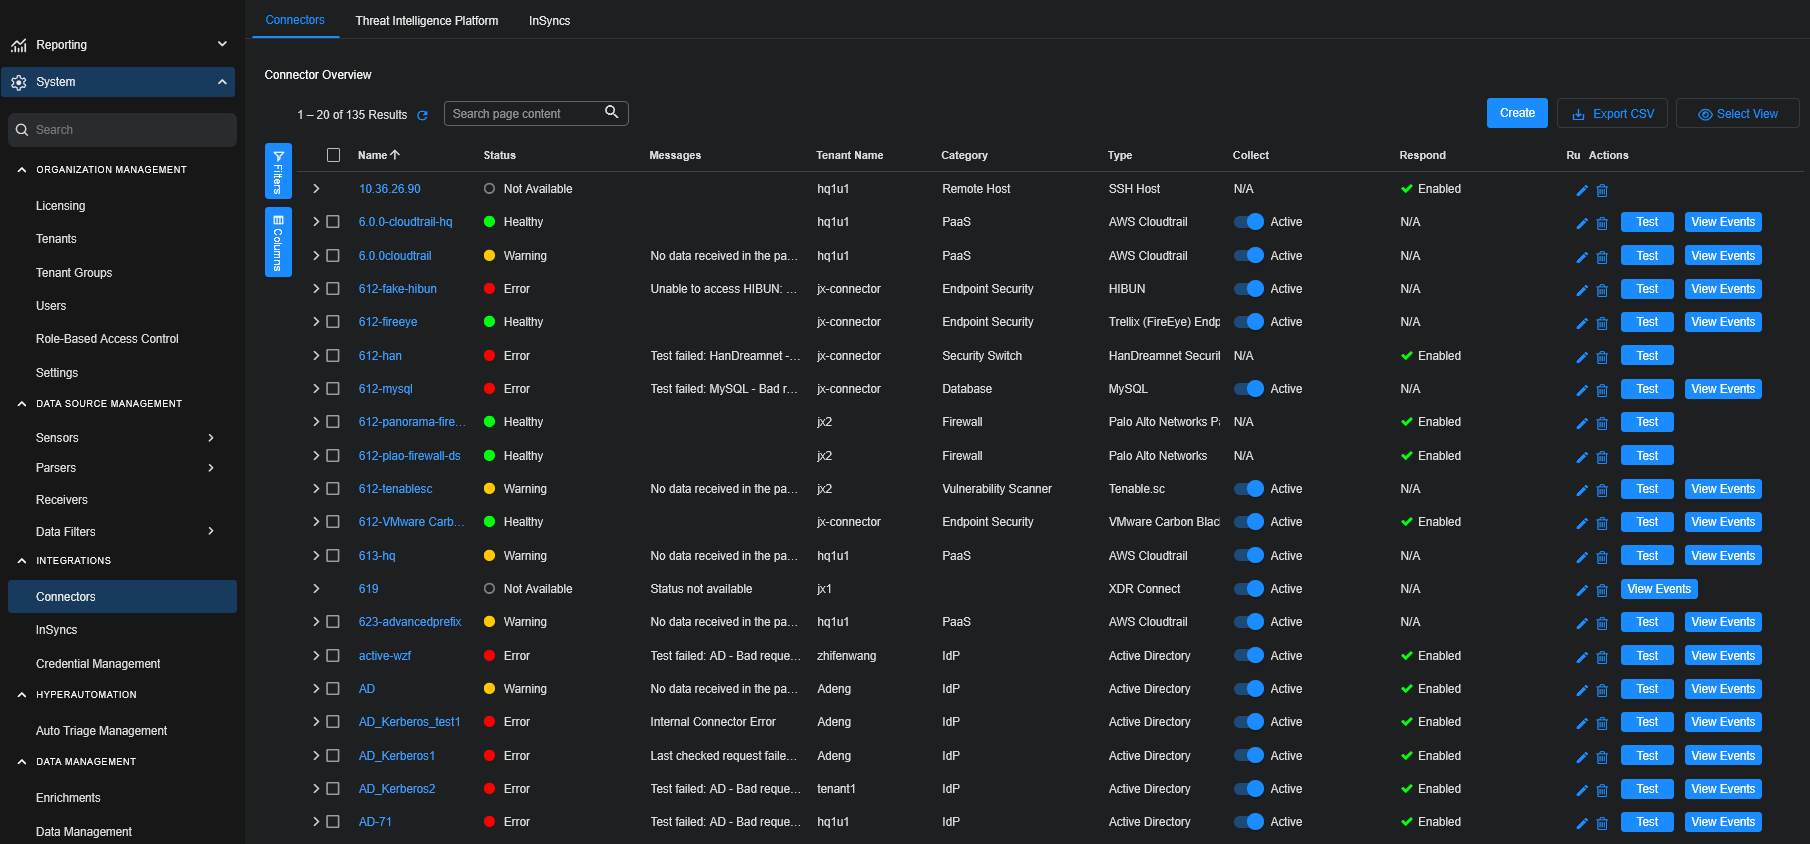
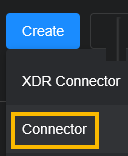
-
Click Create and select Connector.
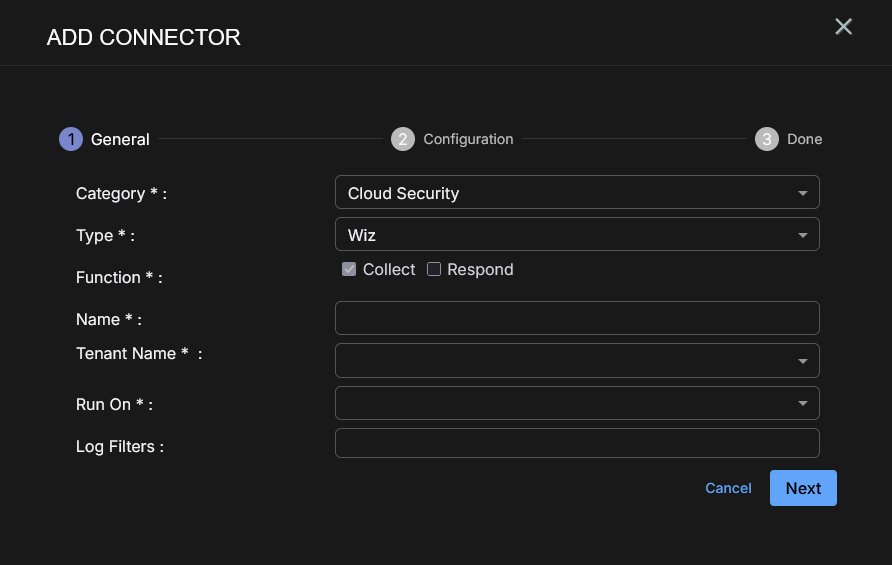
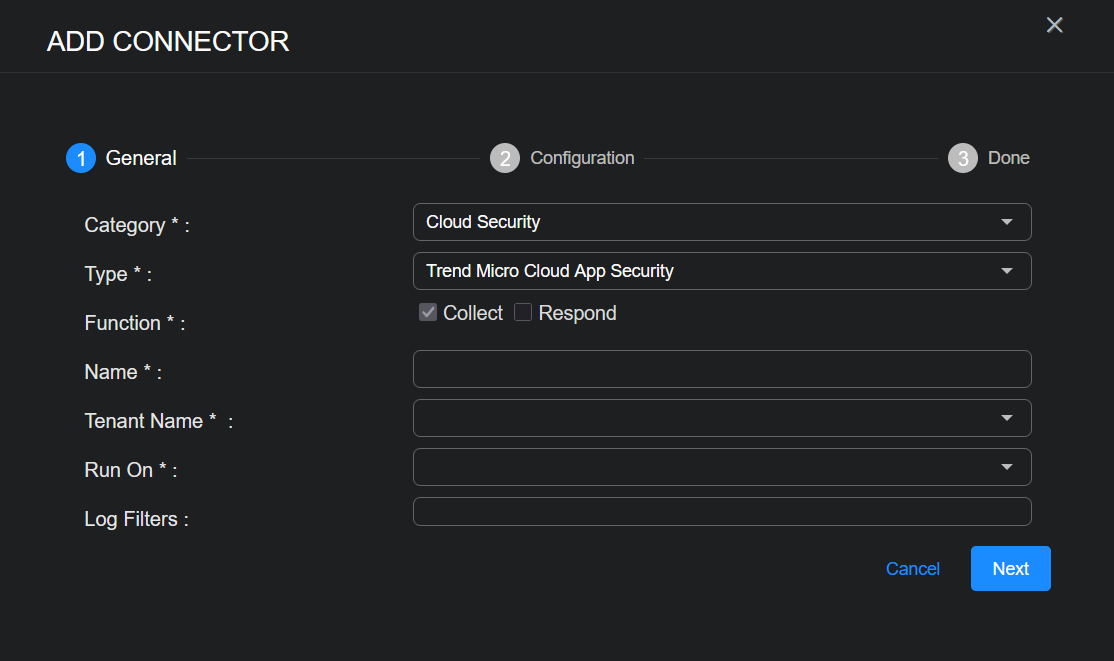
The General tab of the Add Connector screen appears. The information on this tab cannot be changed after you add the connector.
-
Choose Cloud Security from the Category dropdown.
-
Choose Wiz from the Type dropdown.
The asterisk (*) indicates a required field.
-
For this connector, the supported Function is Collect, which is enabled already.
-
Enter a Name.
Notes:- This field does not accept multibyte characters.
- It is recommended that you follow a naming convention such as tenantname-connectortype.
-
Choose a Tenant Name. The Interflow records created by this connector include this tenant name.
-
Choose the device on which to run the connector.
-
Certain connectors can be run on either a Sensor or a Data Processor. The available devices are displayed in the Run On menu. If you want to associate your collector with a sensor, you must have configured that sensor prior to configuring the connector or you will not be able to select it during initial configuration.
-
If the device you're connecting to is on premises, we recommend you run on the local sensor. If you're connecting to a cloud service, we recommend you run on the DP.
-
-
(Optional) When the Function is Collect, you can apply Log Filters. For information, see Managing Log Filters.
-
Click Next. The Configuration tab appears.
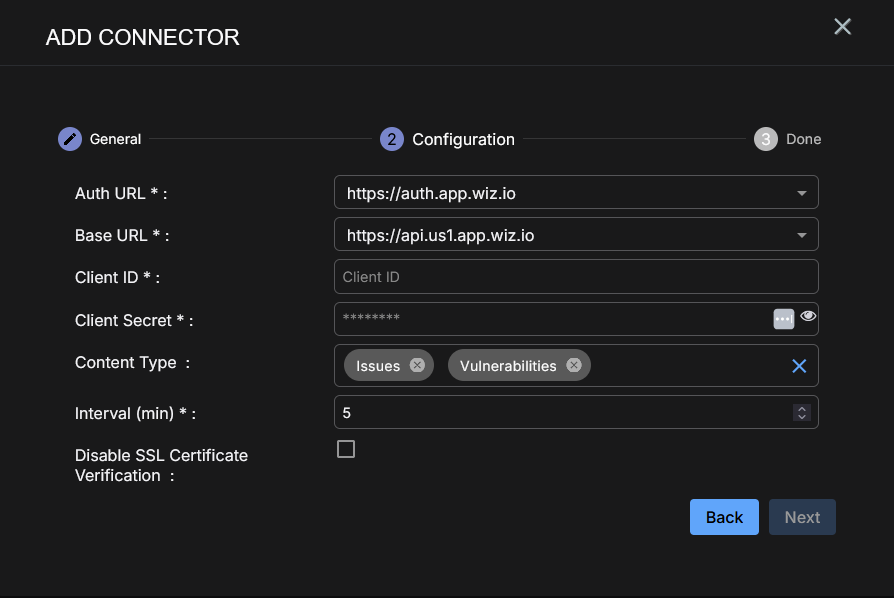
The asterisk (*) indicates a required field.
-
If you select an Auth URL from the dropdown menu:
-
Select the Auth URL you noted above in Obtaining Wiz Credentials.
-
Select the Base URL you noted above, then skip the next step.
-
-
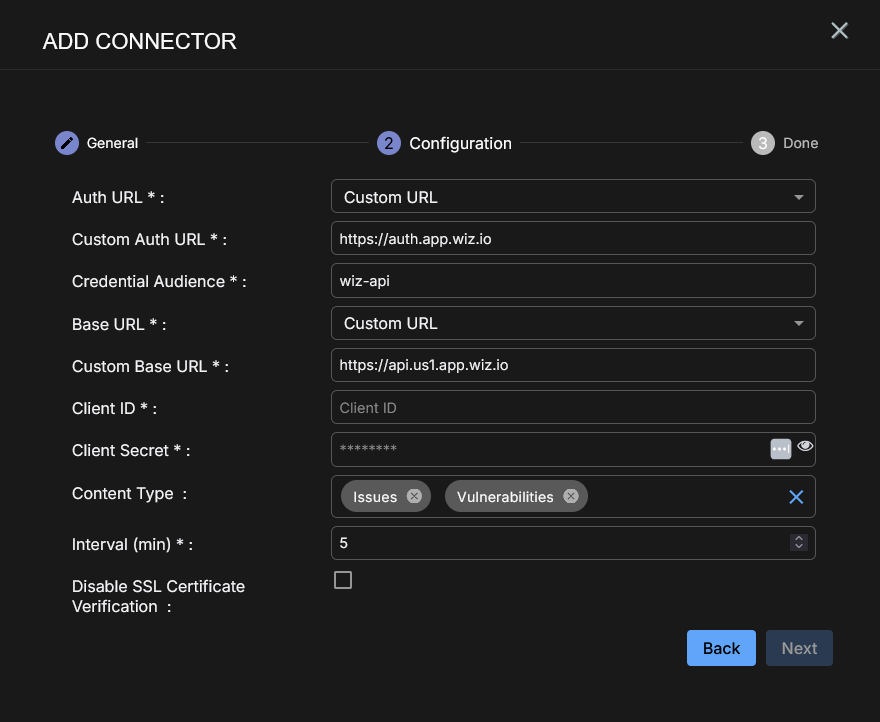
If you select Custom URL from the dropdown menu in the Auth URL field:
-
Enter the Custom Auth URL or keep the default.
-
Enter the Credential Audience or keep the default.
-
For Base URL, select Custom URL.
-
Enter the Custom Base URL or keep the default.
-
-
Enter the Client ID you noted above.
-
Enter the Client Secret you noted above.
-
Choose the Content Type you would like to collect. The logs for Issues and Vulnerabilities are supported.
-
Choose the Interval (min). This is how often the logs are collected.
-
(Optional) Click Disable SSL Certificate Verification if you want to disable SSL certificate verification. Only disable SSL certificates if you have a reason to, otherwise, it is not a good security practice.
-
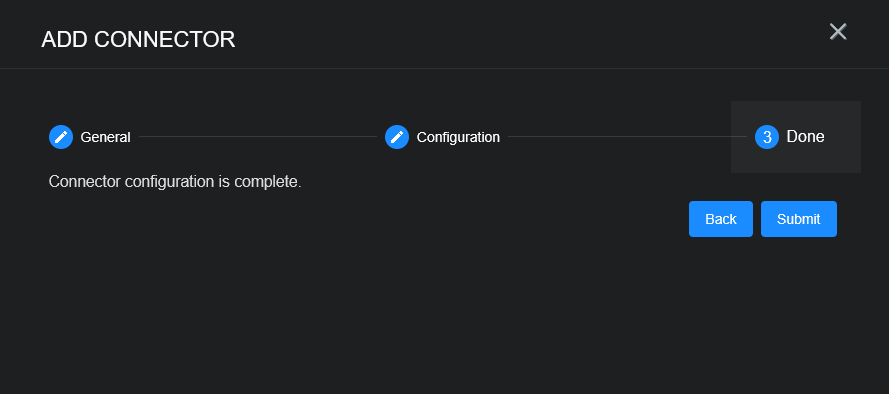
Click Next. The final confirmation tab appears.
-
Click Submit.
To pull data, a connector must be added to a Data Analyzer profile if it is running on the Data Processor.
-
If you are adding rather than editing a connector with the Collect function enabled and you specified for it to run on a Data Processor, a dialog box now prompts you to add the connector to the default Data Analyzer profile. Click Cancel to leave it out of the default profile or click OK to add it to the default profile.
-
This prompt only occurs during the initial create connector process when Collect is enabled.
-
Certain connectors can be run on either a Sensor or a Data Processor, and some are best run on one versus the other. In any case, when the connector is run on a Data Processor, that connector must be included in a Data Analyzer profile. If you leave it out of the default profile, you must add it to another profile. You need the Administrator Root scope to add the connector to the Data Analyzer profile. If you do not have privileges to configure Data Analyzer profiles, a dialog displays recommending you ask your administrator to add it for you.
-
The first time you add a Collect connector to a profile, it pulls data immediately and then not again until the scheduled interval has elapsed. If the connector configuration dialog did not offer an option to set a specific interval, it is run every five minutes. Exceptions to this default interval are the Proofpoint on Demand (pulls data every 1 hour) and Azure Event Hub (continuously pulls data) connectors. The intervals for each connector are listed in the Connector Types & Functions topic.
The Connector Overview appears.
-
The new connector is immediately active.
Testing the Connector
In addition to testing for connectivity, the Test button for the Wiz connector tests that the Auth URL, Base URL, Client ID, and Client Secret are correct and data requests for the requested content type returns successful responses.
When you add (or edit) a connector, we recommend that you run a test to validate the connectivity parameters you entered. (The test validates authentication and connectivity).
-
Click System | INTEGRATIONS | Connectors. The Connector Overview appears.
-
Locate the connector by name that you added, or modified, or that you want to test.
-
Click Test at the right side of that row. The test runs immediately.
Note that you may run only one test at a time.
Stellar Cyber conducts a basic connectivity test for the connector and reports a success or failure result. A successful test indicates that you entered all of the connector information correctly.
To aid troubleshooting your connector, the dialog remains open until you explicitly close it by using the X button. If the test fails, you can select the button from the same row to review and correct issues.
The connector status is updated every five (5) minutes. A successful test clears the connector status, but if issues persist, the status reverts to failed after a minute.
Repeat the test as needed.

If the test fails, the common HTTP status error codes are as follows:
| HTTP Error Code | HTTP Standard Error Name | Explanation | Recommendation |
|---|---|---|---|
| 400 | Bad Request | This error occurs when there is an error in the connector configuration. |
Did you configure the connector correctly? |
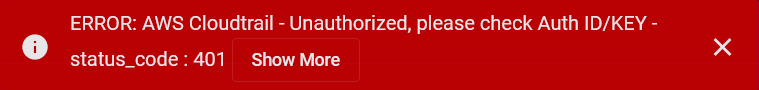
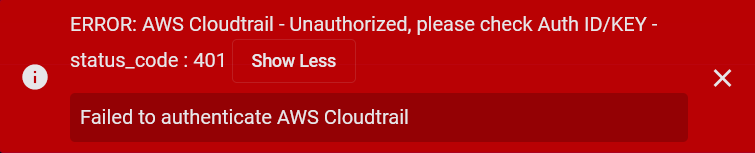
| 401 | Unauthorized |
This error occurs when an authentication credential is invalid or when a user does not have sufficient privileges to access a specific API. |
Did you enter your credentials correctly? Are your credentials expired? Are your credentials entitled or licensed for that specific resource? |
| 403 | Forbidden | This error occurs when the permission or scope is not correct in a valid credential. |
Did you enter your credentials correctly? Do you have the required role or permissions for that credential? |
| 404 | Not Found | This error occurs when a URL path does not resolve to an entity. | Did you enter your API URL correctly? |
| 429 | Too Many Requests |
This error occurs when the API server receives too much traffic or if a user’s license or entitlement quota is exceeded. |
The server or user license/quota will eventually recover. The connector will periodically retry the query. If this occurs unexpectedly or too often, work with your API provider to investigate the server limits, user licensing, or quotas. |
For a full list of codes, refer to HTTP response status codes.
Verifying Ingestion
To verify ingestion:
-
Select Threat Hunting.
The Interflow Search tab appears.
-
Change the Indices for the type of content you collected:
-
For Issues, change the Indices to Syslog.
-
For Vulnerabilities, change the Indices to Scans.
The table immediately updates to show ingested Interflow records.
-
