Threat Hunting
![]() Learn more at Stellar Cyber Academy.
Learn more at Stellar Cyber Academy.
The following links take you to courses on the Stellar Cyber Academy technical training portal where you can learn more about a topic by watching the suggested lessons.
Explore the Alerts view, learning how to filter, sort, and manage Alerts within the Stellar Cyber Platform. Understand how machine learning drives alert generation and prioritization, and how to use these alerts to create custom Cases.
Explore available views for managing and investigating alerts, including the Alerts Table, Kill Chain, and Threat Hunting views within the Stellar Cyber Platform. Learn to leverage MITRE ATT&CK data, threat intelligence, and toolbar filters to enhance alert triage and investigation workflows. Follow along with a demonstration on interacting with alerts across different views, applying search tool queries, and conducting threat-hunting activities efficiently. Discover how to tune alert settings and use custom filtering options for focused analysis across the data lake.
Discover techniques for using the Threat Hunting view to identify and investigate unknown threats in your network. Learn how to filter data by entity and behavior, and leverage visualizations to enhance threat detection and analysis.
Discover foundational strategies for building workflows in the Stellar Cyber Platform, focusing on tools that support knowledge transfer, case management, and task tracking. Learn how to structure workflows to streamline operations within your SOC.
Watch a demonstration of the filters side panel, toolbar filters, and search capabilities. Learn practical techniques for configuring filters and search queries, including options for time intervals, index selection, and alert scores to streamline threat hunting.
Learn to use the search tool in Investigate | Threat Hunting to create queries with field names and values in JSON-formatted Interflow records. Practice with field name syntax to find data for threat hunting, case management, and dashboards.
Use the Interflow dictionary to locate relevant indices and field names for precise search queries. Identify values for fields like source IP type, destination country, and event source in Investigate | Threat Hunting for more targeted searches.
Explore the Interflow dictionary to find specific field values within indices. Use this tool to accurately query values in fields such as source IP address reputation, geo-location, and event status, enhancing dashboards and filters for threat detection.
The first time you access a link on the portal during a session, you must log in to access content.
Use the Threat Hunting page to examine network events of interest with an emphasis on security anomalies. There are three tabs:
-
Interflow Search: The default tab, an overview of all events. From here, you can use the following query tools:
-
Main Search Field: Use keywords to search the data lake
-
Visual Dictionary: Select keywords from a list, then filter values from chart legends
-
Table Search Field: Use keywords to search within the displayed results
-
-
Correlation Search: Visualize alert type correlations
-
Threat Hunting Library: Use an alert type to narrow your hunt
Each of these tabs is described in the sections below.
As with other Stellar Cyber pages that display event information, the data shown is subject to the filter controls at the top of the screen. See the Queries page for more details.
Interflow Search
The Threat Hunting interface uses the Interflow Search tab as its default display, as shown in the figure below.
All results in this screen are additionally filtered according to the parameters at the top of the screen, such as Time Interval. If you select multiple indices, the interval may be automatically adjusted to a smaller duration for efficiency.
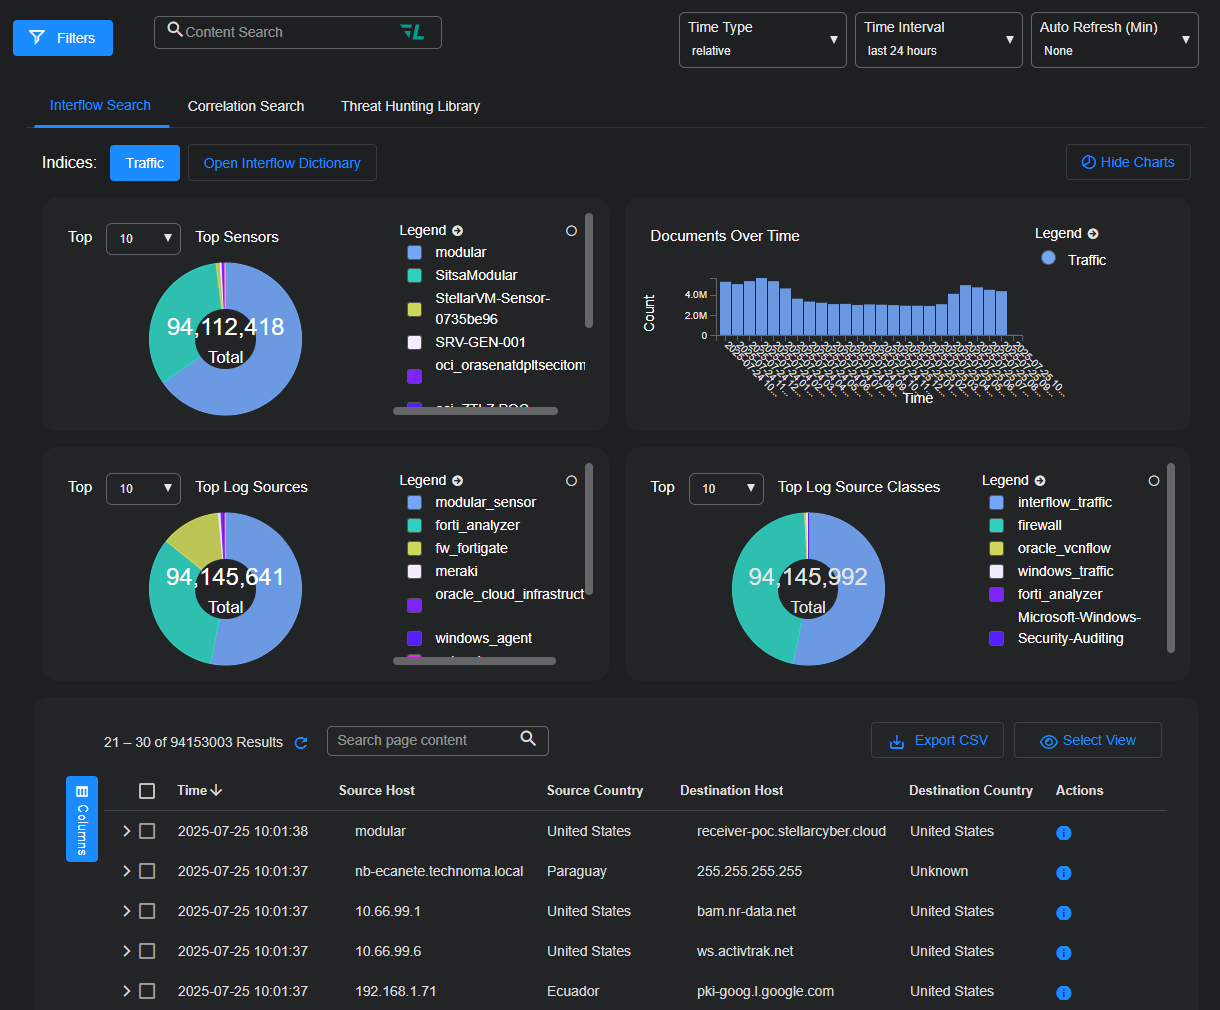
The most important control on this screen is the Indices selector. The Stellar Cyber data lake supports the following indices:
- Alerts (default)
- Assets
- AWS Events
- IDPS/Malware Sandbox Events
- Linux Events
- Scans
- Sensor Monitoring
- Signals
- Syslog
- Traffic
- Users
- Windows Events
You can choose a single index, multiple indices, or even all indices.
When you choose an index—whether a single index, multiple indices, or all available indices—that selection is automatically saved as a personal preference. The same index configuration is restored when you return to the Threat Hunting page after navigating away and back again during the same session, and even after logging out and back in again later. This persistence ensures that you can resume your investigations without resetting the index each time you return to it. ![]()
Searches through multiple indices can be resource intensive, so Stellar Cyber restricts the time interval to reduce the performance impact.
By default, you must manually run a search on the Threat Hunting page. This is a behavior change in 6.5.0
This option is useful when you work with large datasets, multiple indices, or other search conditions that can take longer to process. If cached results are available, the page can continue to display them until you run a new search.
If you toggle on Automatic Search, Threat Hunting returns to the previous behavior and automatically reruns a search when search settings change.

The Automatic Search setting is saved per browser in local storage. It's not shared across browser sessions or stored with your user account.
Interflow Search Using the Search Field
Use the same search syntax in this field as you use elsewhere in the Stellar Cyber UI to isolate specific records. Ideally, you set the index first and then search for a specific pattern, such as srcip:10.20.25.119. (You can start with the Visual Dictionary to learn more about the fields to query, if needed.)
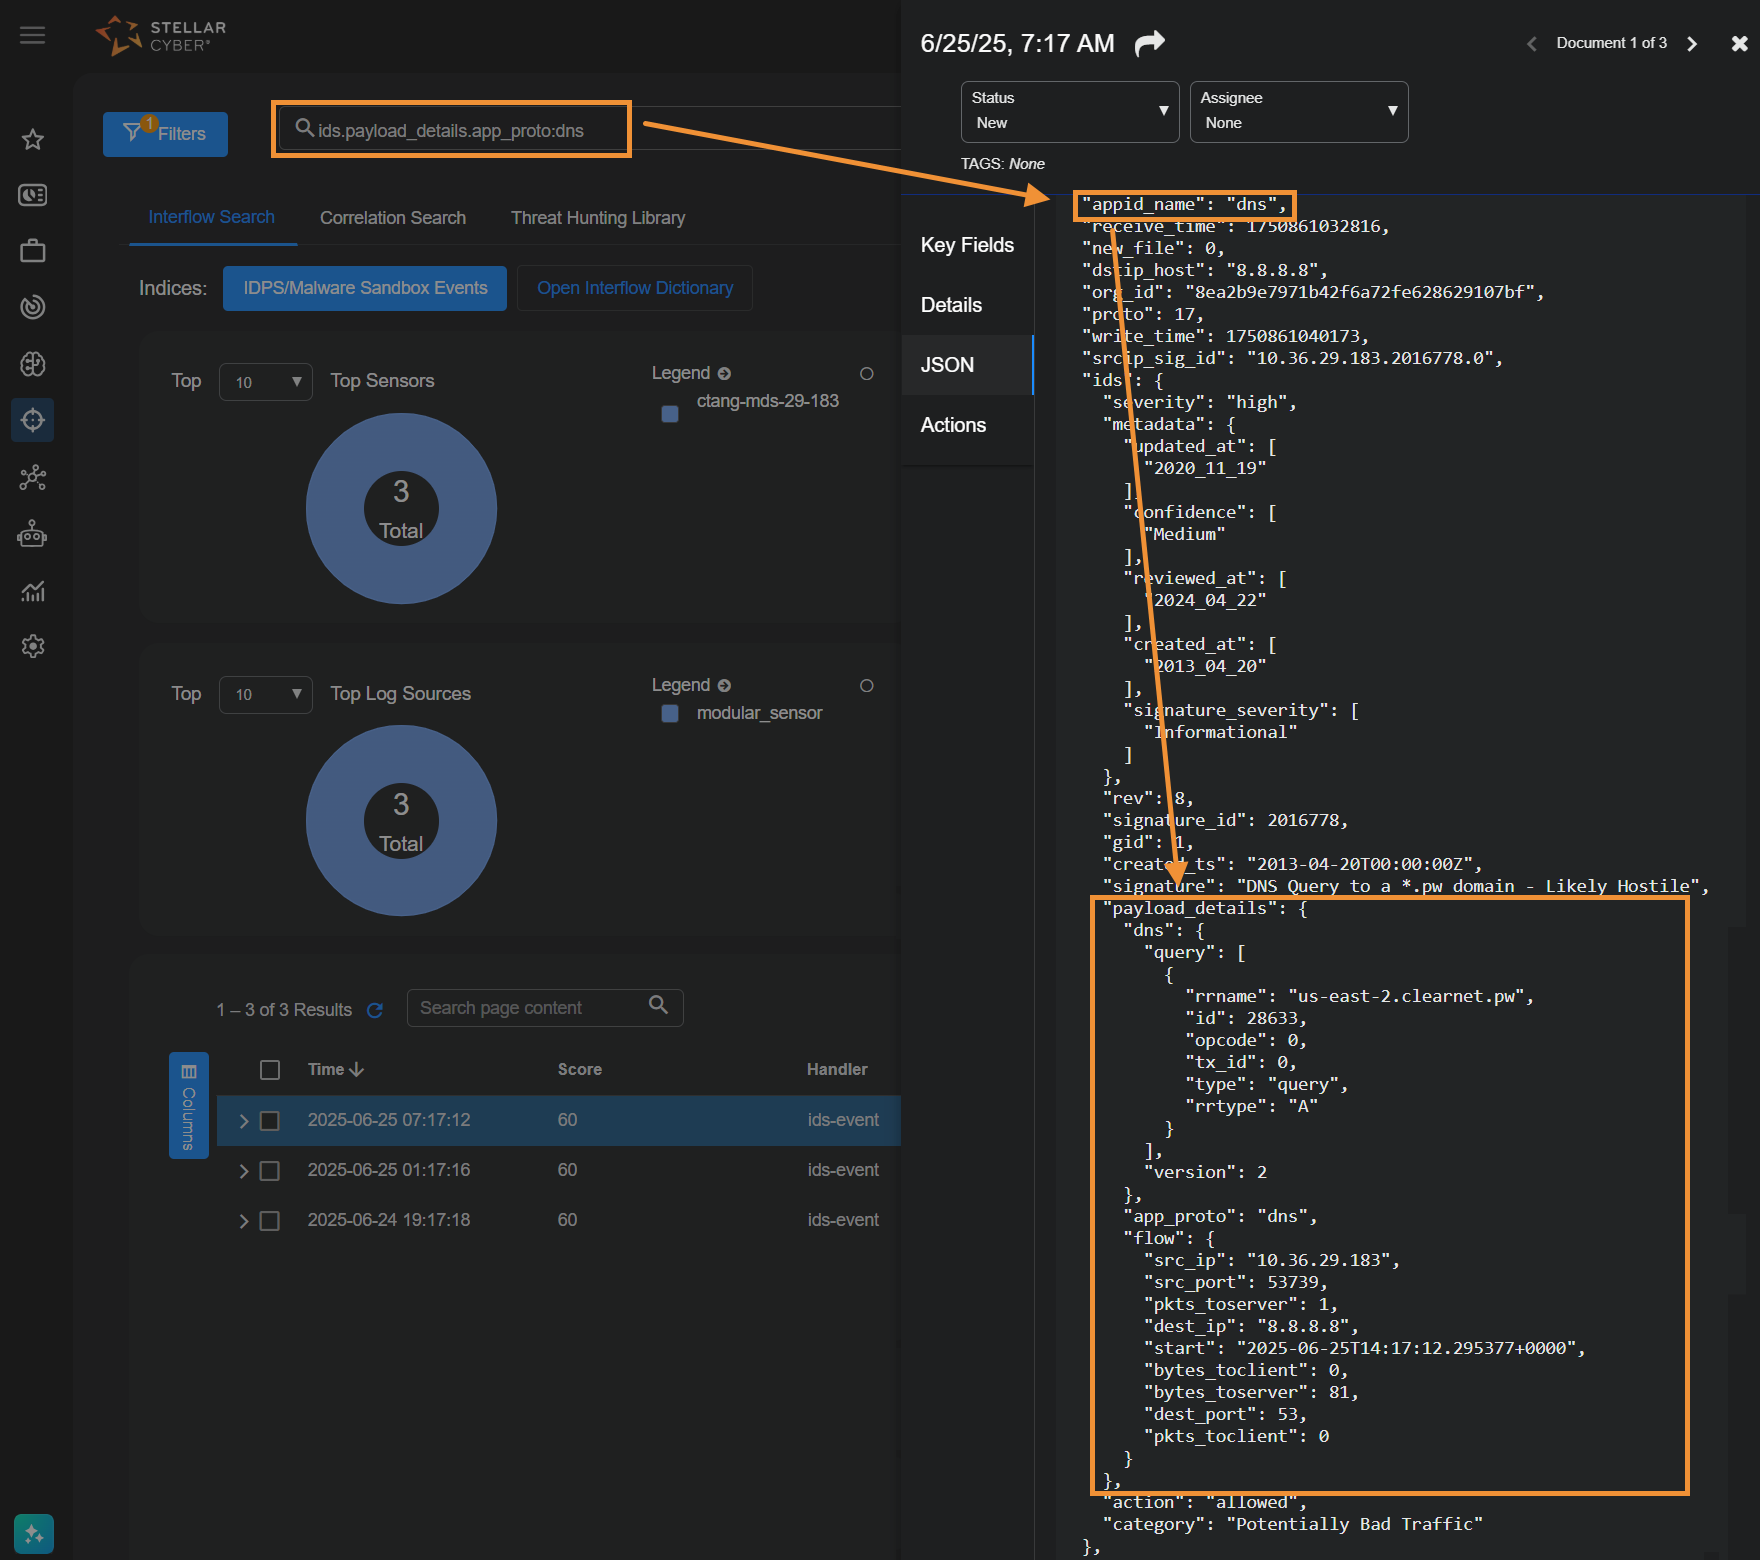
Following is an example search for IDS records with payload data. The payload feature is supported with http and dns, so the query searches for just this feature in these types of applications.
-
Navigate to Threat Hunting.
-
Set the index to IDPS/Malware Sandbox Events.
-
In the Search field above the index, enter the following string, which is only present in these records (substitute
dnsas needed):ids.payload_details.app_proto:http
The panels at the top of the page and Interflow records table at the bottom of the page update with all matching data.
-
Select More Info from a specific row in the Interflow records table to display the event details in a side panel.
-
In the side panel, open the JSON tab and view the payload information.
Note that encrypted payload data is not parsed with this feature.
Searching for Alerts Without Correlated Cases
You can use the following search in the Lucene Search bar in either the Alerts or Threat Hunting page to see alerts that have not been correlated to cases in the current time window:
(NOT ( (_exists_:(xdr_event.name OR event_name) AND _exists_:orig_index) OR (stellar.ath.type:raw AND stellar.ath.to_incident:true))) OR xdr_event.name: (ade_outbytes_anomaly OR ade_outbytes_anomaly_flip)
Interflow Search Using the Visual Dictionary
On the Threat Hunting page, select the Open Interflow Dictionary button to display Interflow data.
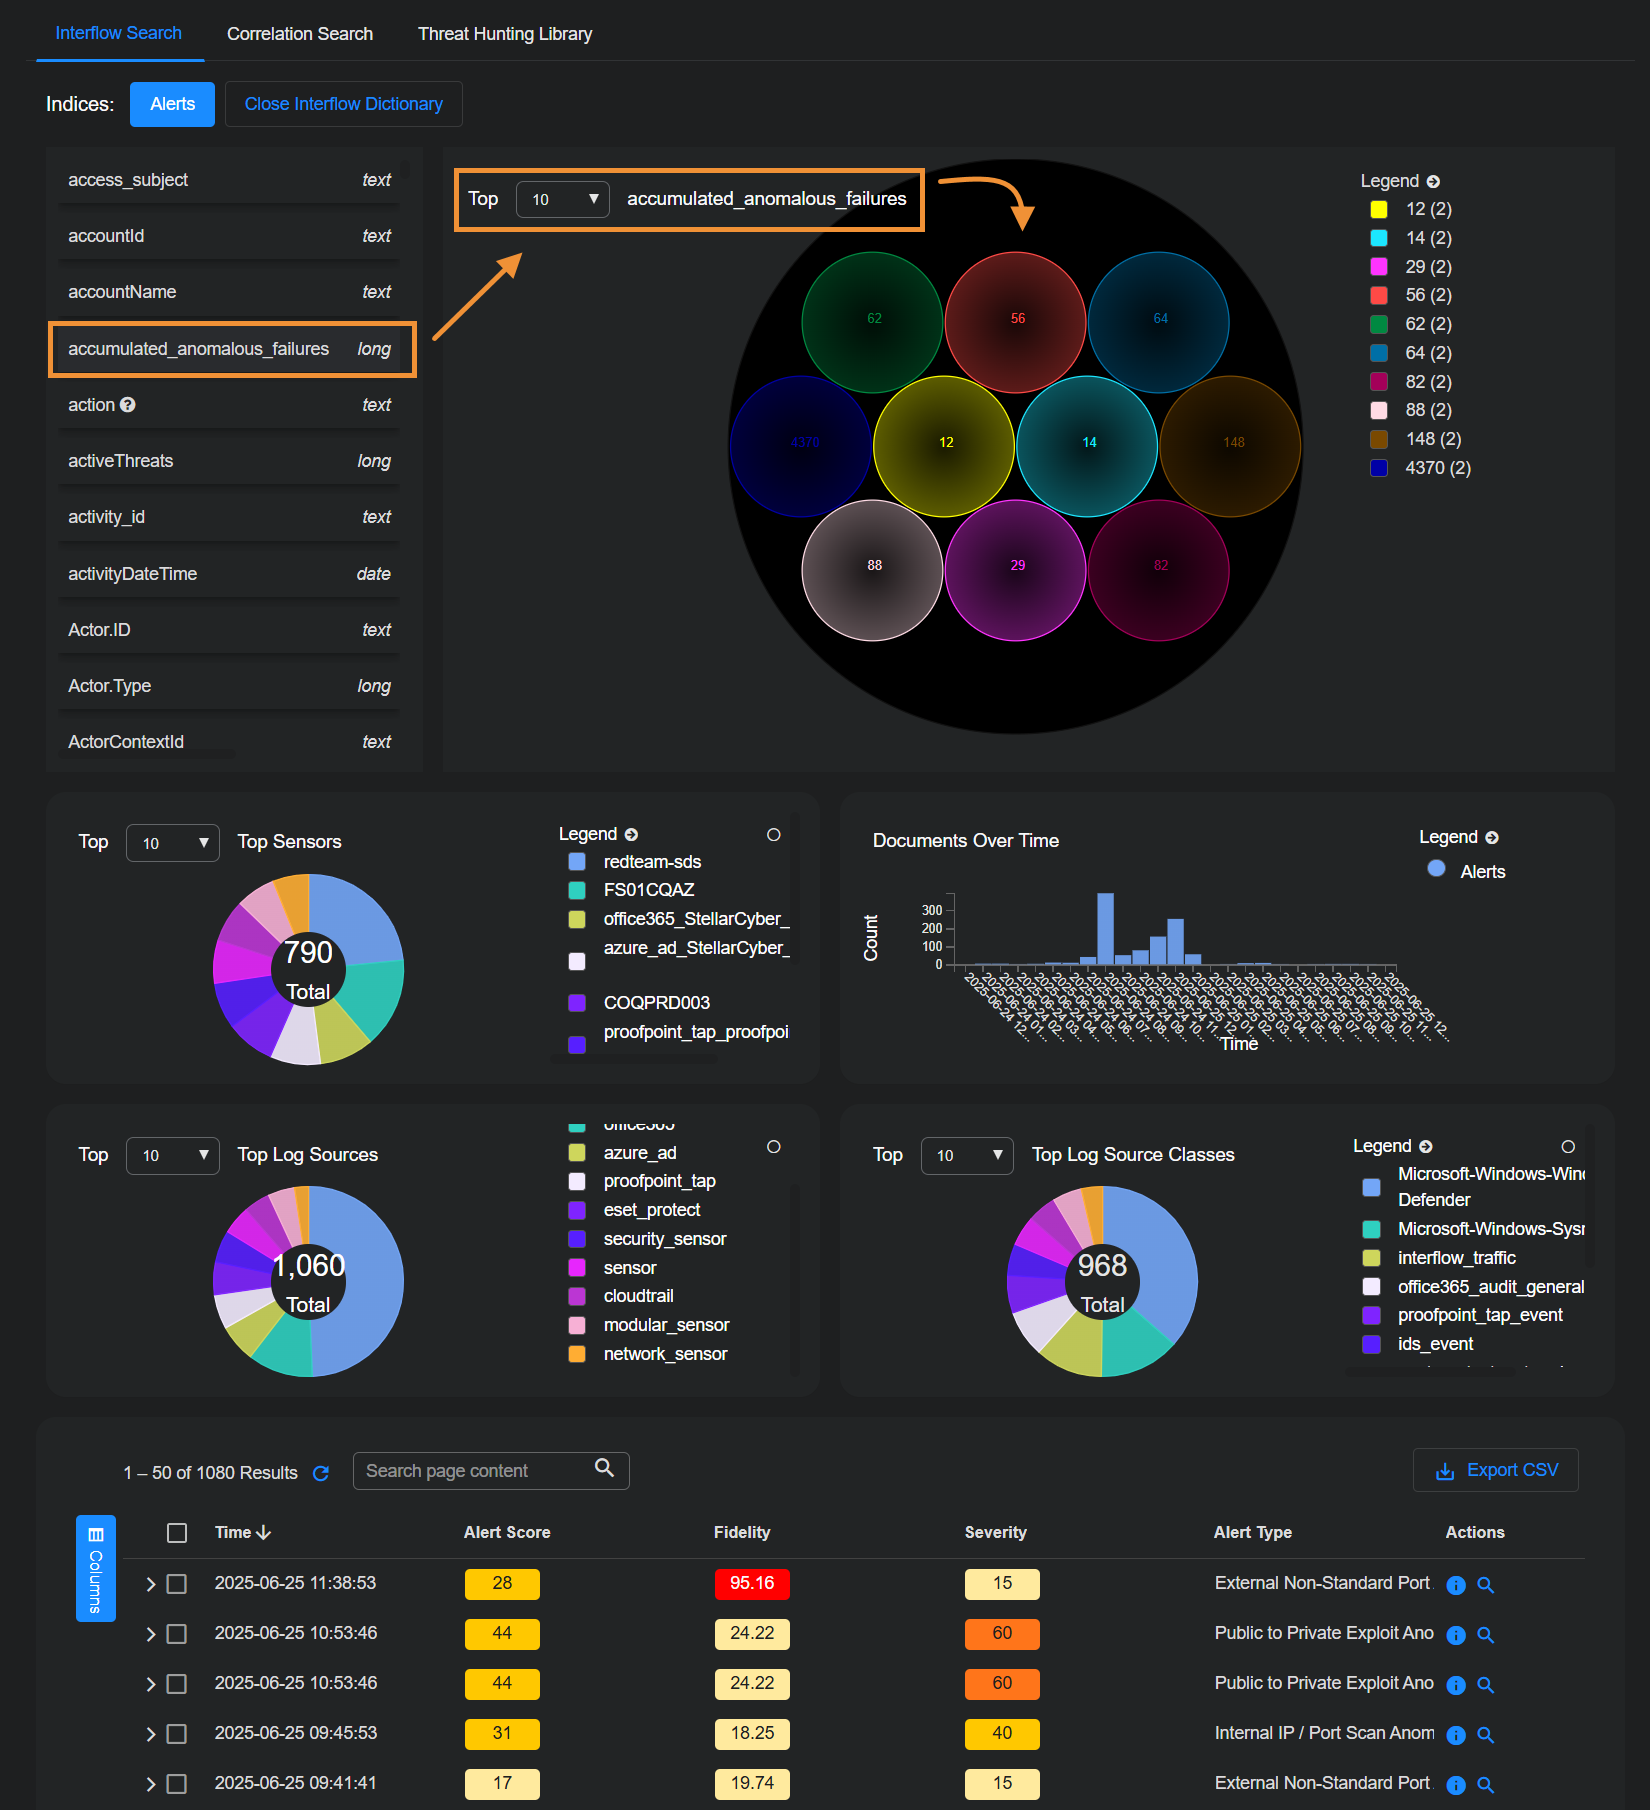
The keywords are displayed next to the visual dictionary. The visual dictionary provides a simple, visual way to hunt for threats. To begin threat hunting visually:
-
Find a keyword to use as the beginning of your hunt and select it ; for example,
srcip_geo.countryName.The visual dictionary immediately changes to reflect your choice.
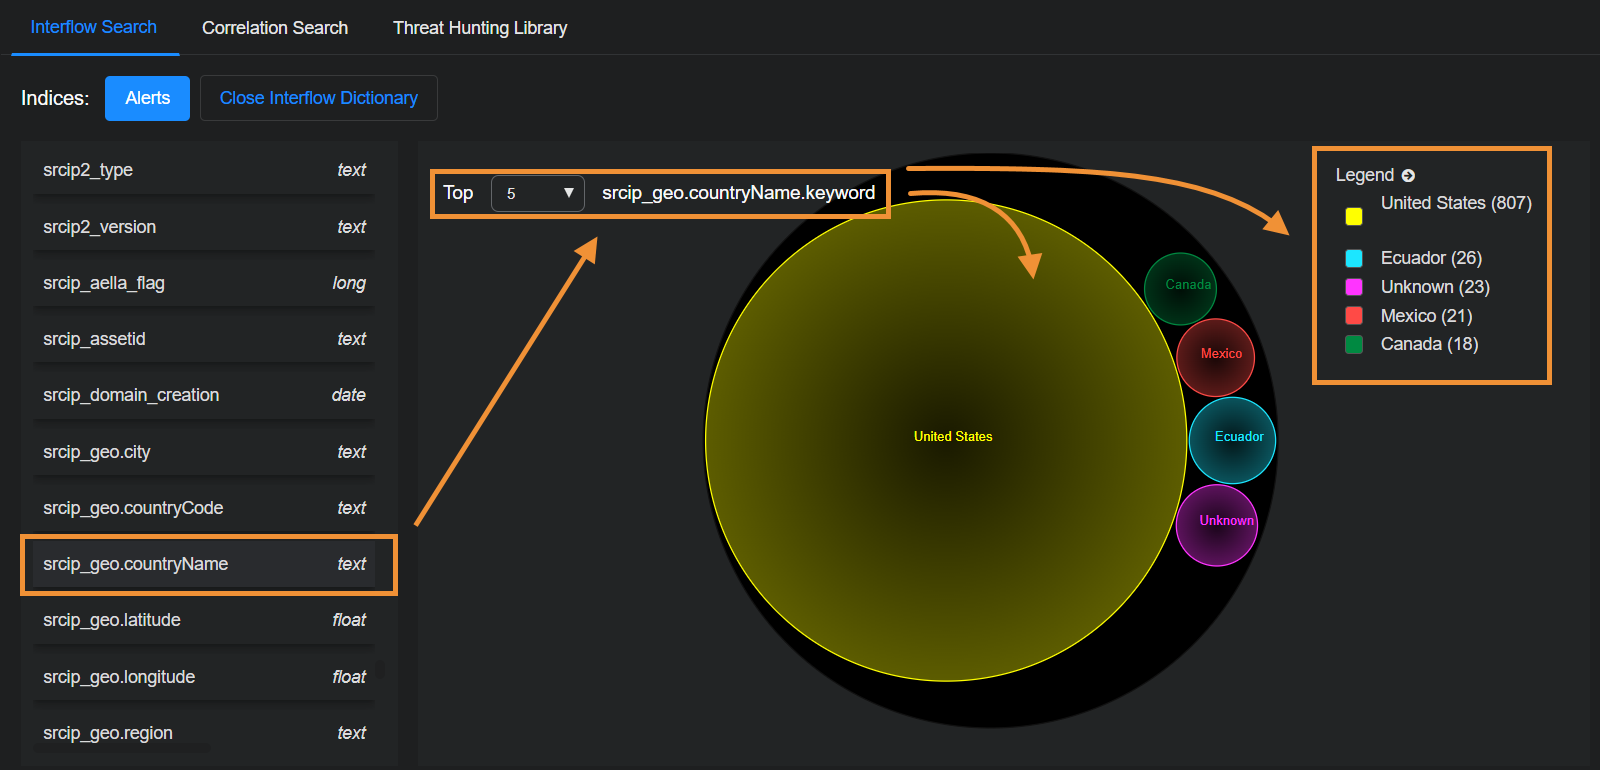
There are 23 source IP addresses from an unknown country in this example.
-
Hover your cursor over Unknown (23) in the legend.
The and icons appear.
-
Select .
This adds Unknown as a filter and the results are immediately filtered. The diagram now shows only results with a source IP address in an unknown country.
-
Find and select another keyword to further narrow your hunt; for example, event_type.
The display again immediately changes to reflect your choice.
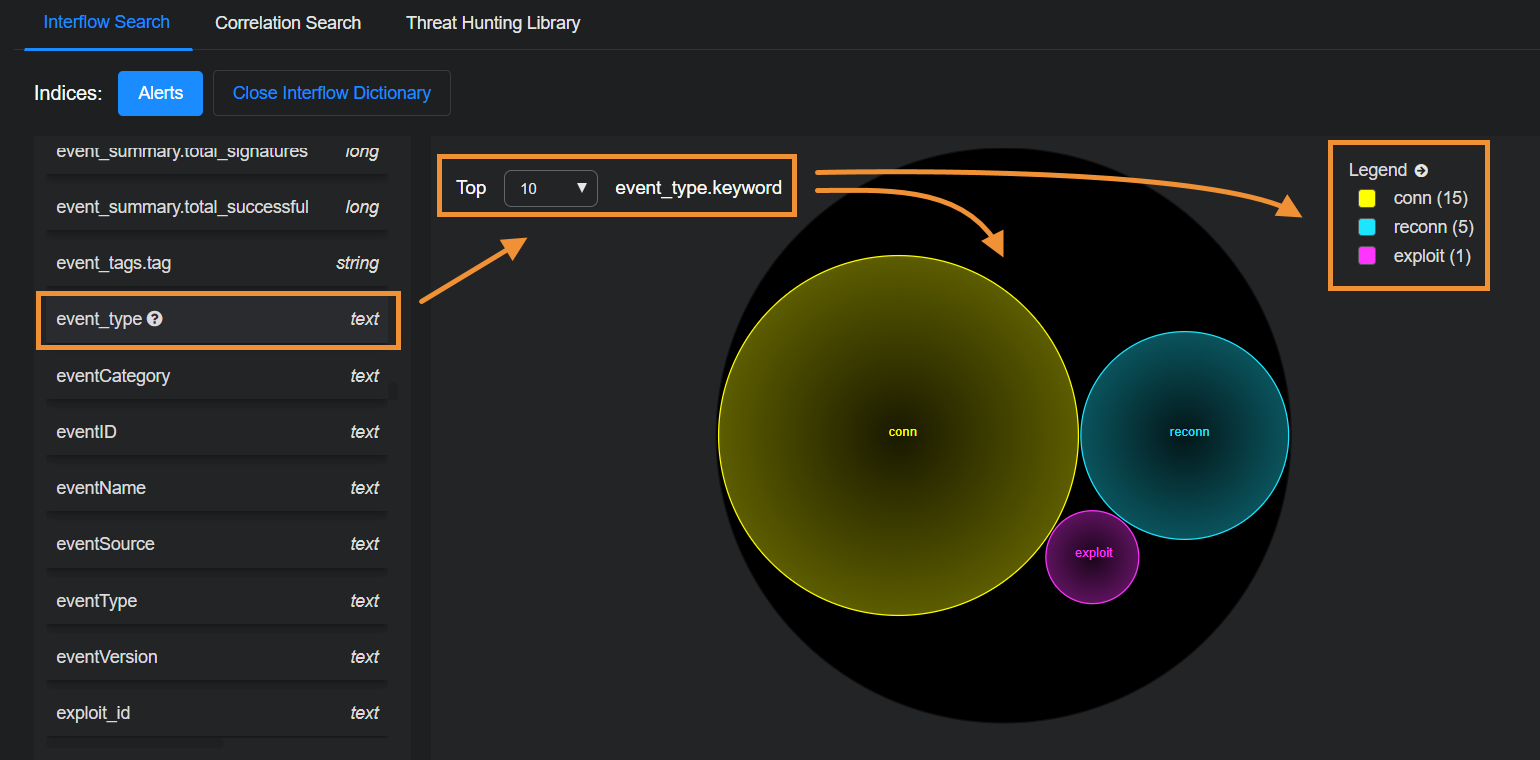
There has been one exploit from source IP addresses in an unknown country.
-
Find and select srcip. You can now see the IP addresses from which the exploit originated.
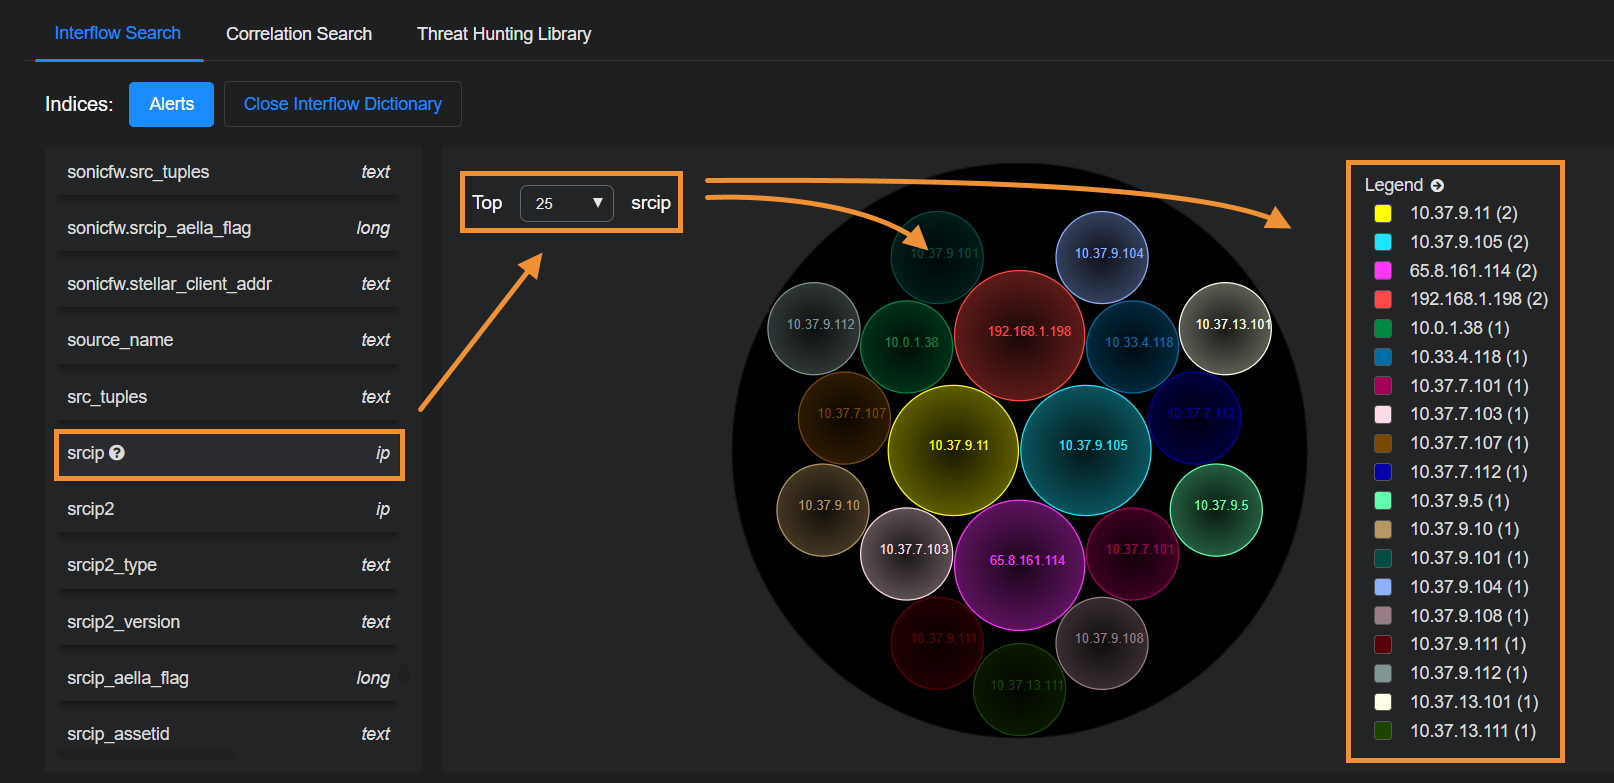
When you leave this page, any filters remain selected. So you can continue your threat hunting in other parts of Stellar Cyber.
Interflow Search Using the Table
The Interflow records table is at the bottom of the screen.
The Interflow records table is a very powerful threat hunting tool. Following are the things you can do to help you hunt down threats:
- Expand Columns to display a drop-down menu that lets you change the fields displayed in the table. Keep in mind that the default columns in the Interflow table change depending on the selected Indices at the top of the page.
-
Hover over a field and a set of options appears. Select to filter the results to include only that value. Select to filter the results to exclude that value.
-
Select More Info to see event details.
-
Select
 to cascade an entry in the Interflow table open and see the Interflow table for that event.
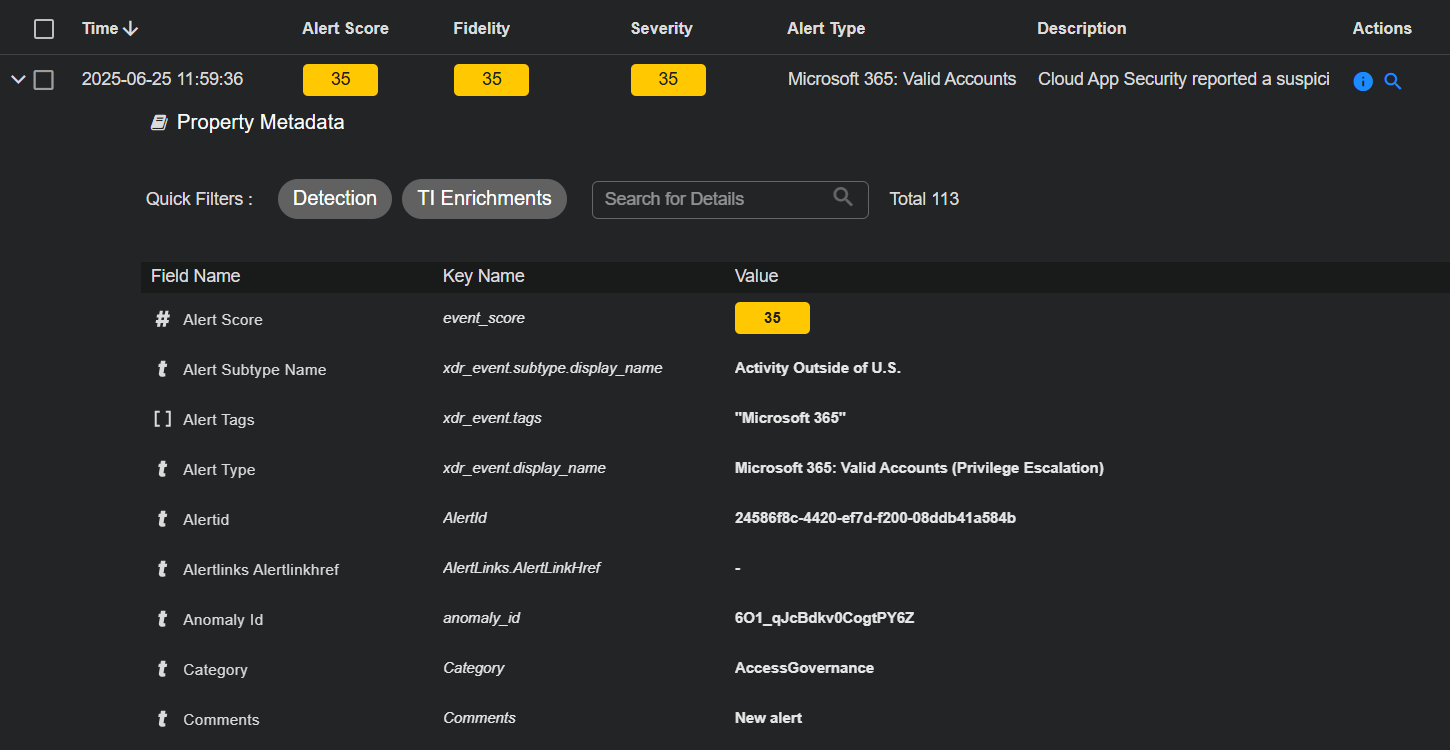
In the Interflow table you can perform standard table tasks. Most importantly, as illustrated below, each piece of Interflow data shown for an entry includes a consistent set of icons that let you perform one or more the following tasks, depending on the data displayed:
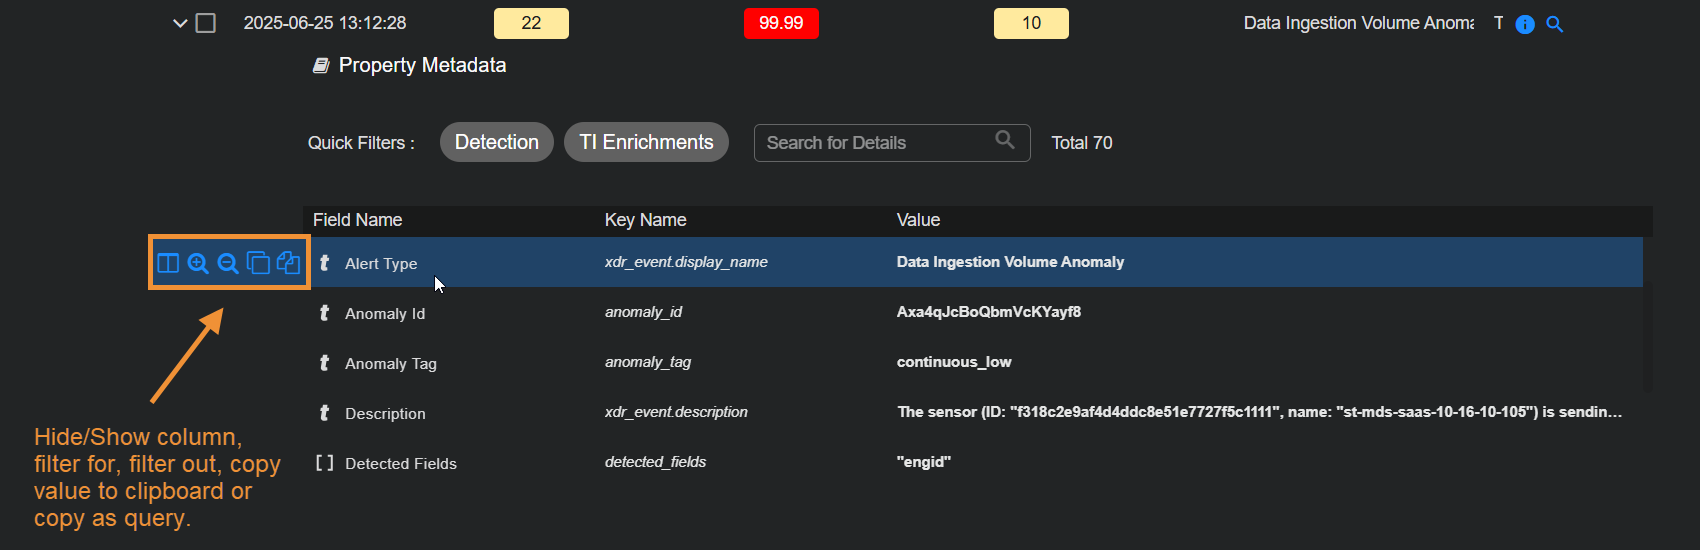
Hover your cursor over a cell to see icons that let you:
-
Show or Hide Column – Use this option to add the corresponding Interflow field as a column in the table. Adding data as a table column lets you sort on it, which can be useful when threat hunting.
-
Filter for – Filter the displayed results to include only entries with the matching type and value.
-
Filter out – Filter the displayed results to exclude entries with the matching type and value.
-
Copy value to clipboard – Copy the value to the clipboard for use elsewhere.
-
Copy as query – Copy a pre-built Lucene query that searches for related activity involving the field value. Use this query in tools like Threat Hunting or Search to investigate communications where the field value appears.
Select the check boxes to the left of each row to select records. After you select records, the following additional tools become available:
-
Add to Case – Select this button to add the event to an existing Case or create a new Case based on the event. Refer to Working with Cases for more information on working with Cases.
There are a maximum of 5,000 associated alerts per Case.
-
Add a Comment – Leave an explanatory comment to assist with further analysis.
-
Bulk edit controls let you change an event's status, associated tags, or assignee.
When you leave this page, any filters remain selected. So you can continue your threat hunting on other parts of Stellar Cyber.
Searching for Special Characters in the Source and Destination Reputation Columns
Stellar Cyber uses feeds from several threat intelligence providers (such as ET Pro, PhishTank, OpenPhish, abuse.ch, and others) as well as network traffic analysis to assign reputations. These reputations are visible in the Interflow as srcip_reputation and dstip_reputation, and in the event tables under the Source Reputation and Destination Reputation columns.
When Stellar Cyber populates these fields, it typically substitutes the ampersand ("&") character for the shorthand usage of "n" for "and" in the Interflow itself. For example, the reputation value of SpywareCnC from the Interflow is displayed in the user interface as Spyware C&C. There are other similar substitutions, as well (Peer-to-Peer for P2P).
Because of this substitution, you must be careful when copying and pasting data from the user interface to be used as search terms – make sure you search for the original value and not the version with the substituted version. The table below summarizes the substitutions:
|
Reputation Value in User Interface |
Reputation Value in Interflow (Search for This) |
|---|---|
| C&C | CnC |
| Spyware C&C | SpywareCnC |
| C&C DGA | DGA_CnC |
| DGA C&C Domain | DGA_CnC_domain |
| Peer-to-Peer C&C | P2PCnC |
| Mobile C&C | Mobile_CnC |
| Mobile Spyware C&C | Mobile_Spyware_CnC |
Correlation Search
You can use the Threat Hunting | Correlation Search page to hunt for correlations between events.

To visualize alert correlations:
-
Enter a name for the correlation query configuration.
-
Select a tenant or, if you're logged in to the root level, All Tenants.
-
Select your time range.
Note that you must supply dates for From and To to save a correlation query with an absolute time range.
-
Define a query or choose a saved query; for example create a new query called Reconn, which finds reconnaissance events.
-
Define a second query or choose another saved query; for example, a query that finds any security event.
-
Drag a line between the queries to define a relationship. In this example we selected both Same Source IP and Query 2 happened after query 1.
-
Continue adding queries by selecting the Add a query button until your correlation is complete.
-
Select Run.
A screen similar to the following visualizes the correlation between the alerts from each query.

If your correlation times out, you might be trying to retrieve too many records. Edit your queries and reduce the number in the Get xx records field.
You can save your visualization at any time.
Defining Relationships Between Queries
In a correlation search, you define relationships between two queries to determine how events from each query are related. Queries are visually arranged in a vertical stack, where the relationship appears between the two queries.
To configure a relationship, select the Edit icon on the relationship line between two queries. This opens the Define a Relationship dialog box.
The Commonly Used tab provides predefined relationships for common correlation scenarios. These options simplify correlation logic and do not require field-level configuration.
You can select one of the following relationships:
-
Same Source IP
Correlates events where both queries share the same source IP address.
-
Same Destination IP
Correlates events where both queries share the same destination IP address.
-
Source IP of Query 1 is equal to Destination IP of Query 2
Correlates events where the source IP from Query 1 matches the destination IP from Query 2.
-
Destination IP of Query 1 is equal to Source IP of Query 2
Correlates events where the destination IP from Query 1 matches the source IP from Query 2.
-
Query 2 happened after Query 1
Correlates events where events from Query 2 occur later in time than events from Query 1.
-
Query 1 happened after Query 2
Correlates events where events from Query 1 occur later in time than events from Query 2.
Creating a Custom Relationship Using the Advanced Tab
Use the Advanced tab when you need to define a custom, field-level relationship between two queries.
In the Advanced tab, select Add a relation to define how a field from Query 1 relates to a field from Query 2. When you add a relation, an operator list becomes available.
Each relation consists of the following elements:
-
A field from Query 1
-
An operator
-
A field from Query 2
You can add multiple relations to further refine how the two queries are correlated.
Advanced Relationship Operators
The Advanced tab provides the following operators:
-
equals
Correlates events when the values of the selected fields are exactly the same.
-
does not equal
Correlates events when the values of the selected fields are not the same.
-
greater than
Correlates events when the value from Query 1 is greater than the value from Query 2.
-
greater than or equal to
Correlates events when the value from Query 1 is greater than or equal to the value from Query 2.
-
less than
Correlates events when the value from Query 1 is less than the value from Query 2.
-
less than or equals
Correlates events when the value from Query 1 is less than or equal to the value from Query 2.
-
matches
Correlates events when all words in the value from Query 1 appear in the value from Query 2. The words do not need to appear in the same order and may be separated by other words.
-
does not match
Correlates events when not all words in the value from Query 1 appear in the value from Query 2.
-
matches any
Correlates events when at least one word in the value from Query 1 appears in the value from Query 2.
-
does not match any
Correlates events when none of the words in the value from Query 1 appear in the value from Query 2.
Notes:
-
In 6.4.0, the
containsanddoes not containoperators were replaced withmatches anyanddoes not match any. During upgrade to 6.4.0, most existing correlation rules usingcontainsordoes not containwere automatically mapped tomatches anyordoes not match any. However, some rules might have been mapped tomatchesordoes not matchinstead. Review and revalidate correlation rules created before upgrading to 6.4.0 to confirm they use the intended operator and produce expected results. -
When you select a time-based field such as
timestampin a custom relationship, an OFFSET (optional) control becomes available. OFFSET adjusts one timestamp relative to the other before the comparison is evaluated. You configure an offset by selecting a mathematical operator—+ (add), - (subtract), * (multiply), or / (divide by)—entering a numeric value, and selecting a time unit—s (seconds), m (minutes), h (hours), d (days), w (weeks), M (months), or y (years). To enter the numeric value, select the input area between the operator and the time unit. For example, using an offset of - 5 m for Query 1 with a less than relationship means events from Query 1 occurred five minutes before events from Query 2. You can express the same logic by applying an offset of + 5 m to Query 2 instead. OFFSET is useful when correlating events that are expected to occur within a defined time window rather than at the exact same time.
Example: Defining a Custom Relationship Between Using matches any
In this example, you create a correlation search to identify hosts where malware-related alerts are followed by authentication activity that may indicate suspicious user behavior. The first query searches the Alerts index for malware-related alerts, and the second query searches the Windows Events index for authentication and login events recorded on Windows systems. You then define a custom relationship between the two queries so the correlation search returns results only when both queries involve the same host and share at least one common word between alert tags and event descriptions. This lets you focus your investigation on systems where malware-related alerts are followed by relevant authentication activity.
-
In the Correlation Query Configuration canvas, enter a Query Name for the correlation, (for root-level users and partners) choose All Tenants or an individual tenant name, and then define either a relative or absolute Time Range.
-
In the Configure section, select the Edit icon for New query in the uppermost rectangular area.
The Query Builder opens.
-
Choose Alerts for the Index and then select New Query.
-
Enter the following to define the general settings of the query:
Name: Enter a descriptive name for Query 1 such as
Malware Alerts.Description: Enter a meaningful note about the query for future reference.
-
Select + Add condition and enter the following:
Field:
categoryOperator:
containsValue:
malware -
Select + (Add icon) to add additional values to the same condition and enter
ransomwareandtrojan.These values are evaluated with an OR relationship.
-
Select Save to save the configuration and then select Submit.
-
Optionally add fields to extract for the correlation and then select Submit.
This completes the configuration for Query 1 in the correlation search.
-
Select the Edit icon for New query in the lowermost rectangular area.
The Query Builder opens again.
-
Choose Windows Events for the Index and then select New Query.
-
Enter the following to define the general settings of the query:
Name: Enter a descriptive name for Query 2 such as
Authentication Events.Description: Enter a meaningful note about the query for future reference.
-
Select + Add condition and enter the following:
Field:
categoryOperator:
containsValue:
login -
Select + (Add icon) to add additional values to the same condition and enter
log in,authentication,logon, andlog on.These values are evaluated with an OR relationship.
-
Select Save to save the configuration and then select Submit.
This completes the configuration for Query 2 in the correlation search.
-
In the correlation search canvas, draw a vertical line connecting Query 1 to Query 2.
The Define a Relationship dialog box appears.
You can return to the Define a Relationship dialog box later by selecting the Edit icon on the line.
-
Select the Advanced tab and then select Add a relation.
-
Configure the first relation to correlate activity on the same host:
Field (Query 1):
host_nameOperator:
equalsField (Query 2):
host_name -
Select Add a relation again to further refine the correlation:
Field (Query 1):
event_descriptionOperator:
matches anyField (Query 2):
event_descriptionThe correlation search returns results only when both queries involve the same host and share at least one common word between alert event descriptions and Windows event descriptions.
-
Select Submit to save the relationship.
Loading Saved Correlations with Absolute Time Ranges
When loading a saved correlation with a Time Range set to absolute, Stellar Cyber automatically changes the time setting to a relative time of the last five hours. This prevents you from accidentally using a correlation with a time range set far in the past.
Using Correlation Queries to Detect Short-term User Accounts
Stellar Cyber can detect user accounts that are spun up for short periods of time and then deleted. Attackers often use these "short-term accounts" to gain access to sensitive systems and data and carry out malicious activity on the network. They then quickly delete the accounts. Using short-term accounts minimizes chances of being identified, makes it harder for forensic analysis to locate the origin of their activity, and reduces the risk that user behavior analytics can establish a baseline and detect anomalous activity patterns. To detect the creation and deletion of these short-term accounts, you must first define a query that correlates these two events—the creation of a user account and its deletion—within specific time periods. After that, you can manually run the correlation query whenever you want to check if short-term user accounts were created.
-
Select Threat Hunting | Correlation Search.

-
To begin creating a new correlation query configuration, enter a Query Name such as Short-term Account Detection.
-
Choose a specific tenant or All Tenants.
You can ignore Time Range because Prior time range, which you’ll set in the individual queries, takes precedence over it.
-
In the Configure section, select the Edit icon on the upper New query to edit it.
-
Choose the index for which you want to create the correlation query configuration; for example, Windows Events.
-
Choose an existing query or select New Query to define one.
If you select New Query, enter a Query Name such as AccountDeletion.
Select Add condition, enter settings for Field, Operator, and Value, and then Save. For example: Field = event_id, Operator = is, and Value = 4726. (4726 is the event ID in Windows events logs for account deletion.)
The Field and Value settings do not have to already be in the lists of choices that Stellar Cyber displays. You can type in new settings.
-
Set Get 100 records, toggle on Global time range override, set Check the last 5 minutes, leave the rest at their default settings, and then Submit.
Global time range override is an optional setting that lets you set a custom time range for the query.
The query checks records in the Windows Events index for account deletions within the past five minutes and gets up to 100 account deletions detected during this time. If you notice that the query often returns 100 records, consider increasing the maximum so that you don’t miss any.
The Extract fields at the bottom of the correlation query configuration panel control which fields Stellar Cyber displays on the Results tab after running the queries.

-
Select the Edit icon on the lower New query to edit it.
-
Choose the same index you used for the upper query.
In the example here, it’s Windows Events.
-
Choose an existing query or select New Query to define one.
If you select New Query, enter a Query Name such as AccountCreation.
Select Add condition, enter settings for Field, Operator, and Value, and then Save. For example: Field = event_id, Operator = is, and Value = 4720. (4720 is the event ID in Windows events logs for account creation.)
-
Set Get 1 records, toggle on Global time range override, set Check the last 2 days, leave the rest at their default settings, and then Submit.
The query checks records in the Windows Events index for account creations within the past two days. For each user account created during the last two days that correlates to an account deleted in the past five minutes, Stellar Cyber generates one record.

-
Click-drag from the upper query (AccountDeletion) to the lower query (AccountCreation) to draw a line between them. Define two relationships between the queries and then select Submit:
-
On the Commonly Used tab, select Query 1 happened after Query 2.
-
On the Advanced tab, enter username (AccountDeletion) equals (Operator) username (AccountCreation).
Instead of
username, enter userid or whatever other field you use to identify user accounts.
-
-
Preserve your configuration by selecting Save.
-
Begin checking for short-term user accounts by selecting Run.
-
To run the correlation query configuration that you made at a later time, select Threat Hunting | Correlation Search | Load Saved, choose it in the Select Pre-Defined Template list, and select Submit and then Run.
-
To see the results of the correlation query, select the Results tab.
By clicking the extract fields in the left column, you can change the data displayed in the Results tab.
Grouping Results in Correlation Queries 
The grouping feature in correlation queries lets you organize data into logical groups based on shared values in a specific field. By reducing large volumes of raw data into meaningful groups that are easier to analyze and act upon, you can more easily uncover patterns, focus on anomalies, and perform targeted investigations. In short, grouping enables you to do the following:
-
Identify Patterns: Detect behaviors like repeated login failures from the same IP address or file downloads from a particular user.
-
Highlight Anomalies: Groups with unusually high or low event counts might indicate suspicious activity (e.g., brute force login attempts or data exfiltration).
-
Simplify Investigations: Reduces the dataset to high-value clusters, allowing you to focus on what matters.
Settings

Calculation type: Specify how groups are ranked.
-
Top: Retain groups with the largest counts; for example, source IP addresses with the highest login failures.
-
Bottom: Retain groups with the smallest counts; for example, devices with the least activity.
Field to calculate on: Specify the field used to group Interflow records. Each unique value of this field represents a group. Here are a few example fields:
-
srcip: Group Interflow records by source IP address. -
userPrincipalName: Group records by user ID. -
MachineId: Group records by device ID.
Size: Define the maximum number of groups to keep after ranking them. If the total number of groups exceeds this value, only the top or bottom groups are kept based on the calculation type. For example, if you set Calculation Type as Top and Size as 10, Stellar Cyber retains the top 10 groups.
Threshold Condition: Filter groups based on the total number of Interflow records in each one so that only groups meeting the condition are retained. Choose one of the following options:
-
is greater than or equal to: Retain groups with at least the specified number of records.
-
is less than or equal to: Retain groups with at most the specified number of records.
For example, you might set a threshold condition that is greater than or equal to 10 to retain groups with 10 or more Interflow records so that only groups with a significant number of records are kept for analysis.
Examples
In this example, you want to identify source IP addresses (srcip) responsible for a series of excessive login failures followed by a successful login.
Although the Alerts and Traffic indices and the login_result field are used in this example, you can also use other indices and fields to detect login results.
-
Navigate to Threat Hunting | Correlation Search and enter the following:
Query Name: Enter a name for the correlation query, such as
Possible Brute Force Logins.Tenant: Choose the tenant or tenants to which the query applies.
Time Range: Choose relative or absolute and enter a time range.
-
In the Configure section, select the New query edit icon for the first query.
The Query Builder opens.
-
Select Traffic for the Index and then select New Query.
-
Enter the following, and then Save the query configuration:
Name: Enter a descriptive name such as
Login failures.Description: Enter a descriptive note such as
Search for excessive login failures.Add condition: Select and then enter the following:
-
Field:
login_result -
Operator: is
-
Value:
failure
-
-
Enable Grouping and enter the following:
-
Calculation type: Top (This keeps the top groups with the highest number of Interflow records.)
-
Field to calculate on:
srcip(This creates groups based on unique source IP addresses.) -
Size: 5 (This keeps the top five groups with the most records.)
-
Threshold Condition: is greater than or equal to
10(This checks the top five groups and then retains only those groups with at least 10 records. For example, if the top five groups have 14, 13, 10, 7, and 6 records respectively, after Stellar Cyber applies the threshold condition, it retains the three groups with 14, 13, and 10 records. Stellar Cyber then keeps the most recent record in each of these three groups and uses it to query if there’s been a successful login from the same source IP addresses and if it occurred after all the failed login attempts.)
-
-
Configure any other settings that you want to include in the query and then Submit it.
-
Select the New query edit icon for the second query.
The Query Builder opens again.
-
Select Alerts for the Index and then select New Query.
-
Enter the following, and then Save the query configuration:
Name: Enter a descriptive name such as
Login success.Description: Enter a descriptive note such as Search for successful logins.
Add condition: Select and then enter the following:
-
Field:
login_result -
Operator: is
-
Value:
success
-
-
Configure any other settings that you want to include in the query and then Submit it.
-
Click or tap and drag a line between the two queries, select Same Source IP and Query 2 happened after Query 1, and then Submit the relationship.

-
Save the correlation query to reuse later, and then Run it.
Stellar Cyber displays the results of the query on the Results tab next to the Configure tab.
The complete correlation query configuration has been omitted to focus on the Grouping configuration.
In short, the correlation query contains one query that identifies user accounts with a high volume of events within a given time window. The second query examines logs for unusual or suspicious behaviors (failed logins, file access anomalies, access from new devices) or activity from unusual geolocations or unusual IP addresses. The two queries are linked together by the same source IP address.
If you’re concerned that some user accounts might be compromised and want to analyze accounts with excessive activity, you can search for these accounts and then group returned Interflow records by userPrincipalName. To do this, you might configure Grouping settings for the first query like this:
-
Calculation type: Top (This keeps the top groups with the highest number of Interflow records.)
-
Field to calculate on:
userPrincipalName(This creates groups based on unique user names.) -
Size: 3 (This keeps the top three groups based on username.)
-
Threshold Condition: is greater than or equal to
20(This retains only groups with at least 20 records.)
Stellar Cyber organizes groups of records by userPrincipalName, only retaining the top three groups with 20 or more records. This helps focus on user accounts that might be compromised.
Threat Hunting Library
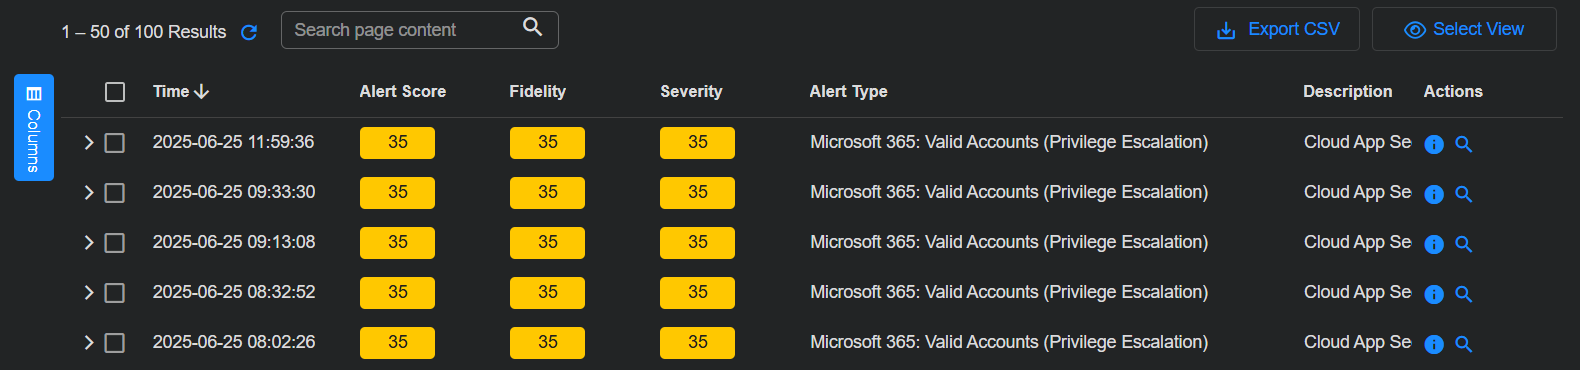
When you select the Threat Hunting | Threat Hunting Library tab, an overview page appears showing the different alert types in individual tiles. Each tile represents one alert type, with the number in the box showing the total count of alerts of the corresponding type that were detected. Clicking on tile box selects that alert type and displays the data.
By default, the Threat Hunting Library only displays tiles for alert types that are populated with alerts. As illustrated below, you can use the Show all views option to toggle the display between showing all alert types and only those populated with alerts.
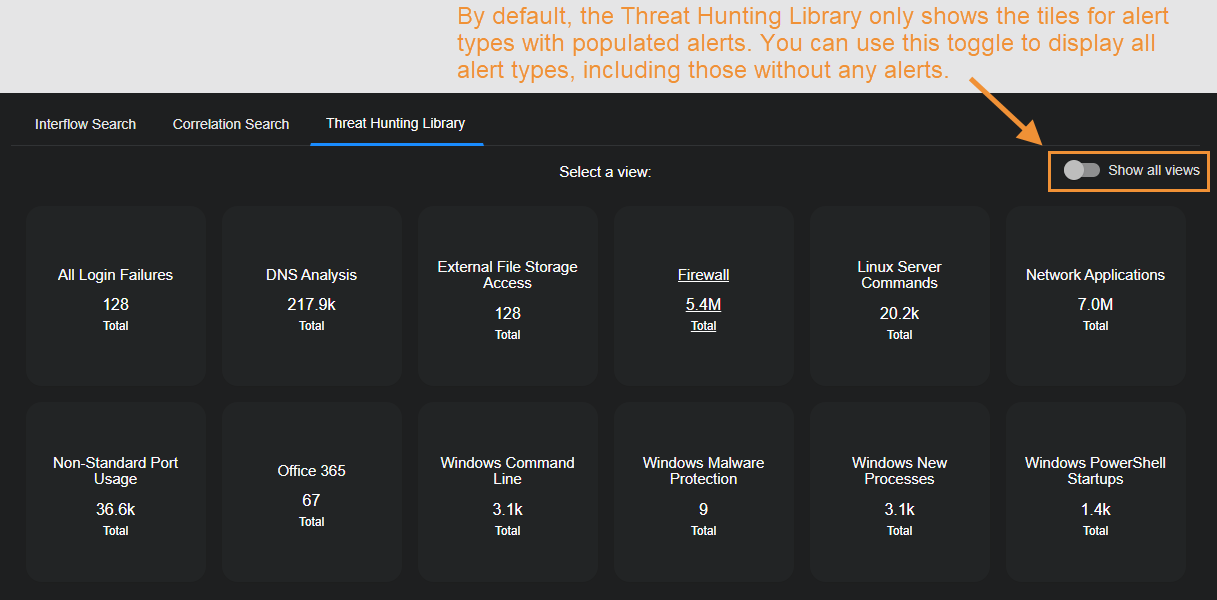
To choose a different alert type, click the Threat Hunting Library tab again.
The top half of the Threat Hunting Library page starts with a description of the alert type selected and several actions you can perform on this dashboard:
-
Edit
-
Clone
-
Export
See the Dashboard Actions page for details on each action. The number and composition of each graphic and its associated table is dependent on the alert type. The following image has an example.
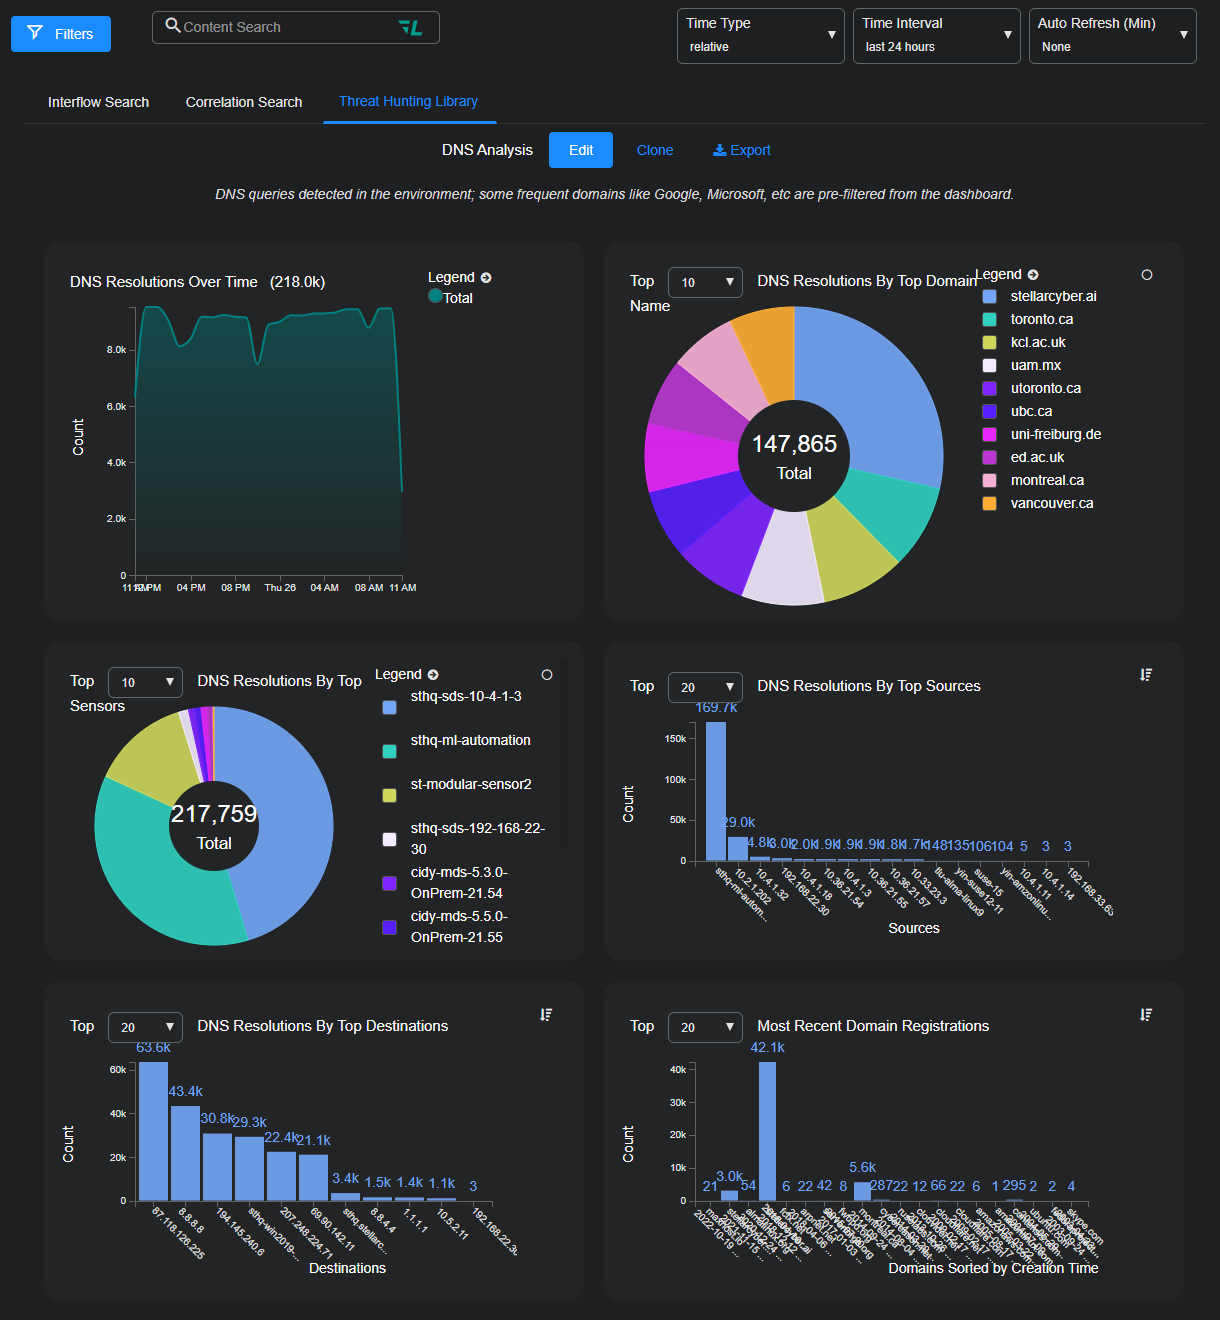
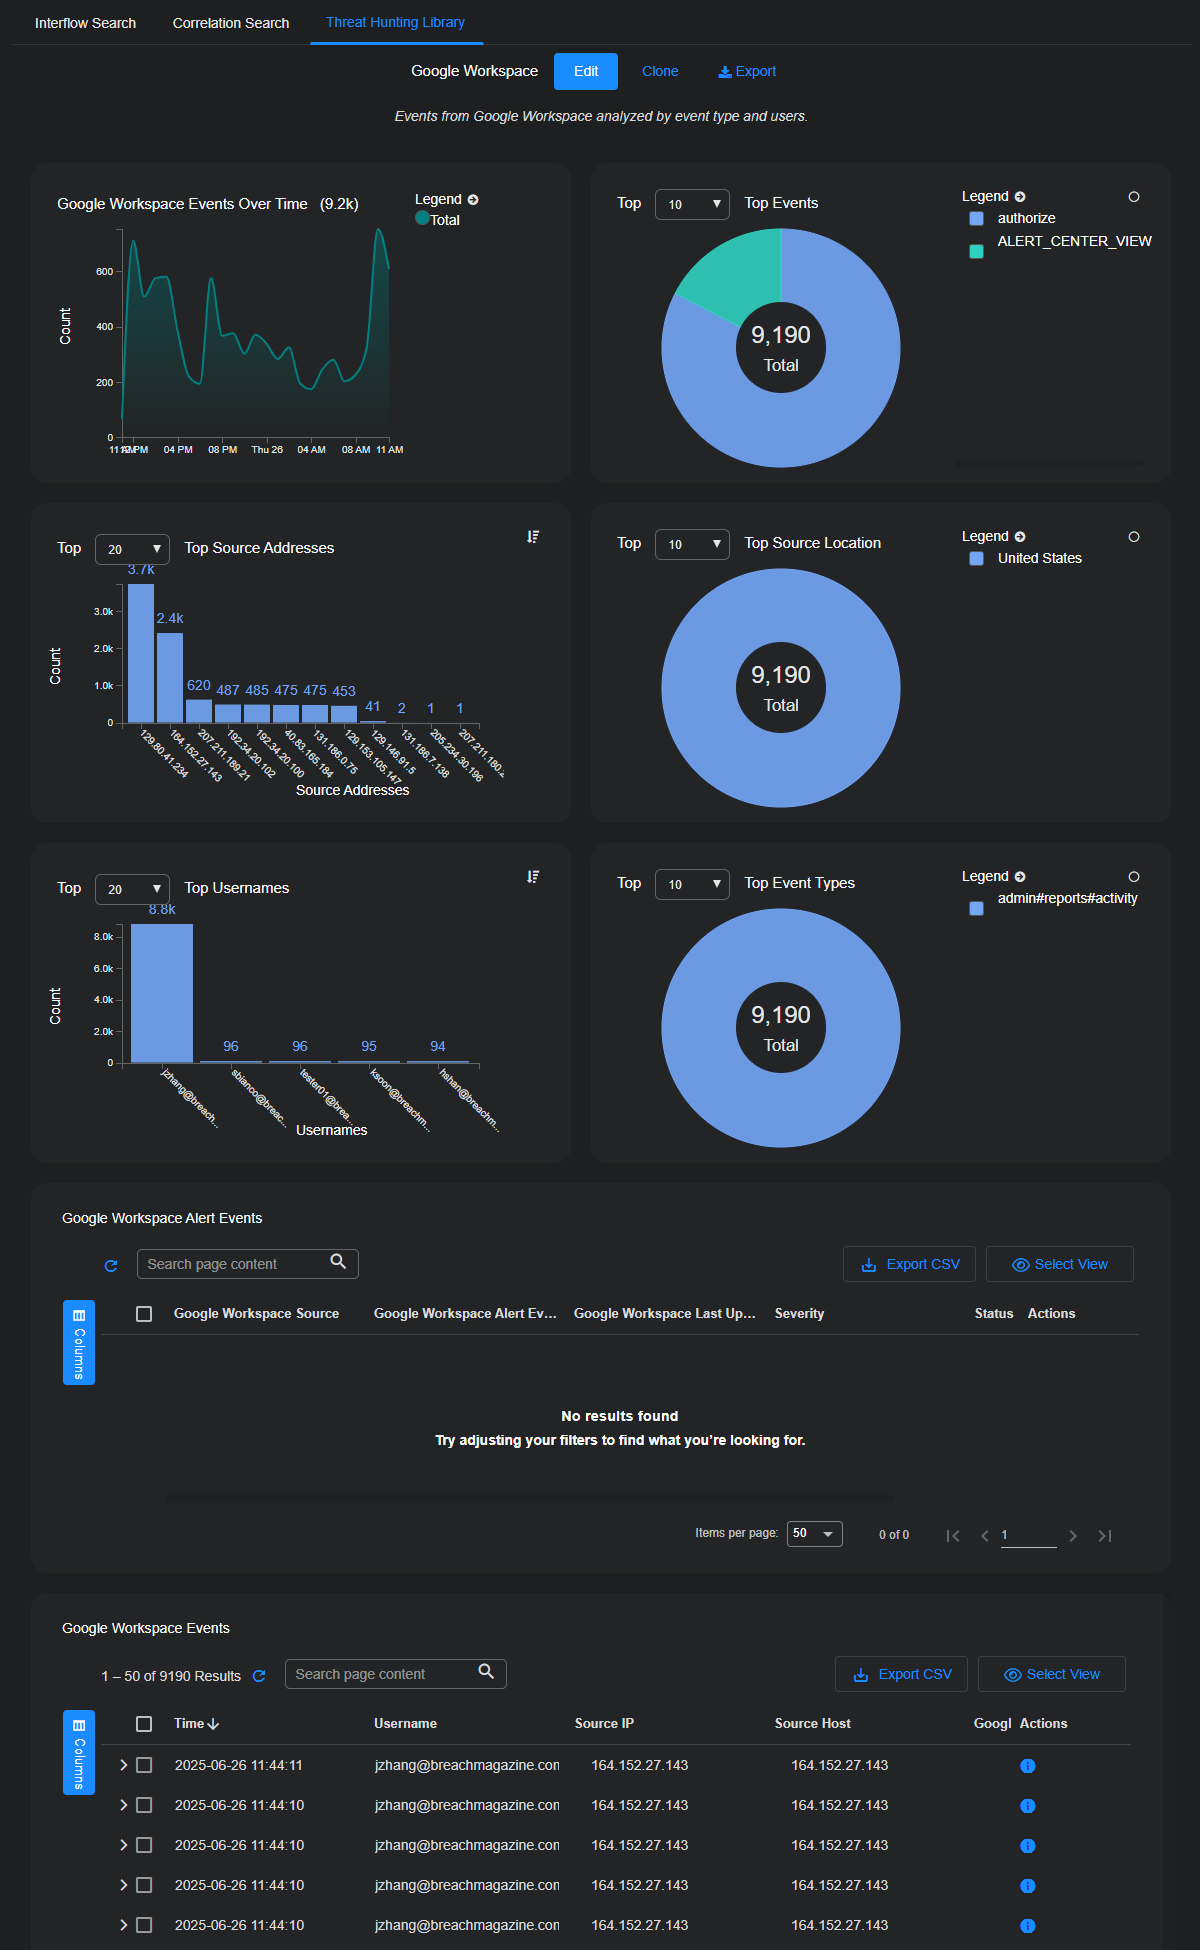
Below the charts, one or more data tables may be displayed. Again, the type of tables and their associated columns change depending on what is relevant to the event type. Example:
-
For DNS Analysis, the tables are Changed Domain to IP Resolutions, and Top DNS Resolution Search Results.
-
For Google Workspace, the tables are Google Workspace Alert Events and Google Workspace Events.
Scroll the entire Threat Hunting page to ensure you are seeing all offered information.
Each row provides an overview of each event. Select the check boxes to the left of each row to select records. You can also assign security-related events to Cases or create a new Case based on one or more alerts.
Only security-related events can be added to Cases. The Add to Case button is not available when a non-security event is selected.
To see details about an alert, select More Info at the far right of the record. The Details panel appears with multiple sections: Key Fields, Cases, Details, JSON, and Actions.
-
The Key Fields section presents a selection of the more commonly referenced key-value pairs that constitute the Interflow record.
-
The Cases section displays a table of cases with which the alert is associated.
The Details panel displays all the key-value pairs in the Interflow record and provides quick filters and search fields to help you quickly find the information you're looking for.
The JSON section presents the same information as in the Details section but in JSON format.
In the Actions section, you can tag or comment on the event, trigger an email, or take firewall action.
-
See Using Event Details for more information on working with events.
-
See Using Tables for more information on working with tables.
