Company Trends
The Visualize | Predefined | Company Trends page provides a snapshot of overall event and risk score trends. The page presents information in three ways:
-
Charts depicting trends over time
-
Highlights for that time period
-
Summaries of the XDR Kill Chain events.
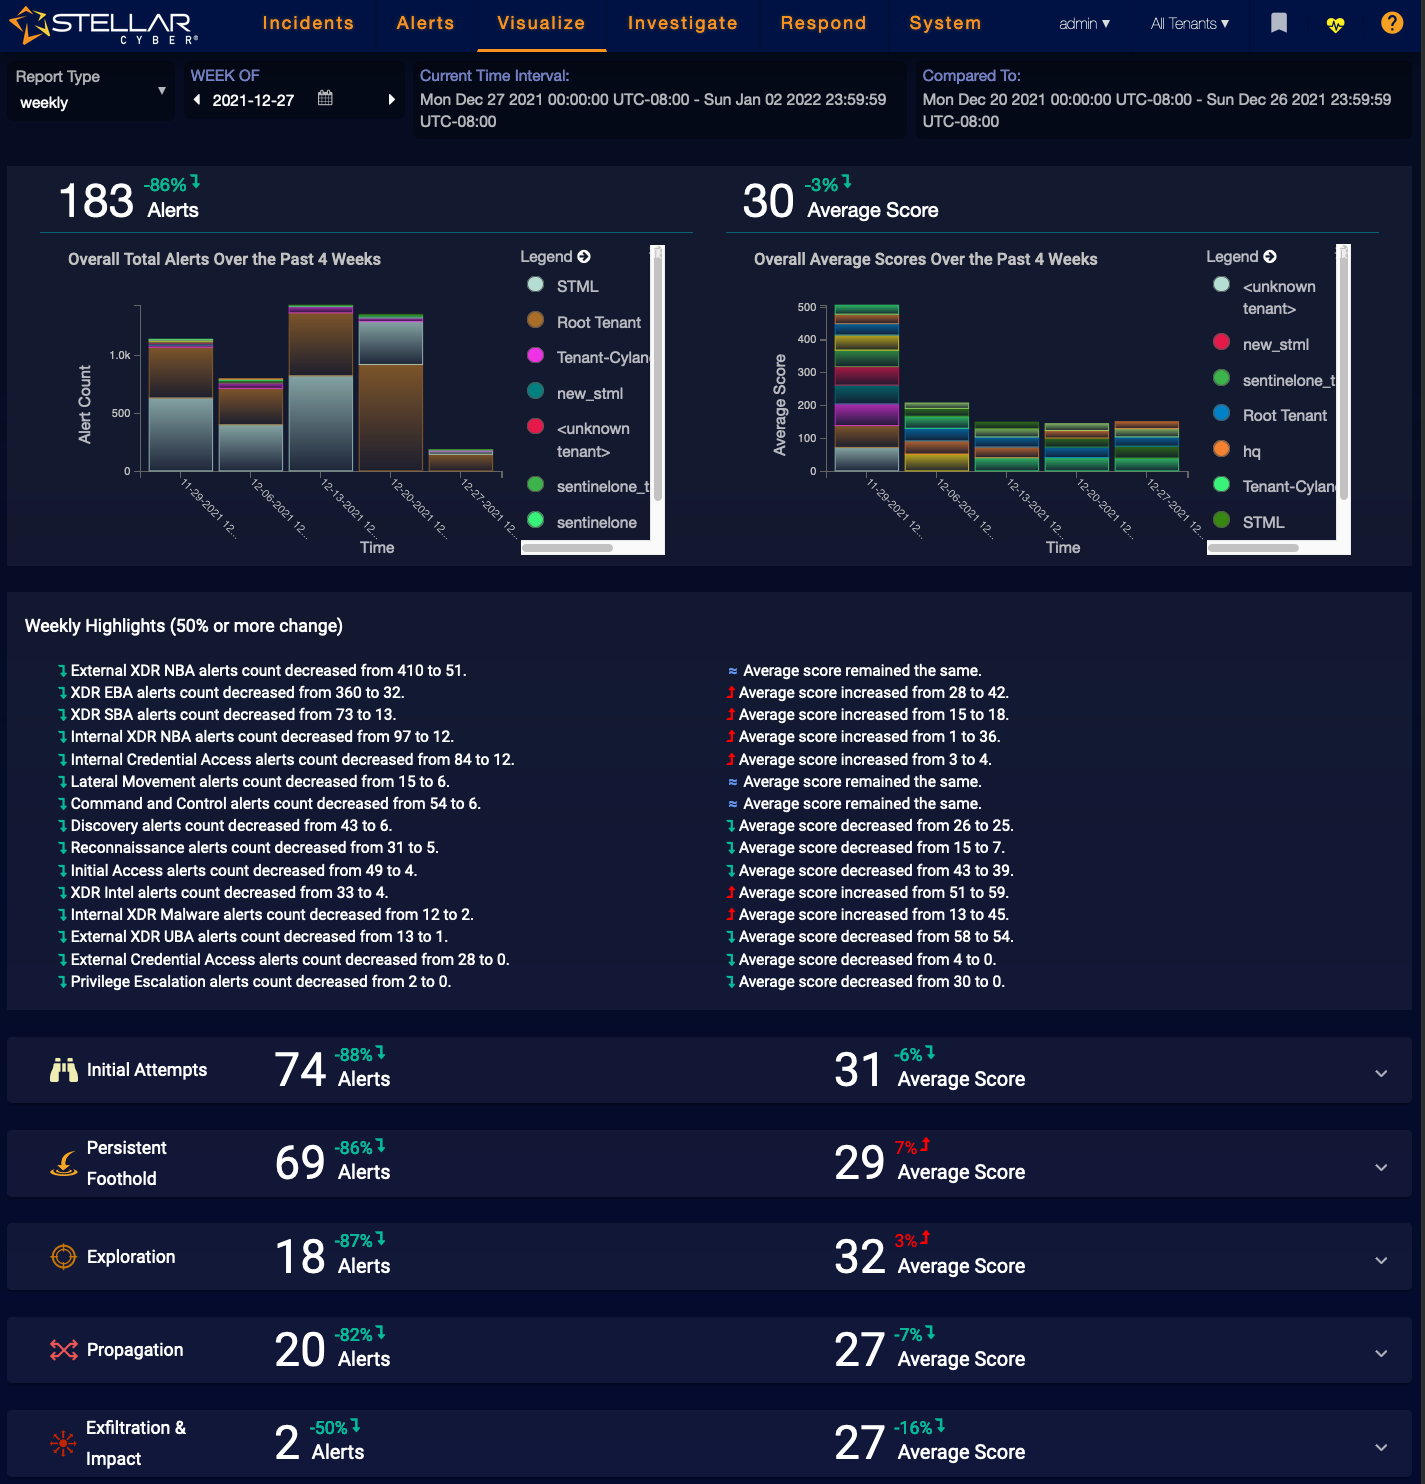
Two graphs at the top of the page display the trends over the time period specified. You can use the REPORT TYPE drop down to choose from the options listed below, and can use the calendar to the right of the report type to adjust the time period.
- daily—Displays daily data for the last week. This is the default period.
- weekly—Displays weekly data for the last month.
- monthly—Display monthly data for the last three months.
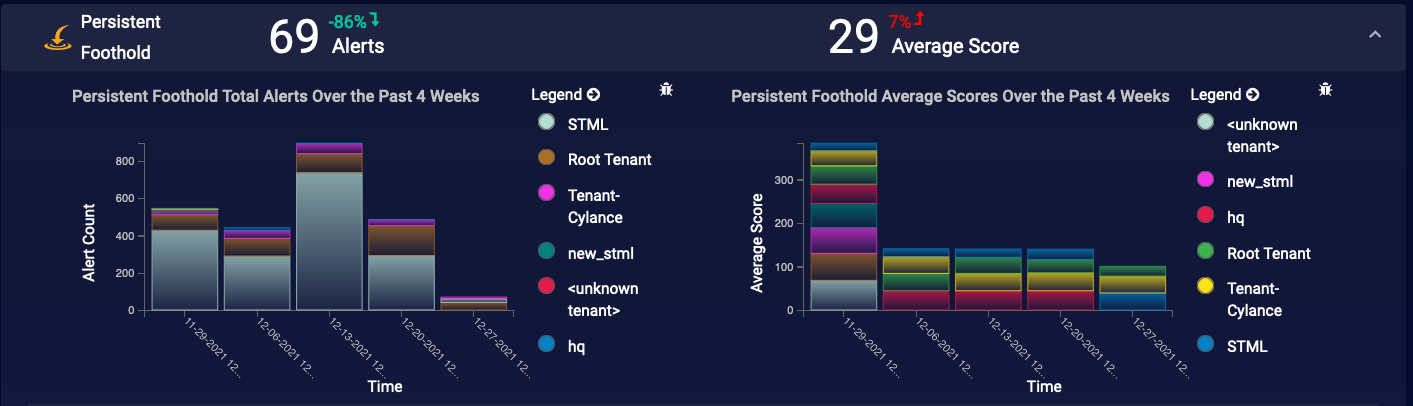
Click on the Kill Chain rows to expand details for those sections.