System Status
You can see the System Status:
-
from Visualize | Predefined | System Status
-
by clicking in the upper right corner of the screen
The provides a quick indication of the health of the system:
-
indicates that all components are healthy
-
indicates that at least one component is yellow and should be monitored
-
indicates that at least one component is red and needs immediate attention
This page gives you an overview of the health of the system. You cannot take any actions on this page.
Sensor Health
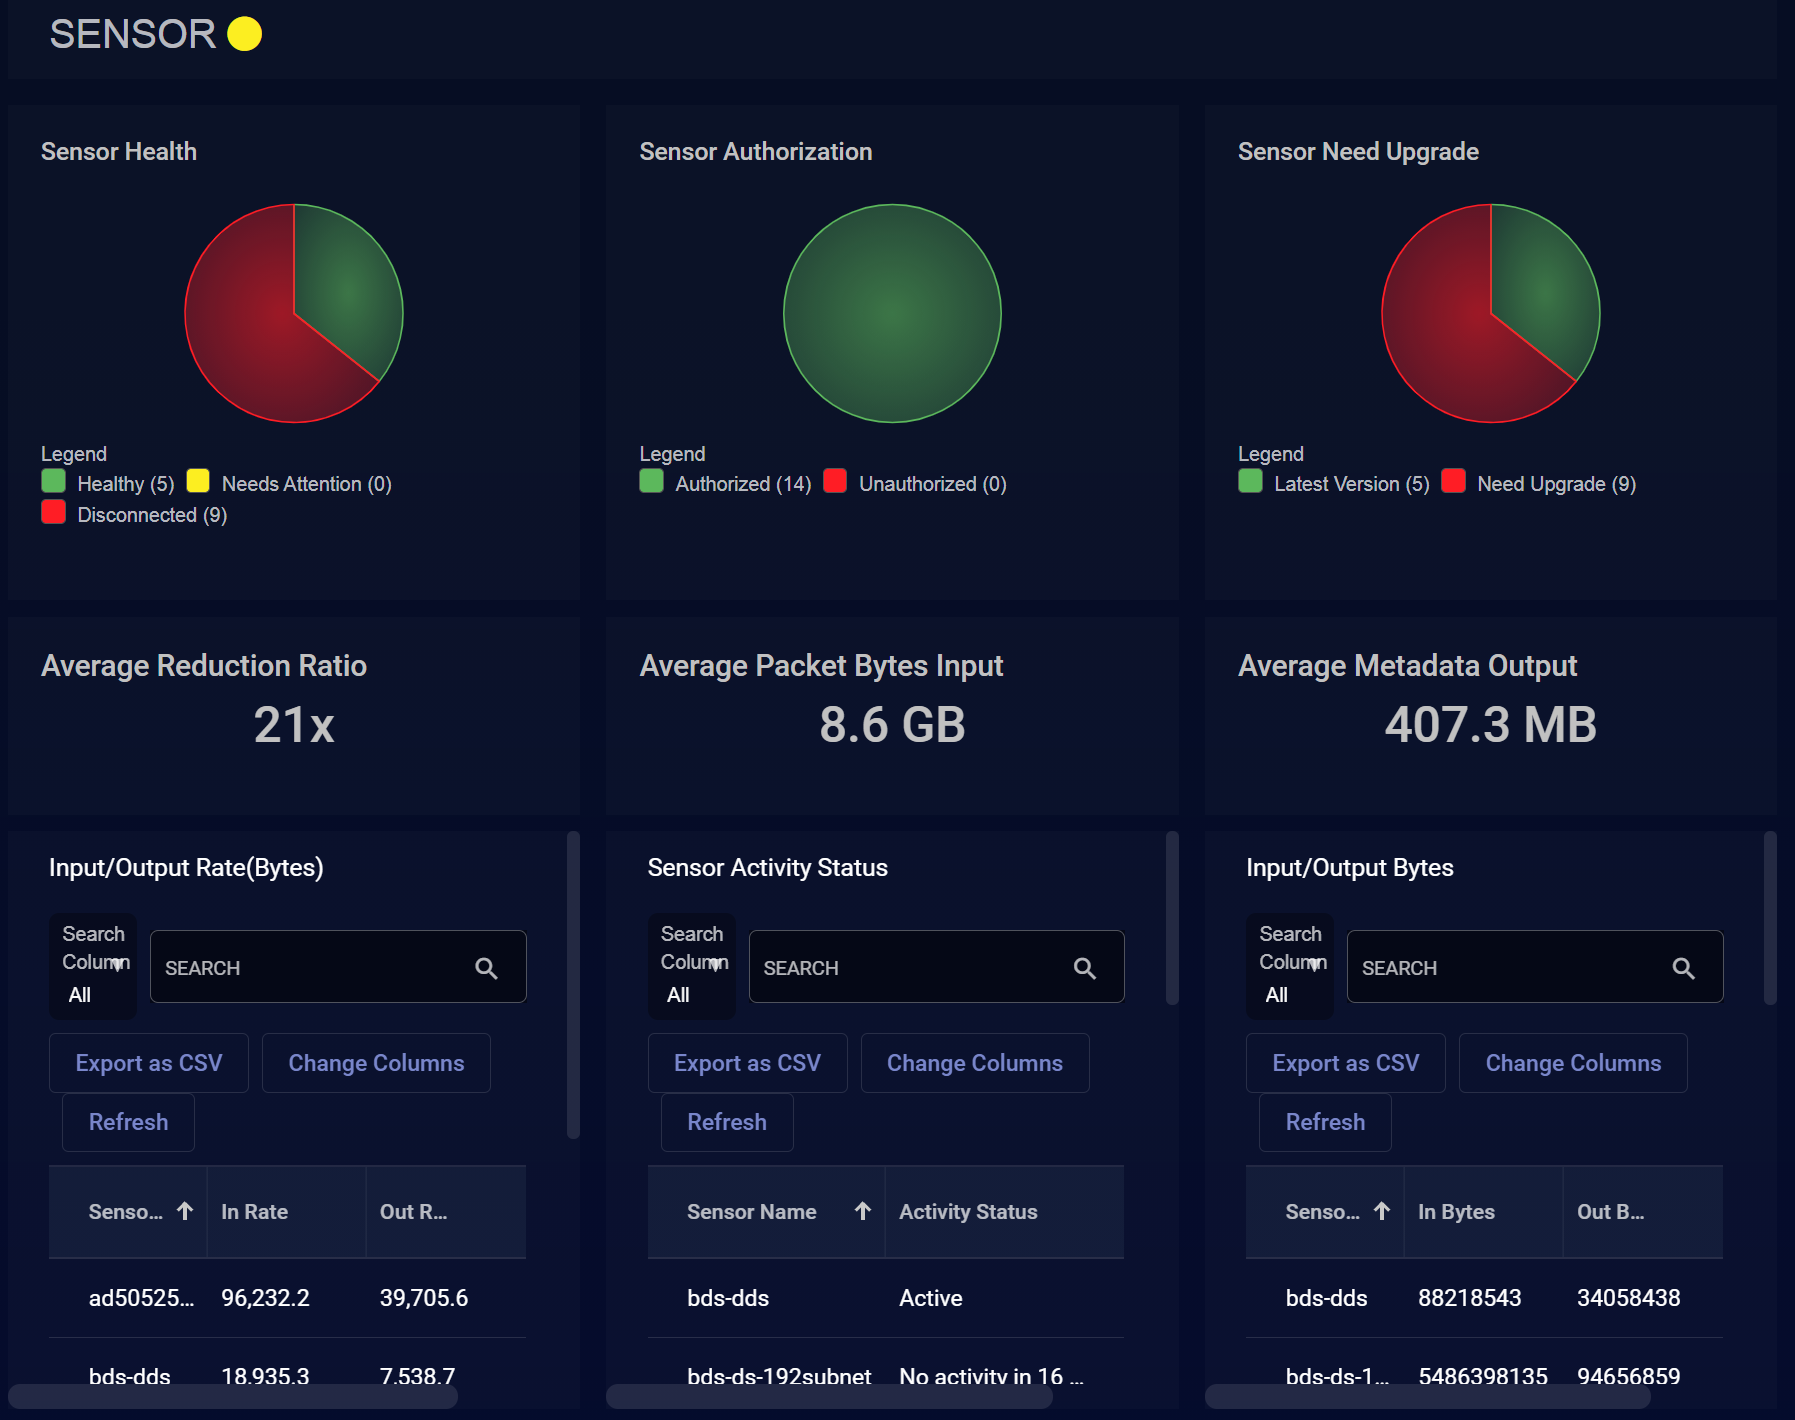
The nine sensor-related components are:
-
Sensor Health—the count of all sensors, indicating which are healthy, needing of attention, or disconnected.
-
Sensor Authorization—the count of sensors and how many need authorization
-
Sensor Need Upgrade—the count of sensors and how require a software upgrade..
-
Average Reduction Ratio—the amount of data in bytes that the sensors ingest divided by the amount they transmit in bytes. This figure is an average; many sensors will have much higher reduction ratios individually.
-
Average Packet Bytes Input—the average amount of data seen by sensors (total bytes received divided by the count of sensors.)
-
Average Metadata Output—the average amount of data sent by sensors (total bytes transmitted, divided by the count of sensors)
-
Input/Output Rate —the input and output rate of sensors in bits per second.
-
Sensor Activity Status—the most recent activity status for individual sensors.
-
Input/Output Bytes—the total input and output byte count for each sensor for the given.
For operations related to sensors, see the Sensor Overview page.
Data Analyzer Health
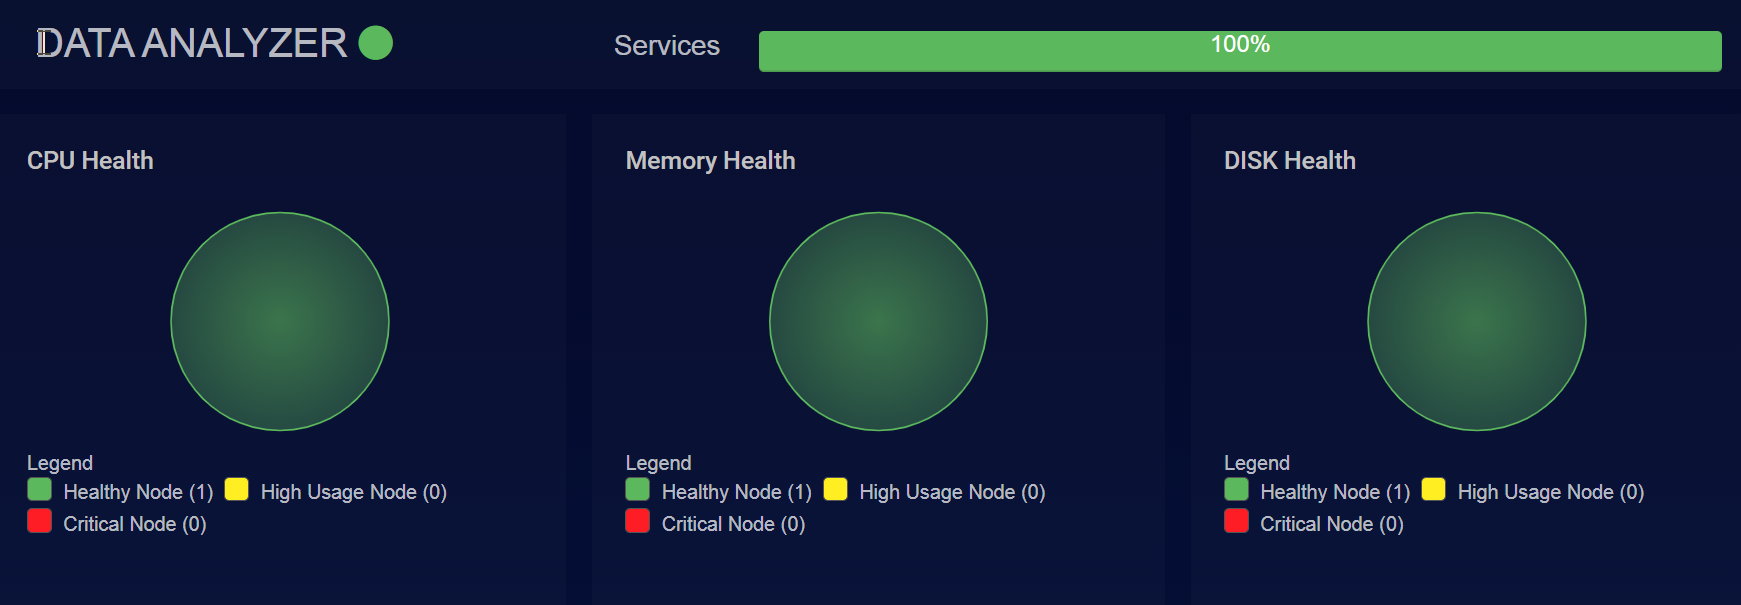
If the chart is green, the DA is healthy.
If the chart is yellow, the DA is either misconfigured or stressed, with one or more of the following:
-
a node using more than 91% of memory
-
a node using more than 79% CPU
-
batch processing time more than 10 seconds
If the chart is red contact Stellar Cyber support. The DA cannot process data, is completely overloaded, or is disconnected from the DL, with one or more of the following:
-
a node using more than 97% of memory
-
a node using more than 95% CPU
-
batch processing time more than 10 seconds for more than 5 minutes
-
no connection for more than 5 minutes
-
75% of disk space filled
Data Lake Health
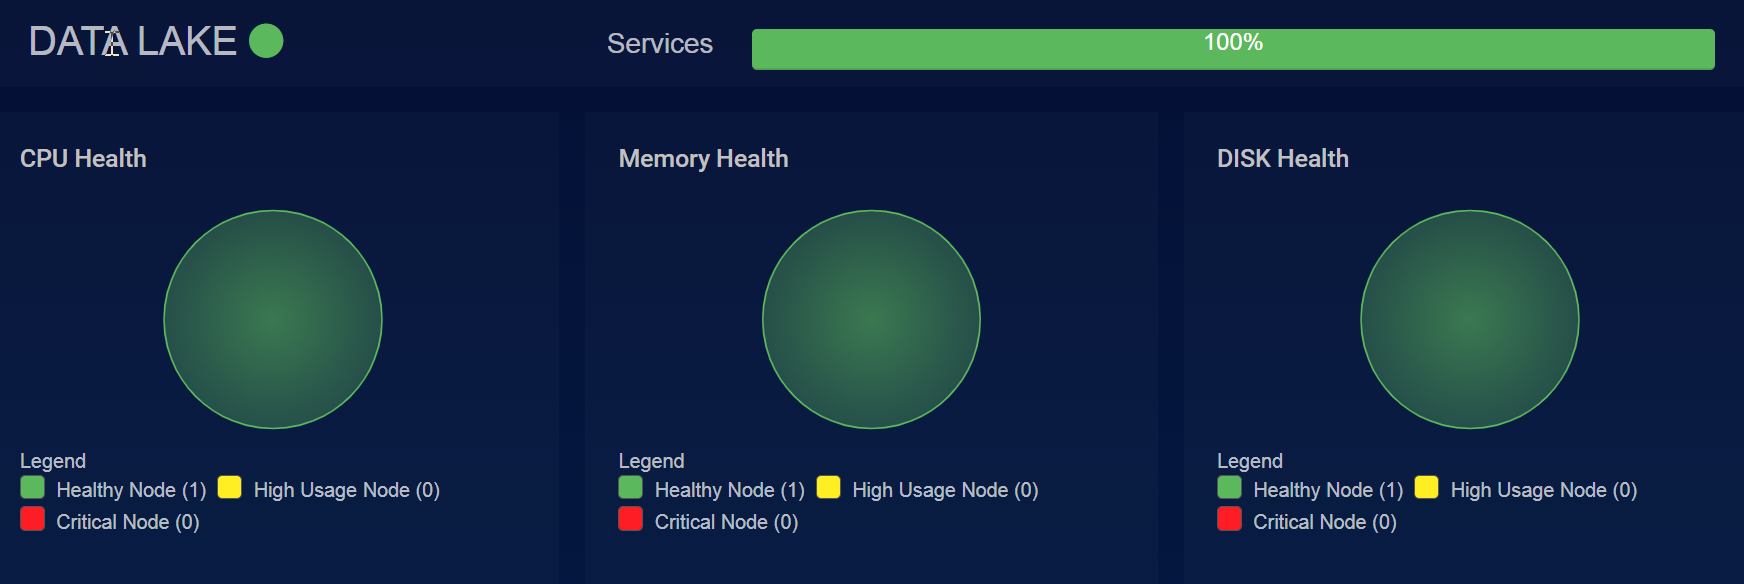
If the chart is green, the DL is healthy.
If the chart is yellow, the DL is either misconfigured or stressed, with one or more of the following:
-
a node using more than 91% of memory
-
a node using more than 79% CPU
-
an Elasticsearch node has memory usage more than 95%
-
the number of bulk rejections increases for 15 minutes
-
any index mapping increases to more than 90% of the field limit
-
80% of disk space filled
-
data cannot be written to an index
-
shards are slightly to heavily imbalanced in their distribution across DL worker nodes
-
an unexpected index is found in tomorrow's data, including a date format instead of just a timestamp

-
no aliases were created for a specified index type in tomorrow's data
If the chart is red contact Stellar Cyber support. The DL cannot process data, is losing data, or has a component completely offline, with one or more of the following:
-
a node using more than 96% of memory
-
a node using more than 94% CPU
-
an Elasticsearch node is out of memory
-
any index mapping reaches the field limit
-
90% of disk space filled
-
current data cannot be written to an index
-
Elasticsearch has been down
-
cold storage is offline
-
if the system and data partitions are different partitions and the system partition is filled more than 75%
-
shards are extremely imbalanced in their distribution across DL worker nodes
-
an unexpected index is found in today's data, including a date format instead of just a timestamp
-
no aliases were created for a specified index type in today's data
Contact Stellar Cyber support for assistance in addressing shard/index imbalances across DL worker nodes. You may be able to enable automatic shard rebalancing from the CLI to address the issue (set mode shard_balance enable/disable). Note that if shard rebalancing is enabled, the DL appears in yellow in the System Health page.
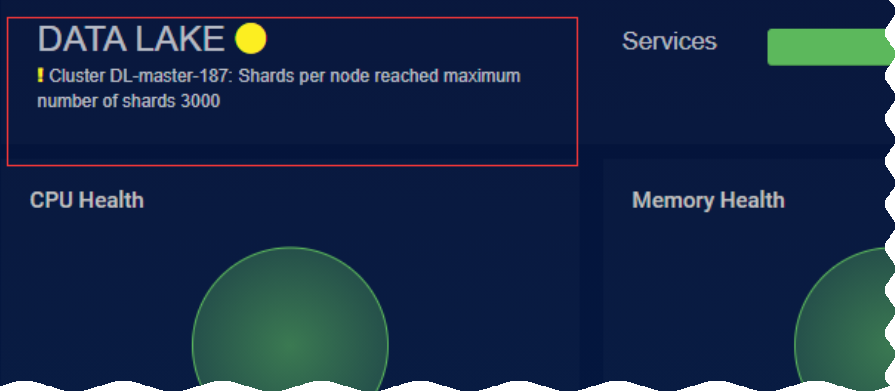
Additional Information in Data Lake Health
The Data Lake Health panel also reports any of the following conditions detected on the data lake:
-
Lost nodes
-
Excessive shards per node
-
Duplicated aliases in specific indices
-
Excessive field mappings in specific indices
These situations are only reported when detected and appear directly below the Data Lake heading, as shown in the example below:
Machine Learning

The graph indicates the percentage of installed services that are available. Any number less than 100% indicates that the system is either booting up, or has capacity or hardware issues.
