Using the Kibana Plugin
You must have Root scope to use this feature.
The Kibana plugin lets you analyze the Stellar Cyber data lake using Kibana without leaving Stellar Cyber. You do not need to log in to Kibana.
You can damage the Stellar Cyber data structure using these tools. Use caution. Commands that alter data should only be used by advanced users.
The Kibana application is displayed as an embedded window.
See the Kibana User Guide for full documentation of this tool.
Performing Searches for Index Patterns in Kibana 
Keep in mind that when you enter index patterns to retrieve data from Stellar Cyber using Elasticsearch, you must use the following format:
aella-<index_type>-*
The index_type corresponds to one of the following Stellar Cyber indices:
-
Alerts:
aella-ser-* -
Assets:
aella-assets-* -
AWS Events:
aella-cloudtrail-* -
IDPS/Malware Sandbox Events:
aella-maltrace-* -
Linux Events:
aella-audit-* -
Scans:
aella-scan-* -
Sensor Monitoring:
aella-ade-* -
Signals:
aella-signals-* -
Syslog:
aella-syslog-* -
Traffic –
aella-adr-* -
Users –
aella-users-* -
Windows:
aella-wineventlog-*
Tip: Supply Your Organization ID
If you do not see results appear when you supply one of the index patterns listed above, you may need to supply the first one or two characters of your Organization ID. You can find your Organization ID in either of the following ways:
-
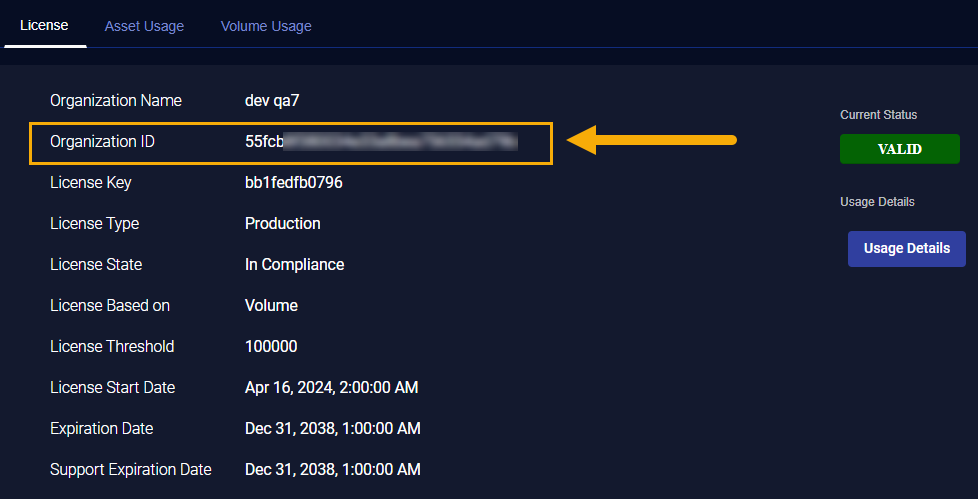
Use the System | License page. For example:
-
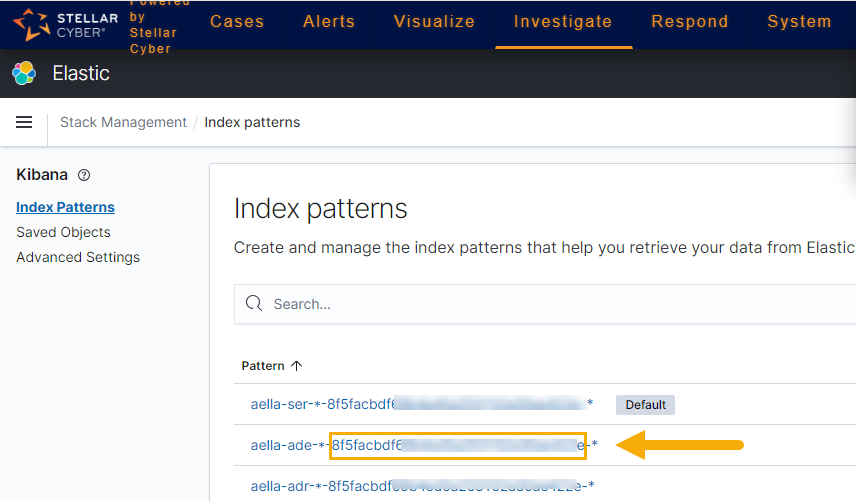
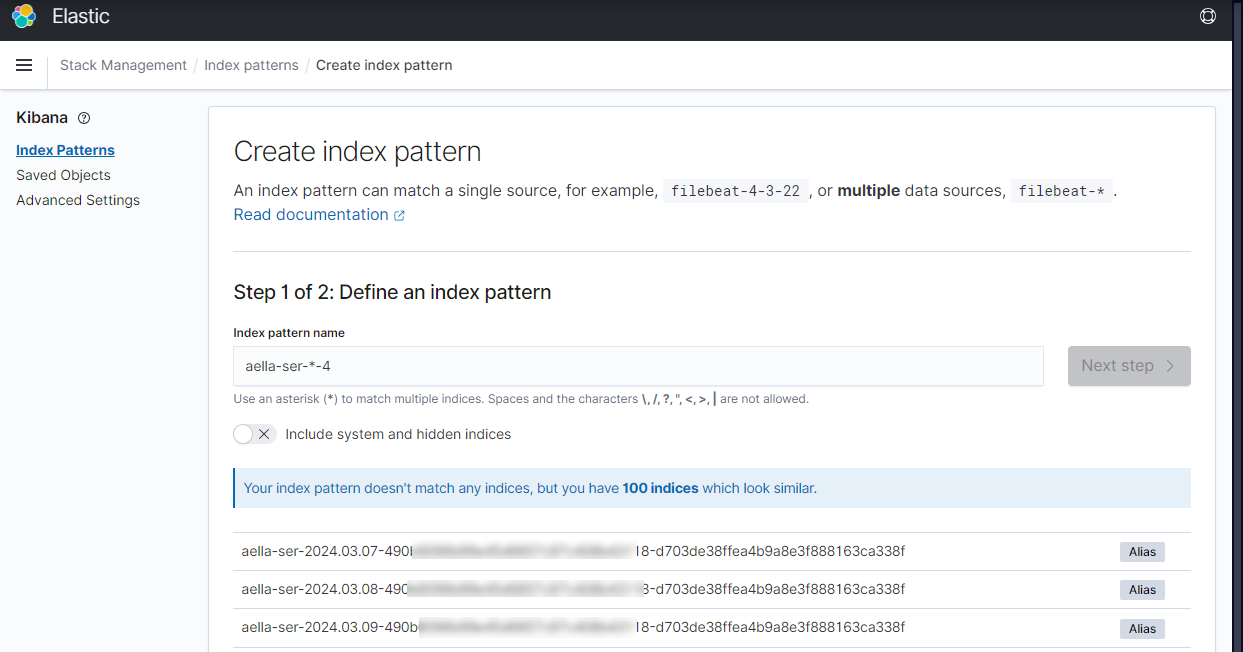
Look in Stack Management | Index Patterns in Kibana. The Organization ID is right after the aella-<index>-*- entry, as illustrated below:
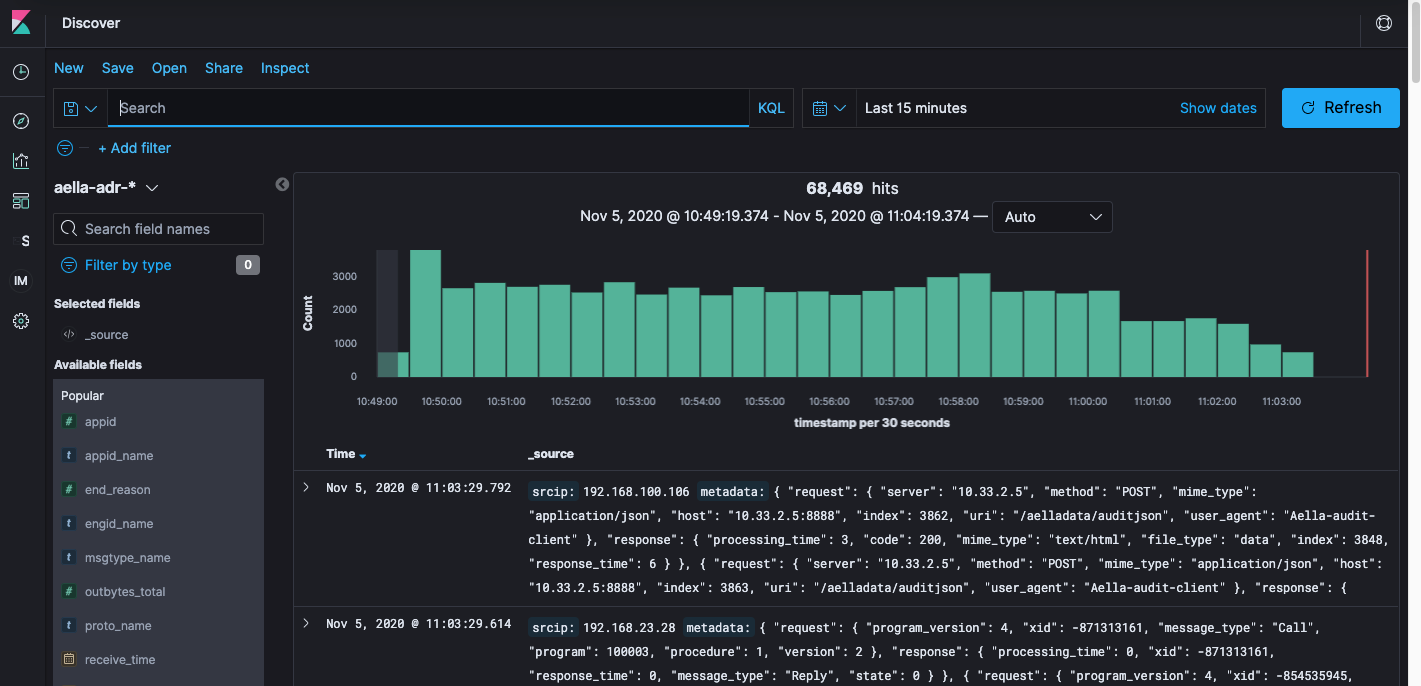
Here's an example of how a search for an index pattern looks when the first character of an Organization ID beginning with 4 is provided:
Sample Searches
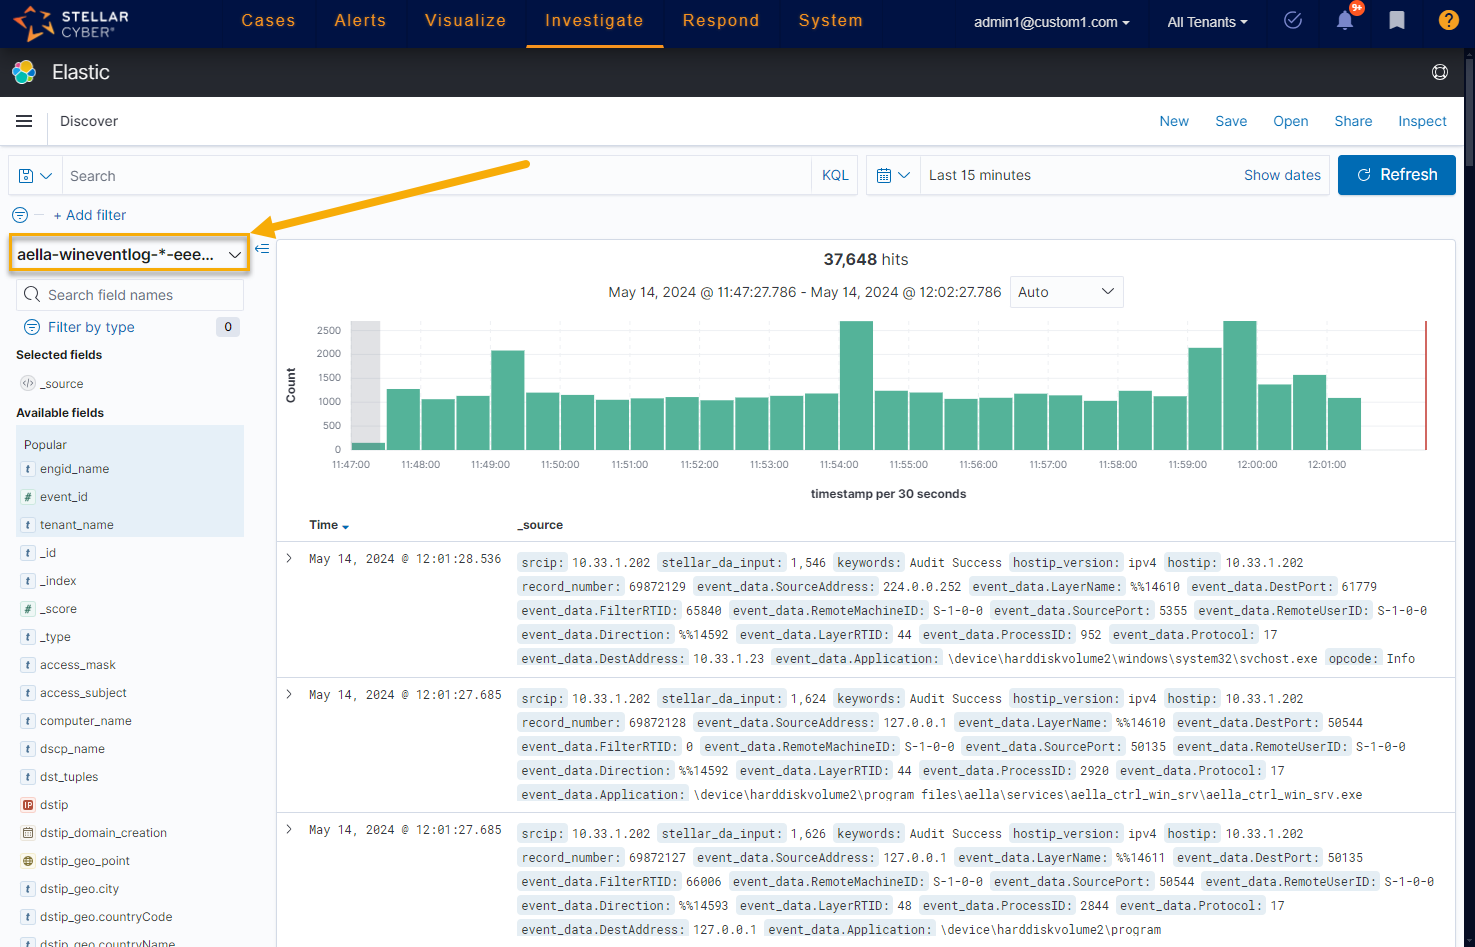
Here is a sample search on an aella-wineventlog-*- index: