Using the Detection Management System
Only Super Admin or Platform Admin users with Root scope can make changes in Detection Management.
The Detection Management System is a collection of related features on how to view and manage detections across the network. Detections identify suspicious patterns in the data or deviations from normal behavior, and raise alerts if necessary. Alert types categorize different alerts.
Using the Detection Management System, you can:
-
access detections easily
-
manage detections
-
gain visibility and control over detection settings and status
The main capabilities of the Detection Management System are:
-
Customizable settings for newly released detections:
Benefit—Provides SOC teams with the flexibility to customize how each tier (Tier 1, Tier 2, and Experimental) of newly released detections behaves in terms of alert generation and visibility.
Why it Matters—SOC teams often grapple with complex systems and the integration of new tools. A streamlined process reduces operational complexity, enabling faster and more efficient updates and rule management that directly impacts response times in critical security situations.
-
Enhanced visibility and control over detections:
Benefit—Offers granular control over the activation state of detections (On or Off) and Sigma rule detections (On, Off, or Silent), and comprehensive visibility into the performance of each detection through hit statistics.
Tailored Detection Alerting:
-
On: Activates the rule, generating alerts as designed. This setting is essential for high-priority rules where immediate attention is needed.
-
Silent: The rule is active but does not send real-time alerts. This setting is valuable for Tier 2 rules where oversight is necessary, but real-time response may not be.
-
Off: Completely disables the rule, preventing it from running or generating alerts. This setting is for experimental rules that may generate high volumes of false positives or are in a testing phase.
-
Hits: Counts the number of times the detection was triggered (or would have been triggered for Silent mode) over the past seven days. The counter refreshes every hour. The count reflects alerts before filtering, but after alert suppression. The hit count statistics are useful for monitoring and collecting data without overwhelming the SOC with notifications.
See Detection Management Table for Sigma Rule Based Detections.
Considerations for manual event generation: Due to the nature of Stellar Cyber's alert correlation and machine learning models, manually generated or ad-hoc events may not always trigger the expected alert or case creation. The Stellar Cyber platform is designed to analyze and correlate multiple events over time, assessing patterns and context to determine the severity of a potential threat. As a result, isolated or artificial events might not meet the criteria for high-severity alerts or case generation, and may not be representative of the system's full detection capabilities in real-world threat scenarios.
-
-
Insight into possible data sources:
Benefit—Provides a comprehensive list of data sources that could contribute to the detection of various types of security alerts within an organization's IT ecosystem.
See Detections Panels.
See the following:
Using the Detection Management Page
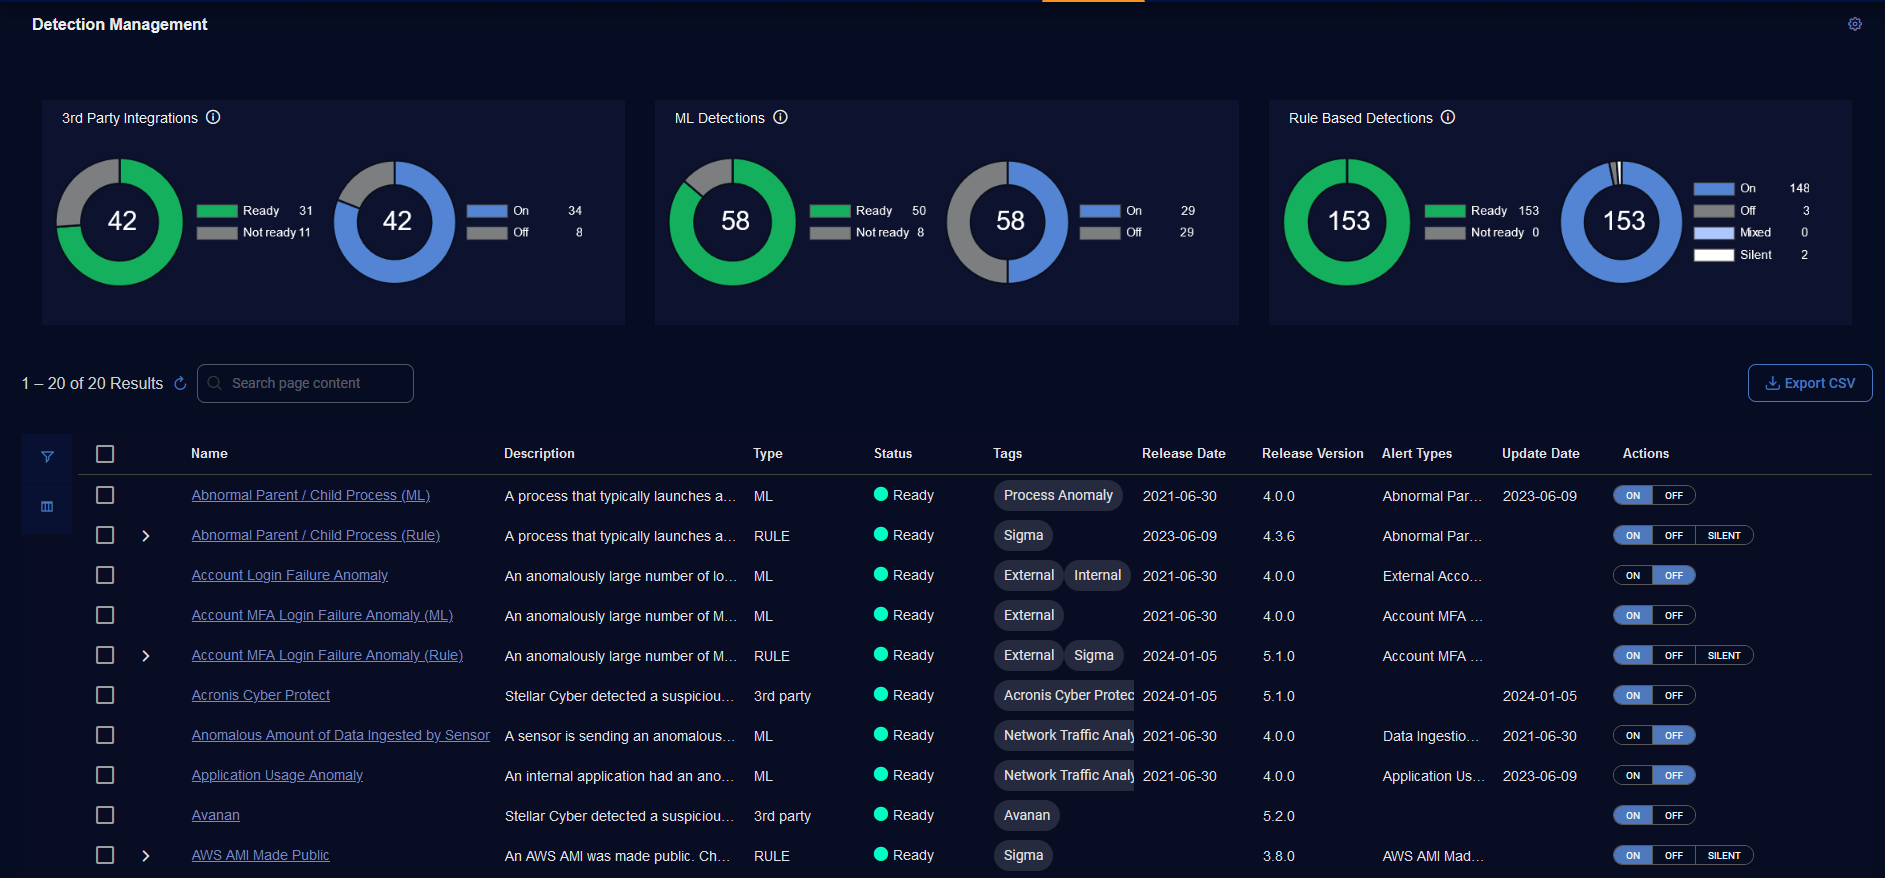
To use Detection Management, select System | Detection Management (under Detections). The Detection Management page is displayed. It has three panels on the top and a table below.
See the following:
Detection Management Panels
The panels at the top of the Detection Management page are for the following detection types:
-
3rd Party Integrations—third party alert integrations
-
ML Detections—built-in machine learning (ML) alert types
-
Rule Based Detections—rule based alert types, including Sigma rules and analytical rules
The panels let you see the detection types at a high level and provide summary statistics. In addition, you can easily filter by type by selecting one of the panels.
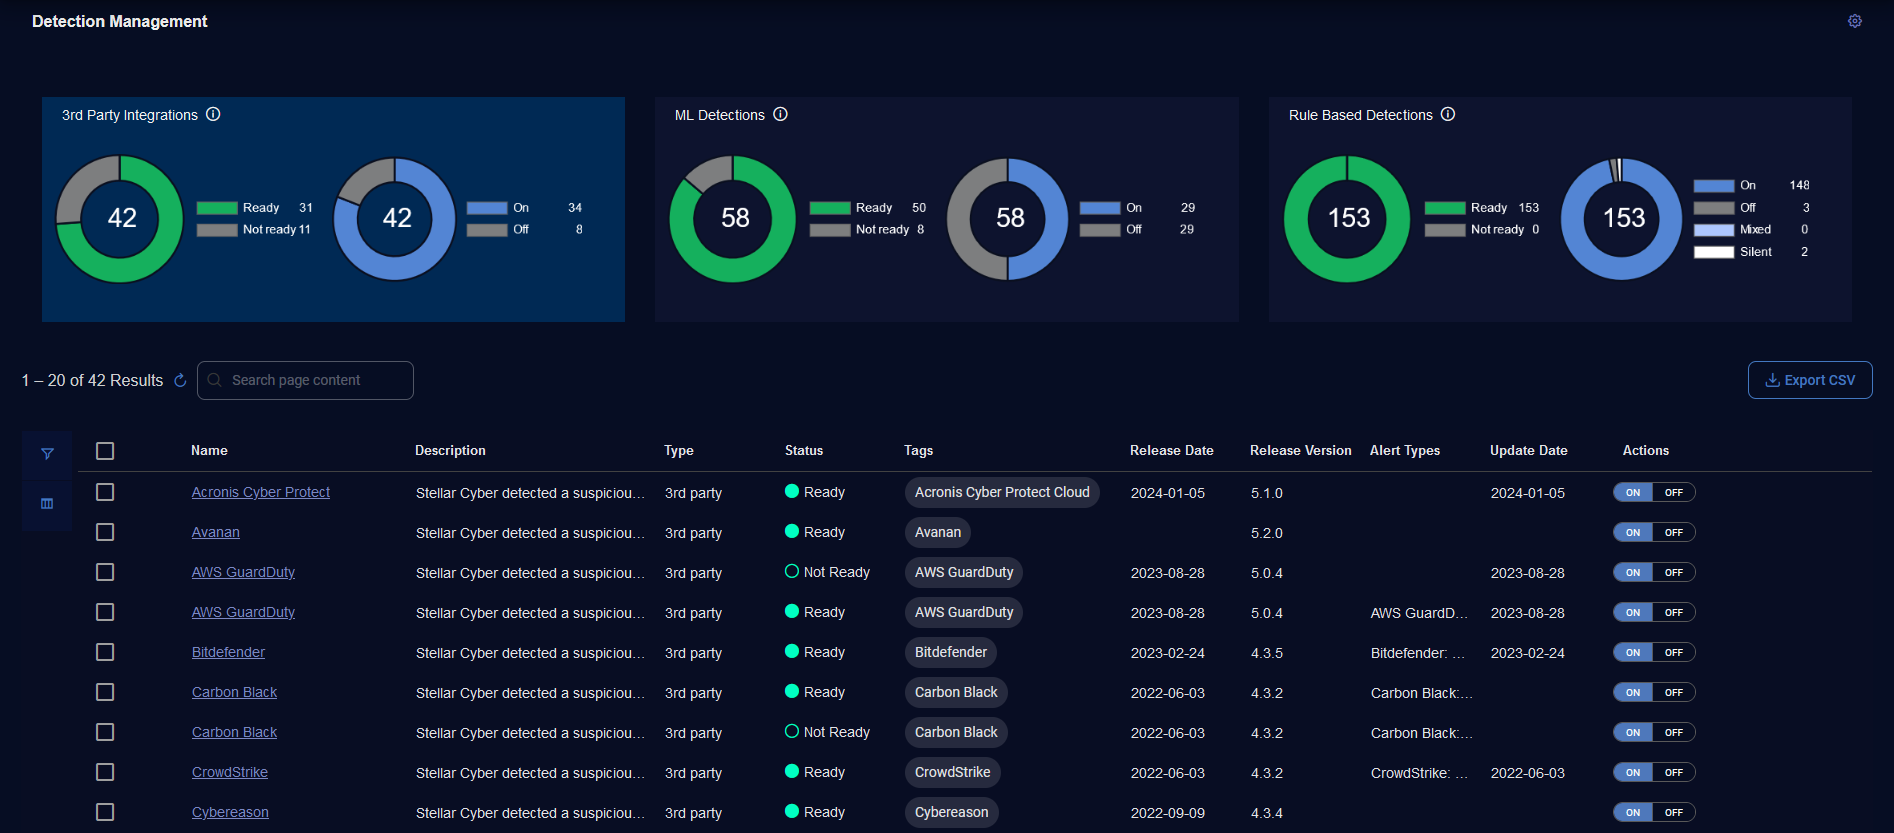
For example, to see only 3rd Party Integrations, select the 3rd Party Integrations panel. The panel is highlighted and the table below displays only the 3rd Party alert types.
Click the panel again to stop filtering by that detection type. The highlighting is removed.
Each of the three panels contains the following statistics:
-
count of the number of detections
-
running status:
-
Ready:
-
For 3rd Party Integrations, the backend pipelines are ready to detect an anomaly.
-
For ML Detections, the job is ready to detect an anomaly.
-
For Rule Based Detections, the detection is running and can produce alerts.
-
-
Not ready:
-
For 3rd Party Integrations, the backend pipelines have some errors or were never started for the job or rule.
-
For ML Detections, the backend pipelines have some errors or were never started for the job or there is no data for this job.
When a job is in training, the running status is Not ready. Training time may require two weeks. Refer to Alert Type Model Summary.
-
For Rule Based Detections, the detection is not running or is preparing to run.
-
-
-
user-specified state of the detection:
-
On—detections are fully active. On activates detections to monitor and produce real-time alerts when triggered. On is typically used for high-confidence Tier 1 detections that require immediate attention.
-
Off—detections are inactive. Off disables detections, halting monitoring and alert triggering, which reduces system noise and conserves resources. Detections can be reactivated as needed. Off is suitable for managing lower priority (Tier 2) or experimental grades.
-
Silent—detections are active but do not produce alerts when triggered, allowing for passive monitoring (only available for Rule Based Detections). Silent detections operate silently, gathering data and allowing for performance evaluation to ensure minimal false positives and optimal effectiveness.
-
Mixed—detections that are a mix of On, Off, or Silent (only available for Rule Based Detections as this state is based on the individual rules within the detection).
-
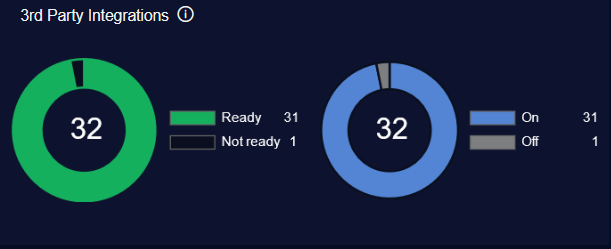
For example, selecting the 3rd Party Integrations panel displays:
-
count = 32
-
Ready = 31
-
Not ready = 1
-
On = 31
-
Off = 1
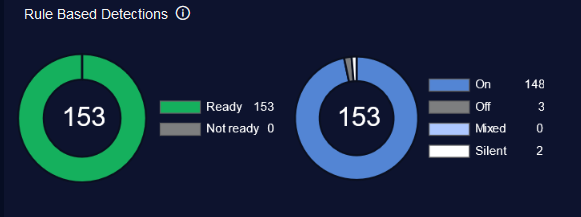
For example, selecting the Rule Based Detections panel displays:
-
count = 153
-
Ready = 153
-
Not ready = 0
-
On = 148
-
Off = 3
-
Mixed = 0
-
Silent = 2
Detection Management Table
The Detection Management table has the following columns:
-
Name—Name of the detection.
-
Description—Description of the detection.
-
Type—Type of detection as 3rd party, ML, or RULE.
-
Status—Status of the alert type as Ready or Not Ready.
-
Tags—Tags that identify the detection such as External, Internal, Analytics, Sigma, or Malware.
-
Release Date—Date in which the detection was released in the Stellar Cyber platform.
-
Release Version—Version in which the detection was released in the Stellar Cyber platform.
-
Alert Types—Display name of the alert type.
-
Update Date—Date in which the detection was updated in the Stellar Cyber platform.
-
Update Version—Version in which the detection was updated in the Stellar Cyber platform.
-
Actions—Actions for 3rd Party Integrations and ML Detections to toggle an alert type ON or OFF and actions for Rule Based Detections to toggle an alert type ON, OFF, or SILENT.
Use the Detection Management table for the following:
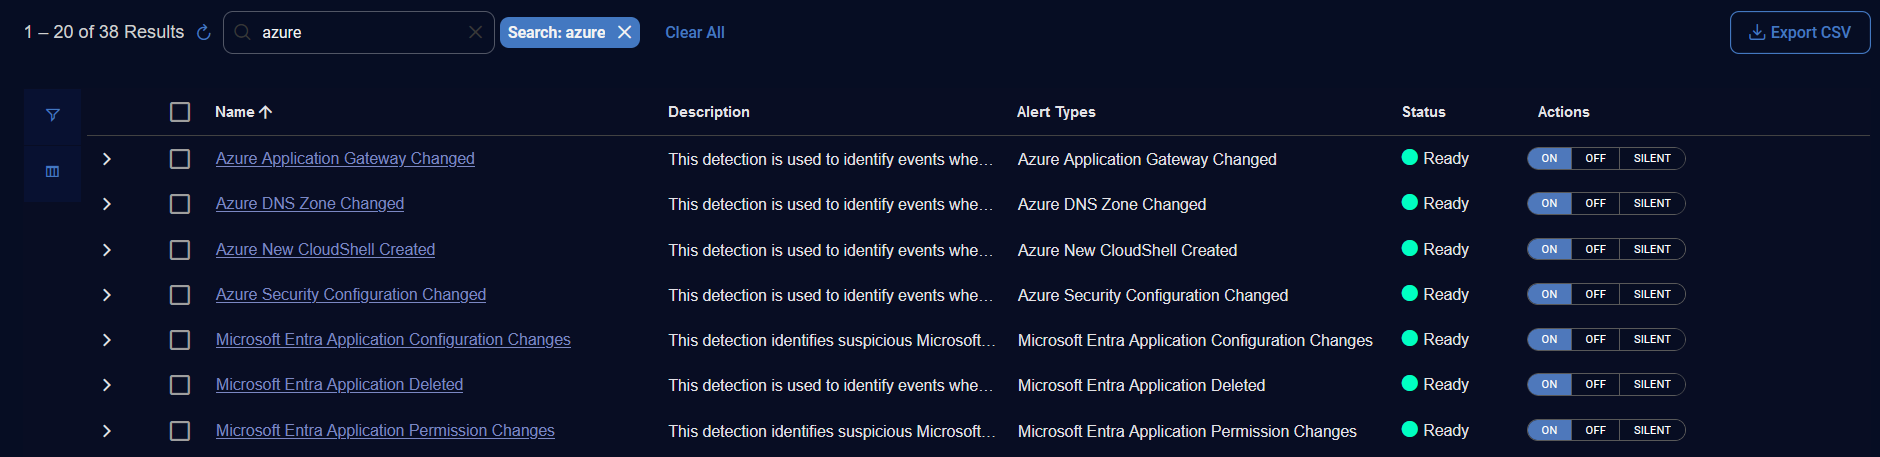
Using Search
Use the Search box to search for content in the table.

For example, type azure to search for all Azure alert types.
Selecting Columns
Click the Columns icon (![]() ) to add or remove columns in the table using check boxes.
) to add or remove columns in the table using check boxes.
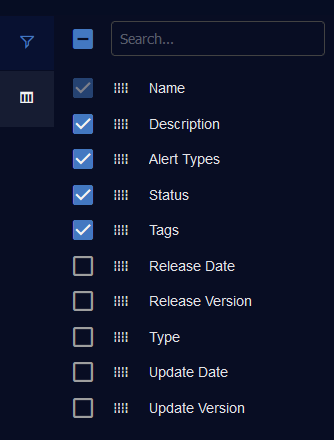
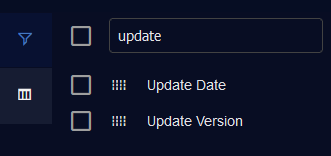
You can also type the name of a column in the Search box.
To exit, click the Columns icon (![]() ) again.
) again.
Using Filters
Click the Filters icon (![]() ) to use defined filters.
) to use defined filters.
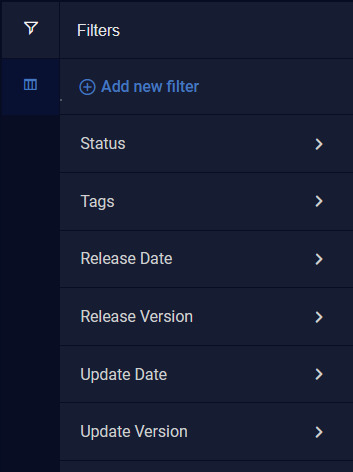
To use defined filters:
-
For Status, select the status using the check boxes. The number of alerts of each status is displayed on the right.
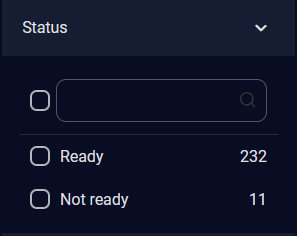
You can also use the search box to search for a specific status.
-
For Tags, select the tags using the check boxes. The number of alerts of each tag is displayed on the right. A scroll bar is available on the right when there are more tags in the list than can be displayed.
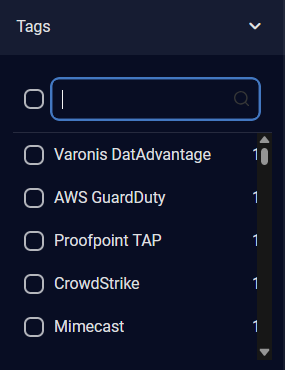
You can also use the search box to search for a specific tag.
-
For Release Date, select a release date using the check boxes. The number of alerts of each release date is displayed on the right. A scroll bar is available on the right when there are more release dates in the list than can be displayed.
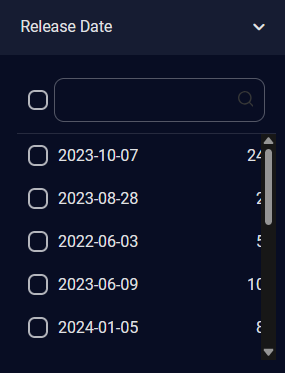
You can also use the search box to search for a specific release date.
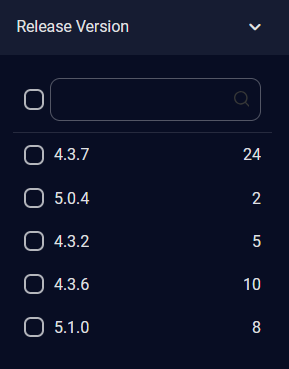
-
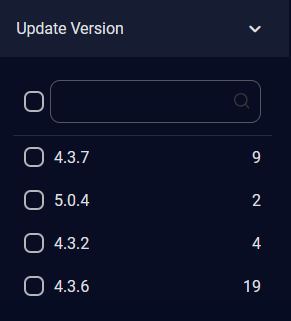
For Release Version, select the release version using the check boxes. The number of alerts of each release version is displayed on the right. A scroll bar is available on the right when there are more release versions in the list than can be displayed.
-
For Update Date, select an update date using the check boxes. The number of alerts of each update date is displayed on the right. A scroll bar is available on the right when there are more update dates in the list than can be displayed.
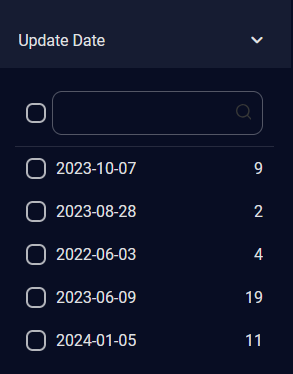
You can also use the search box to search for a specific update date.
-
For Update Version, select an update version using the check boxes. The number of alerts of each update version is displayed on the right. A scroll bar is available on the right when there are more update versions in the list than can be displayed.
You can also use the search box to search for a specific update version.
-
You can click the Add new filter search box to deselect a filter in the dropdown menu.
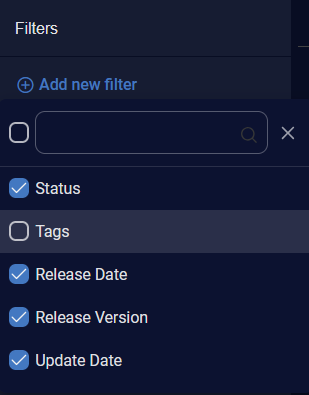
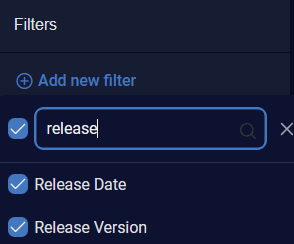
-
You can also type in the Add new filter search box to search for a filter by name.
To exit, click the Filters icon (![]() ) again. The configured filters are displayed at the top of the table and the results are displayed in the table.
) again. The configured filters are displayed at the top of the table and the results are displayed in the table.
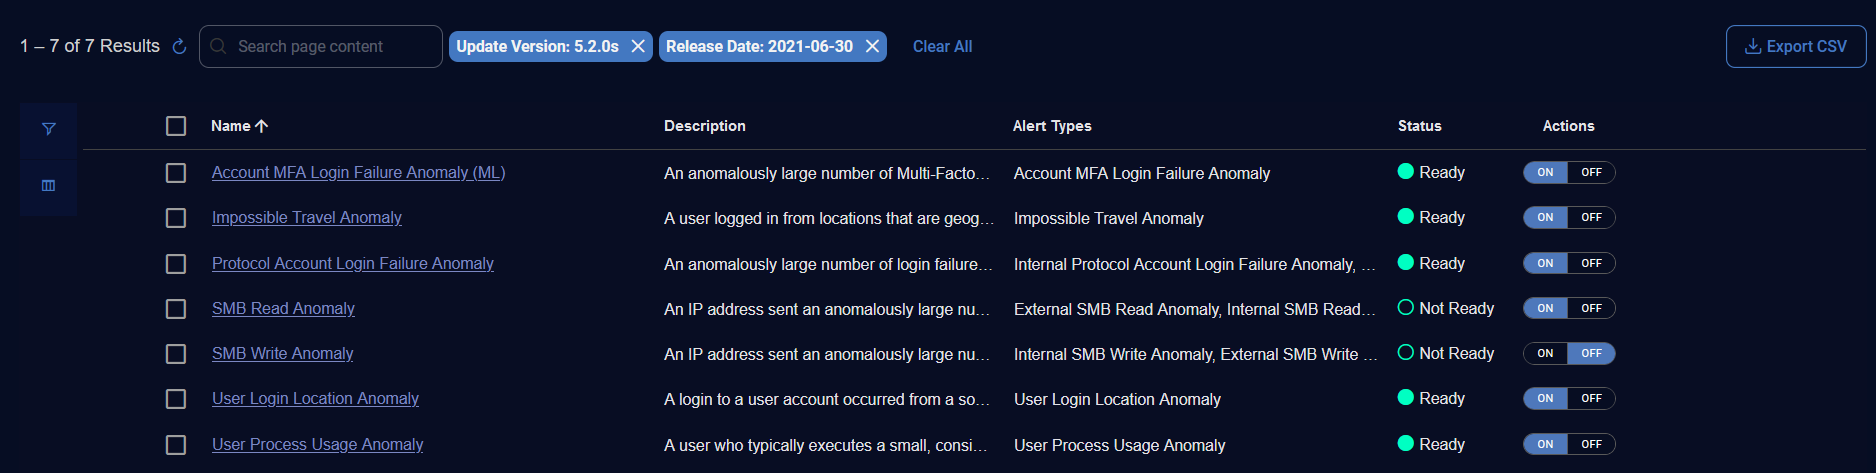
To clear an individual filter, click the icon to the right of the filter (![]() ).
).
To clear all filters, click Clear All.
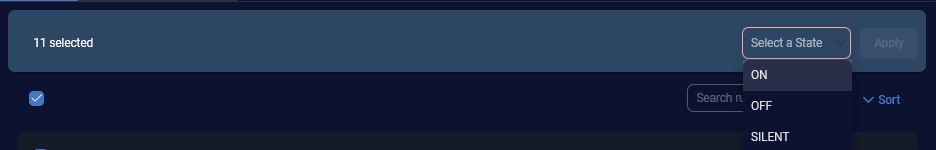
Performing Bulk Actions
The Detection Management table has check boxes on the left that let you select multiple detections. You can change the state on multiple detections at the same time. For all detections, you can select ON or OFF. If you select only RULE type detections, you can select ON, OFF, or SILENT.
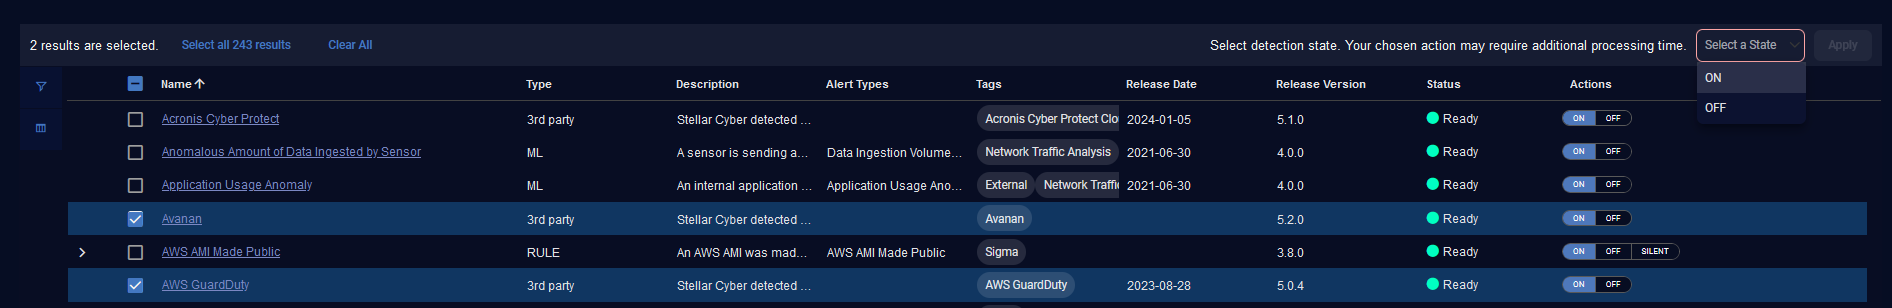
Click Clear all to clear the check box selections.
Exporting CSV
Click Export CSV to export the table as a spreadsheet file.
You can export Selected Columns or All Columns. The spreadsheet is downloaded to your Downloads folder.
Detection Management Table for Sigma Rule Based Detections
The Detection Management table for Rule Based Detections (only for Sigma rules) has an expand feature because there can be many rules within a rule based detection.
To see the individual rules, click the icon (![]() ) to expand the row.
) to expand the row.
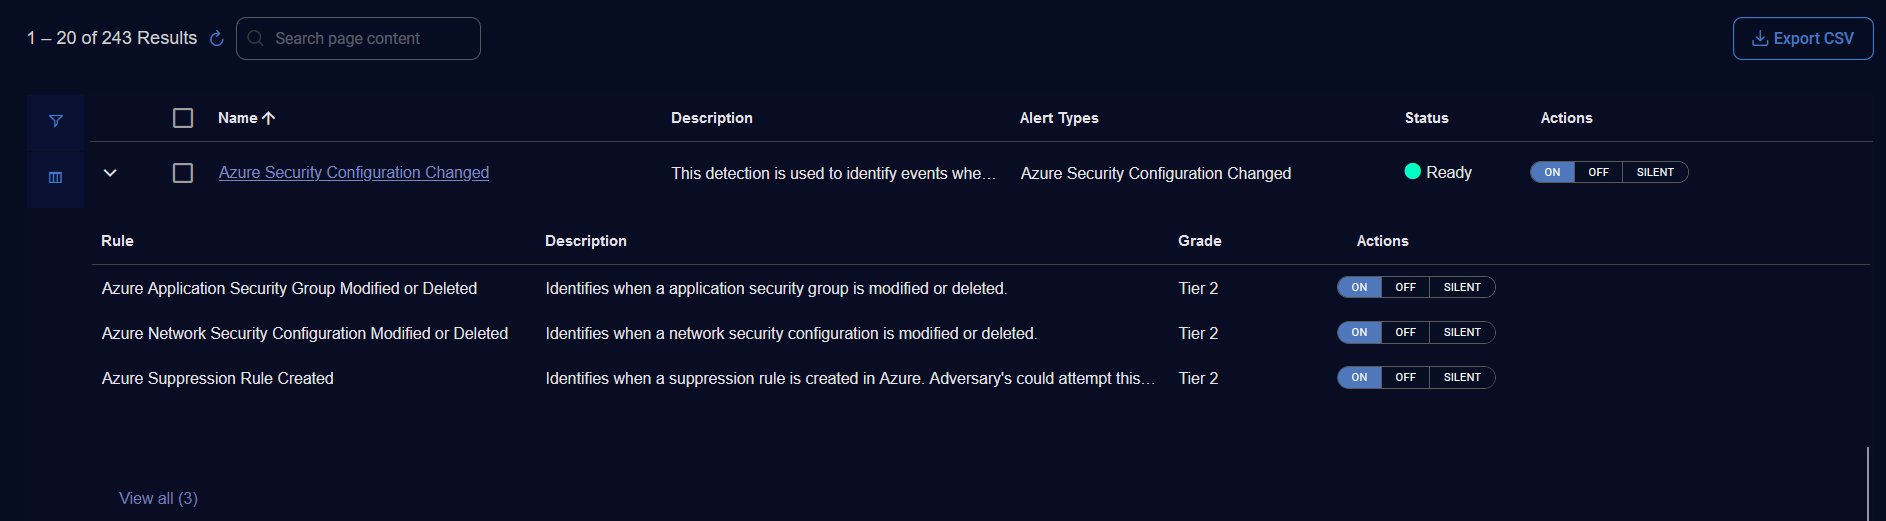
The table has the following columns:
-
Rule—Name of the rule.
-
Description—Description of the rule.
-
Grade—Grade of the rule:
-
Tier 1—detections that are stable and in production
-
Tier 2—detections that are in development or test
-
Experimental—experimental detections
-
-
Actions—Actions for rule based detections include toggles for ON, OFF, or SILENT for an individual rule.
At the bottom of the expanded rule based detection, the View all link takes you to the Detection Panel for Rule Detections.
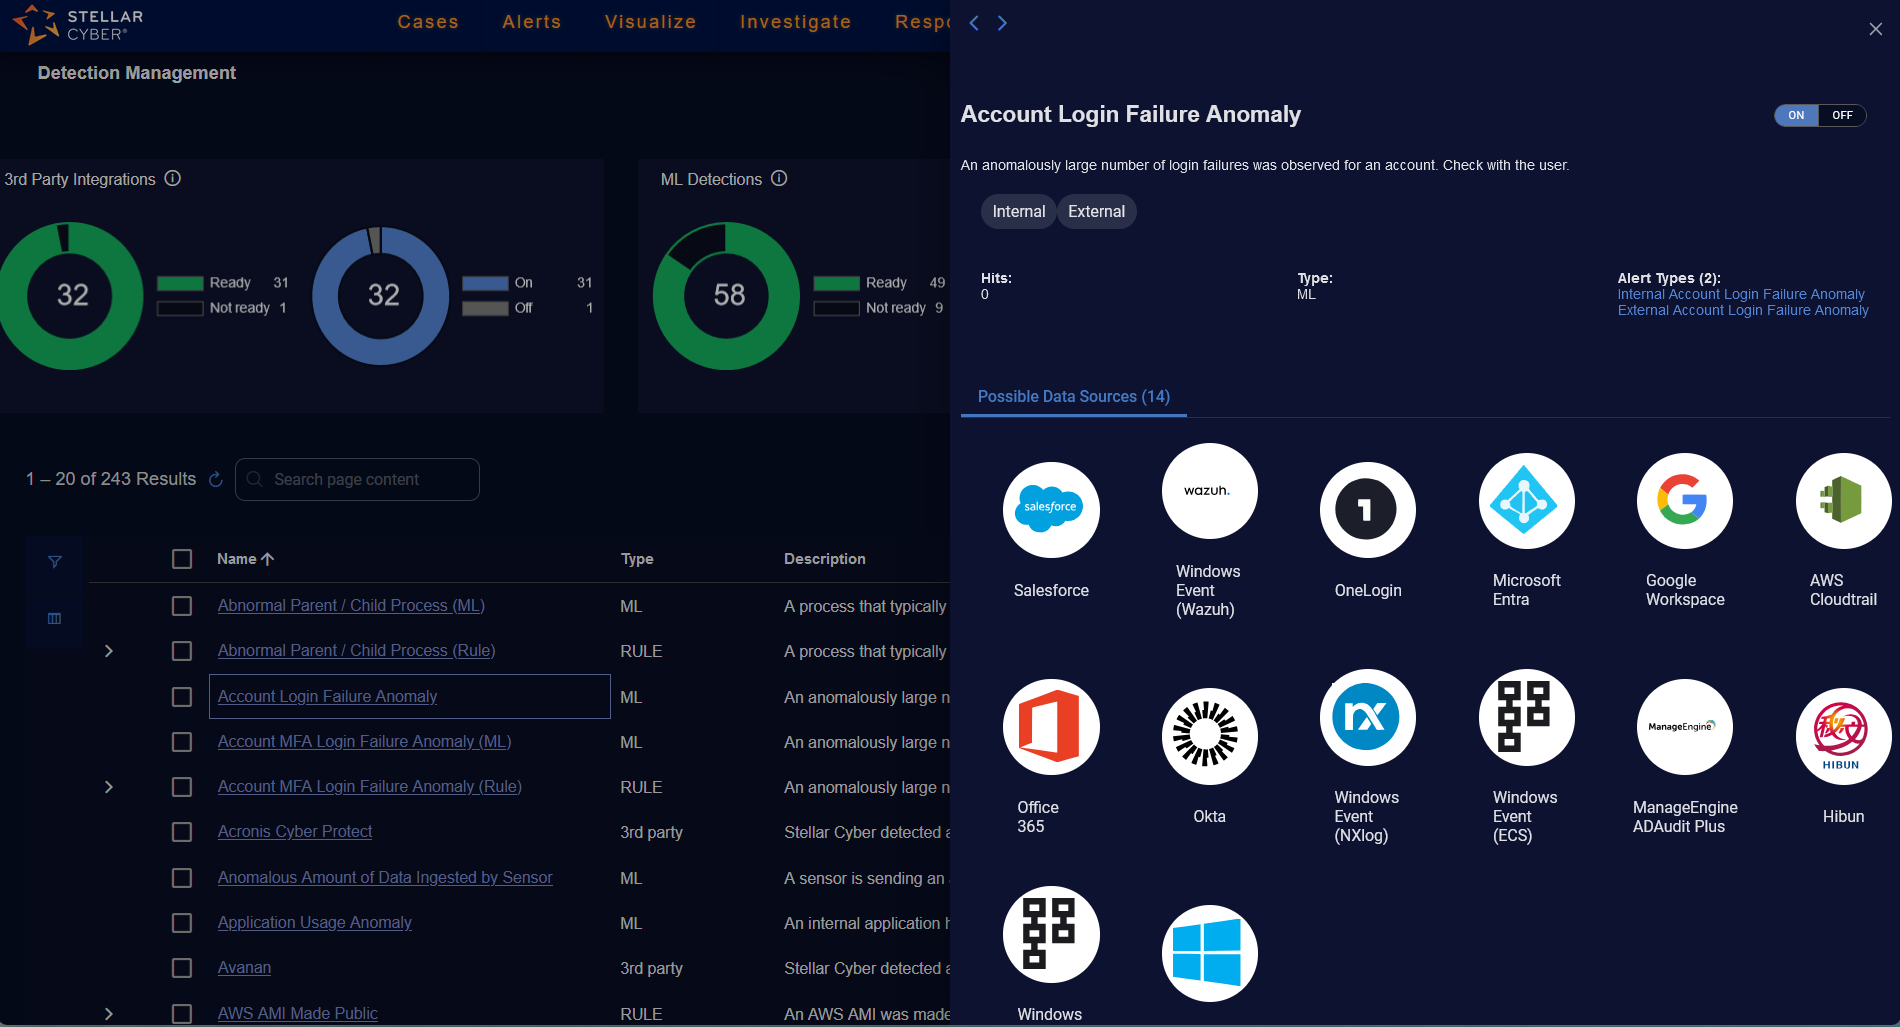
Detections Panels
The Name column in the Detection Management table has links to the detection. When you click the link, a panel is displayed on the right.
The top part of the panel has the following:
-
Name of the detection.
-
Description of the detection.
-
Toggle for ON or OFF (and SILENT or Mixed for Rule Based Detections).
-
Tags that identify the detection.
-
Hits (for ML and Rule Based Detections) that count the number of alerts triggered in the past seven days or since the last Reset hit stats was performed. The stats are refreshed every hour.
-
Type of the detection: 3rd party, ML, or RULE.
-
Alert types and count:
-
For ML and Rule Based Detections, the Alert Types are predefined.
-
For 3rd party alert integrations, the Alert Types are dynamically generated.
There may not be a link if the alert type has not triggered yet.
Click the Alert Types link(s) to go to the Alerts page.
-
-
Previous and Next icons (
 ) at the top to move to the previous detection or the next detection in the table.
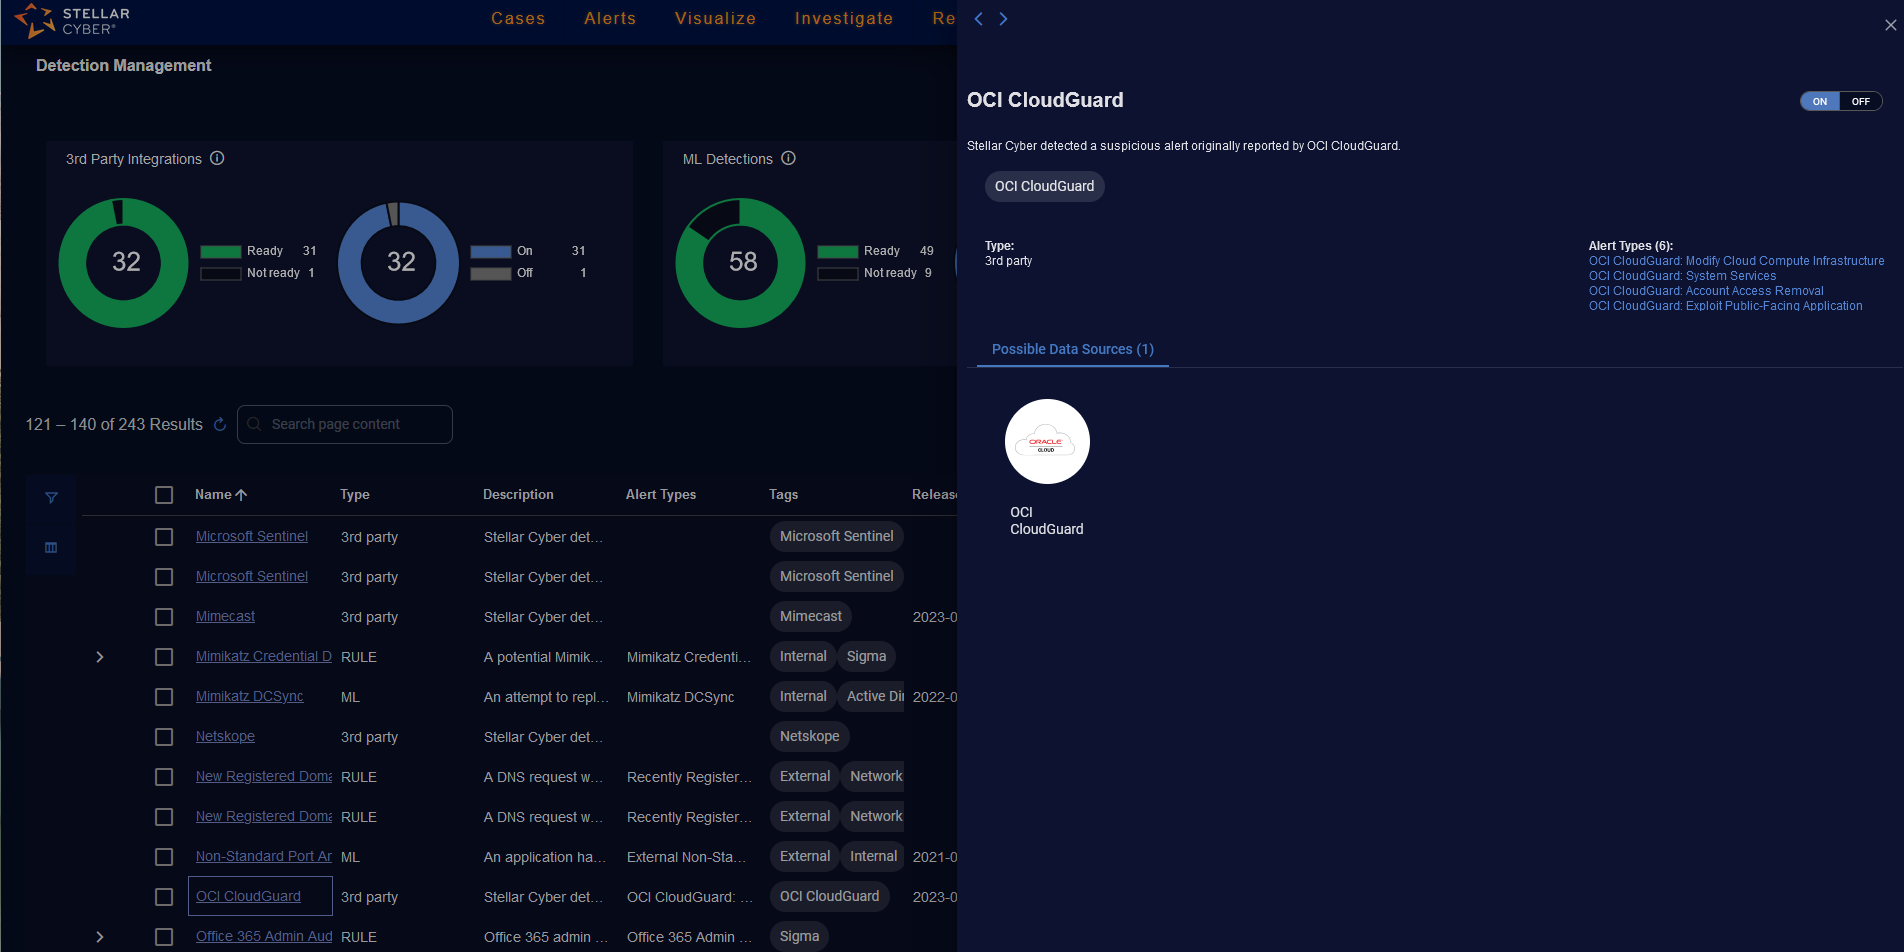
The lower part of the panel displays information depending on the type of detection. All detection types display Possible Data Sources that may support the detection. The Possible Data Sources is a static list.
See the following:
Detection Panel for ML Detections
When you click a link for an ML type of detection, the panel on the right lists icons of the Possible Data Sources and their count.
Detection Panel for 3rd Party Detections
When you click a link for a 3rd party type of detection, the panel on the right lists icons of the Possible Data Sources and their count.
Detection Panel for Rule Detections
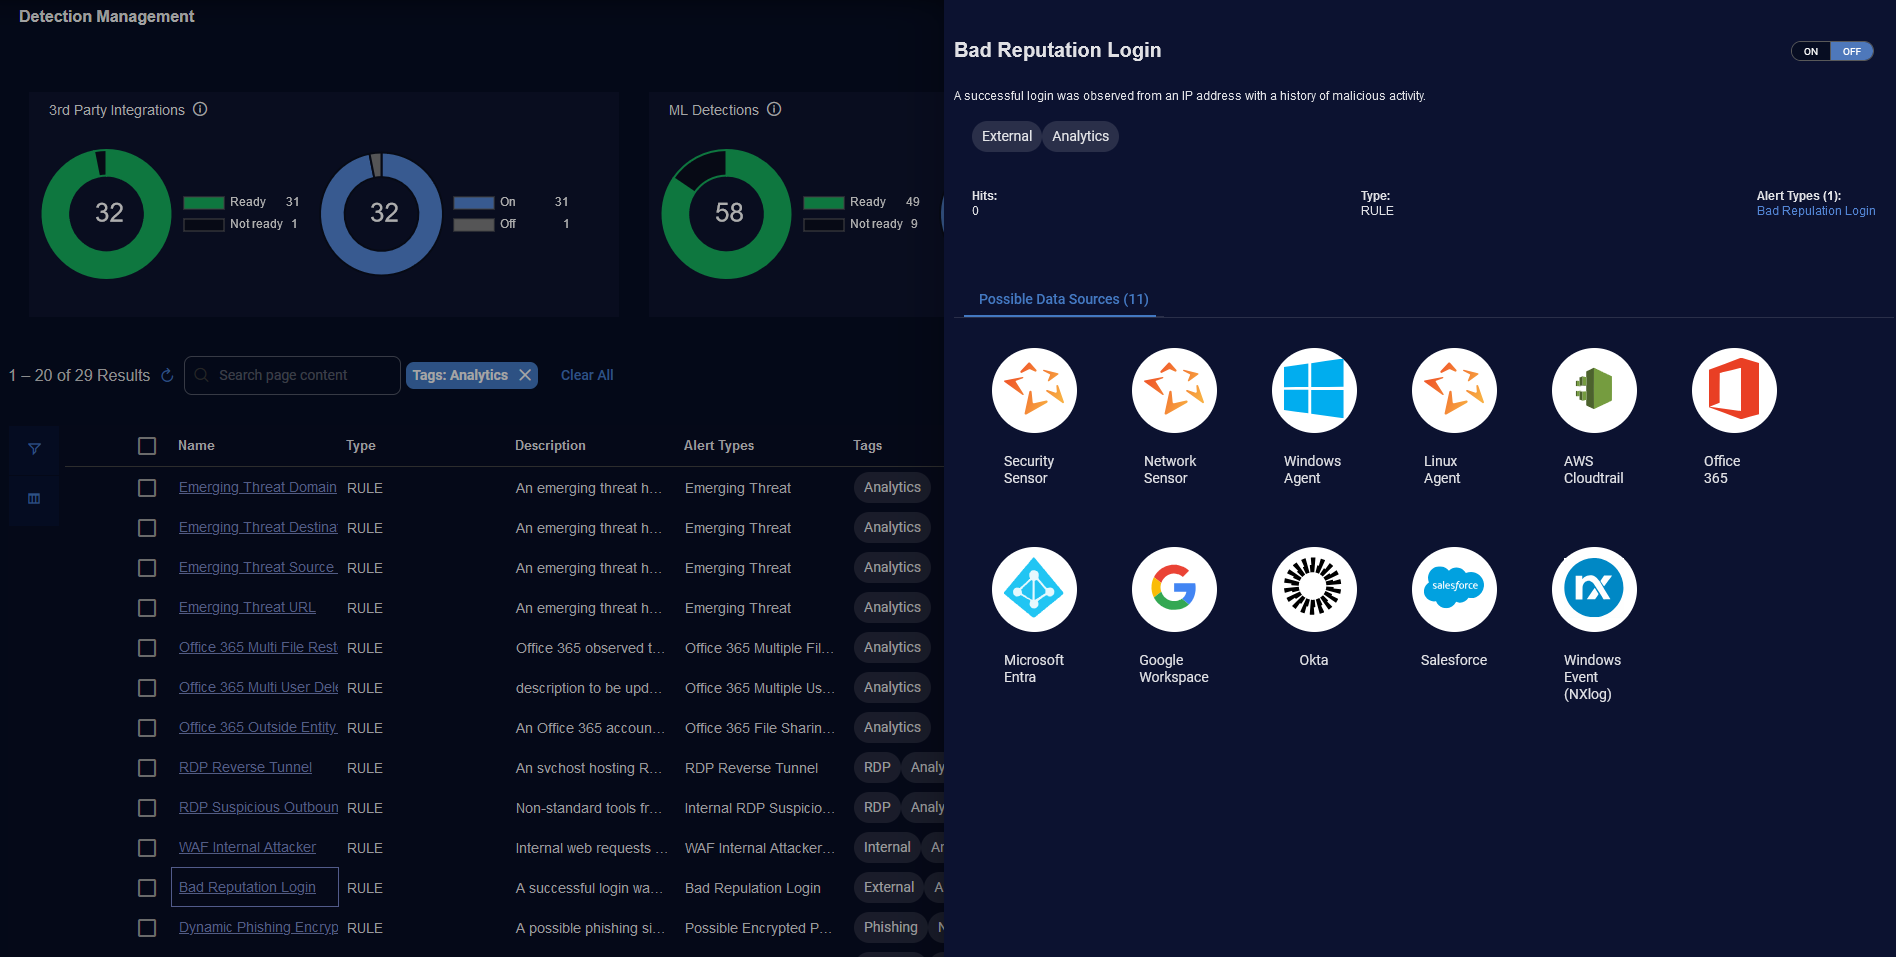
When you click a link for a rule type of detection (for analytics rules), the panel on the right lists icons of the Possible Data Sources and their count.
The Analytics tag differentiates rule detections that are analytical rules.
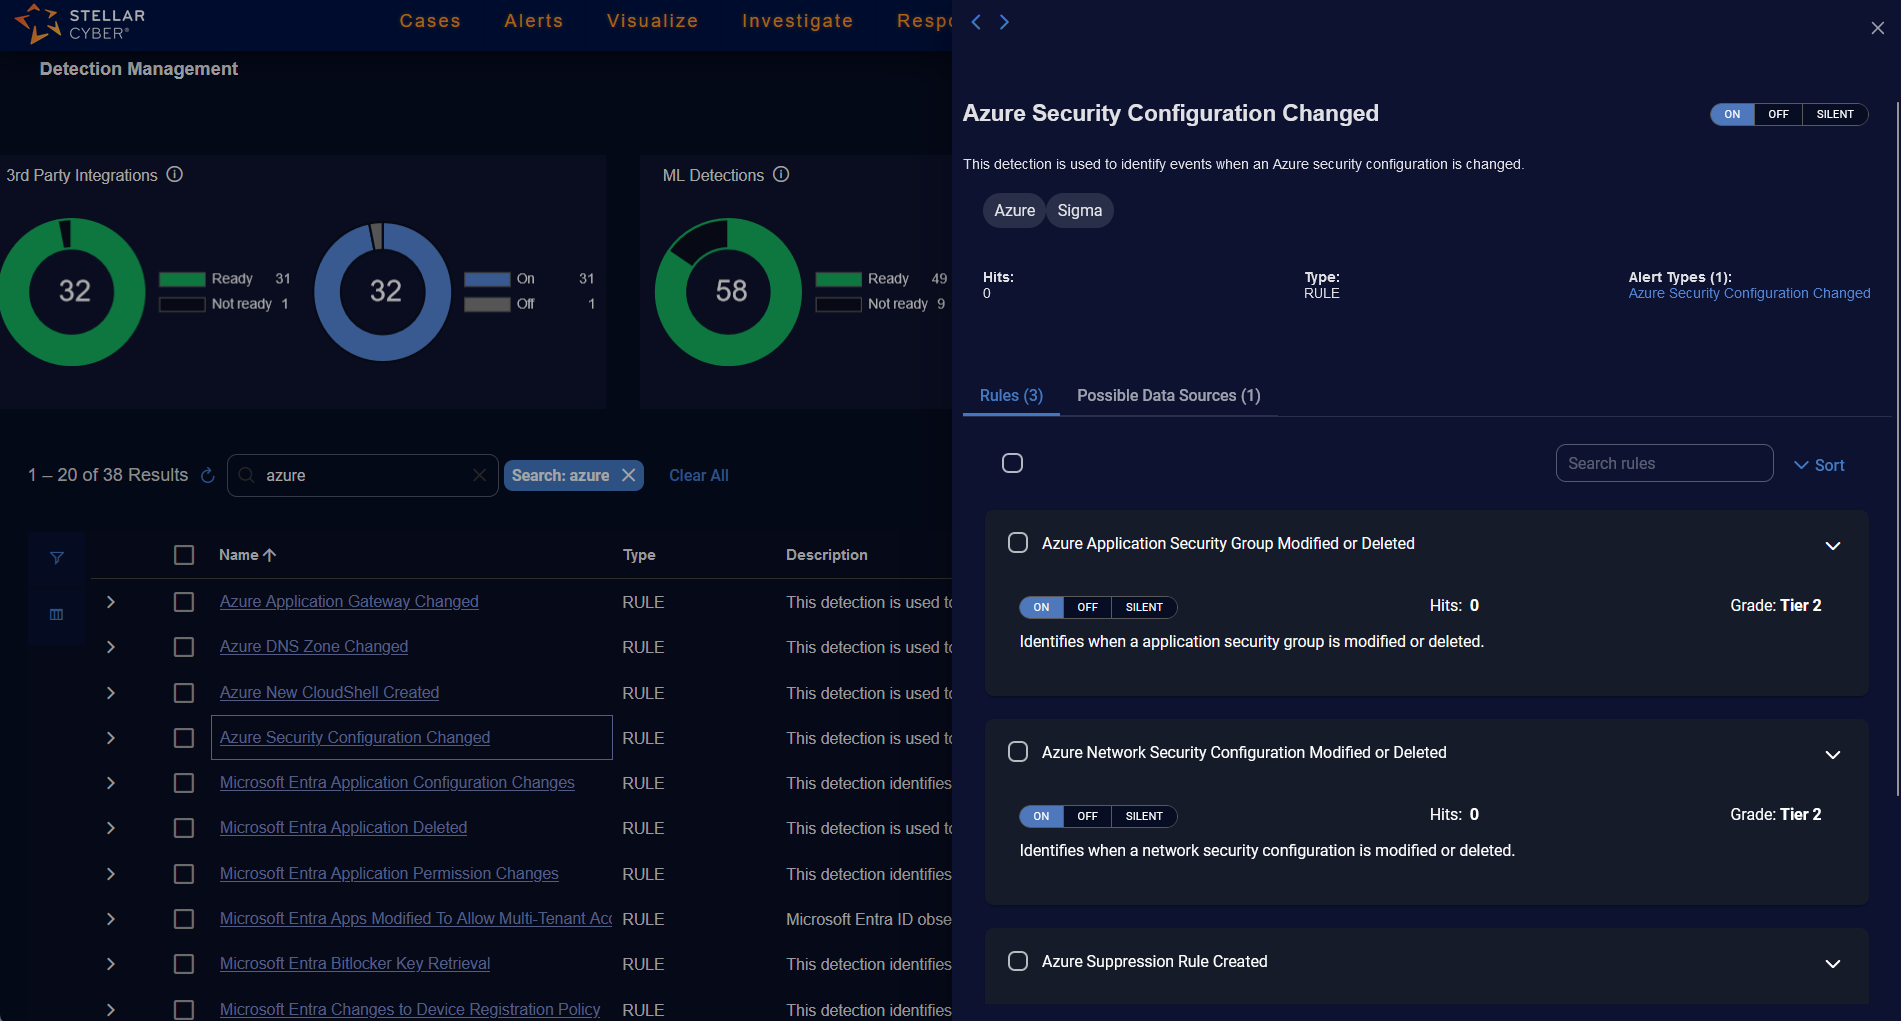
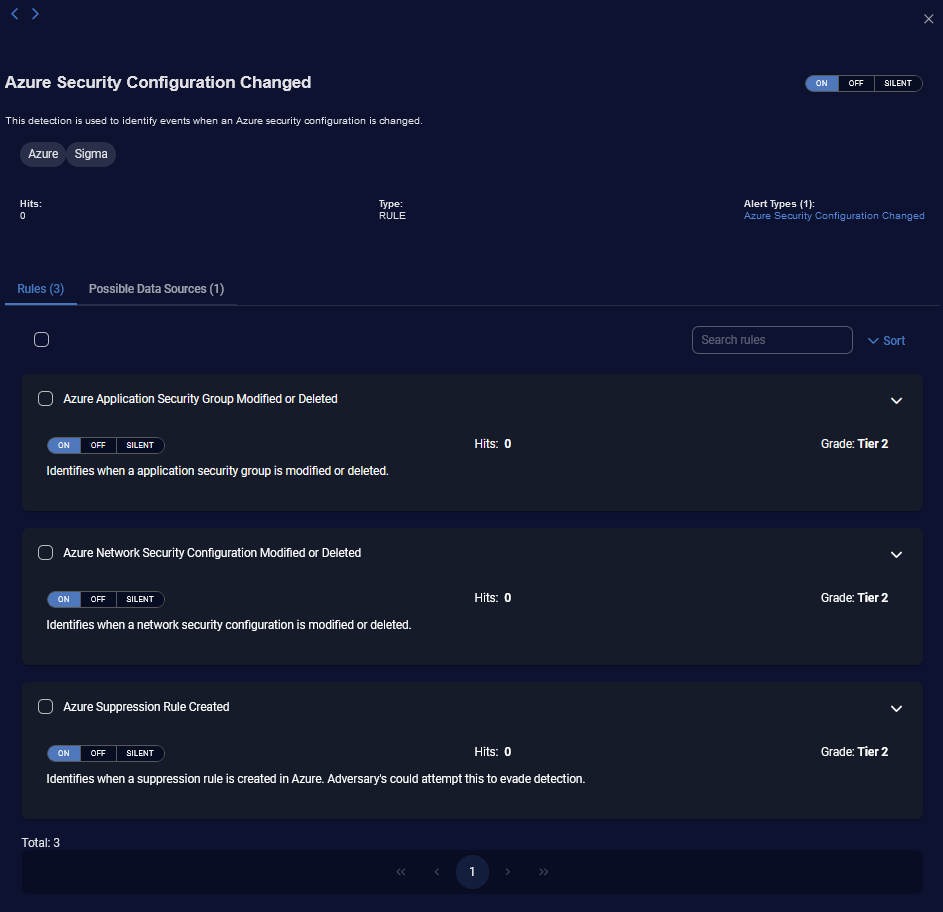
When you click a link for a rule type of detection (only for Sigma rules), the panel on the right lists Rules and their count. These are the individual rules that support the detection.
The Sigma tag differentiates rule detections that are Sigma rules.
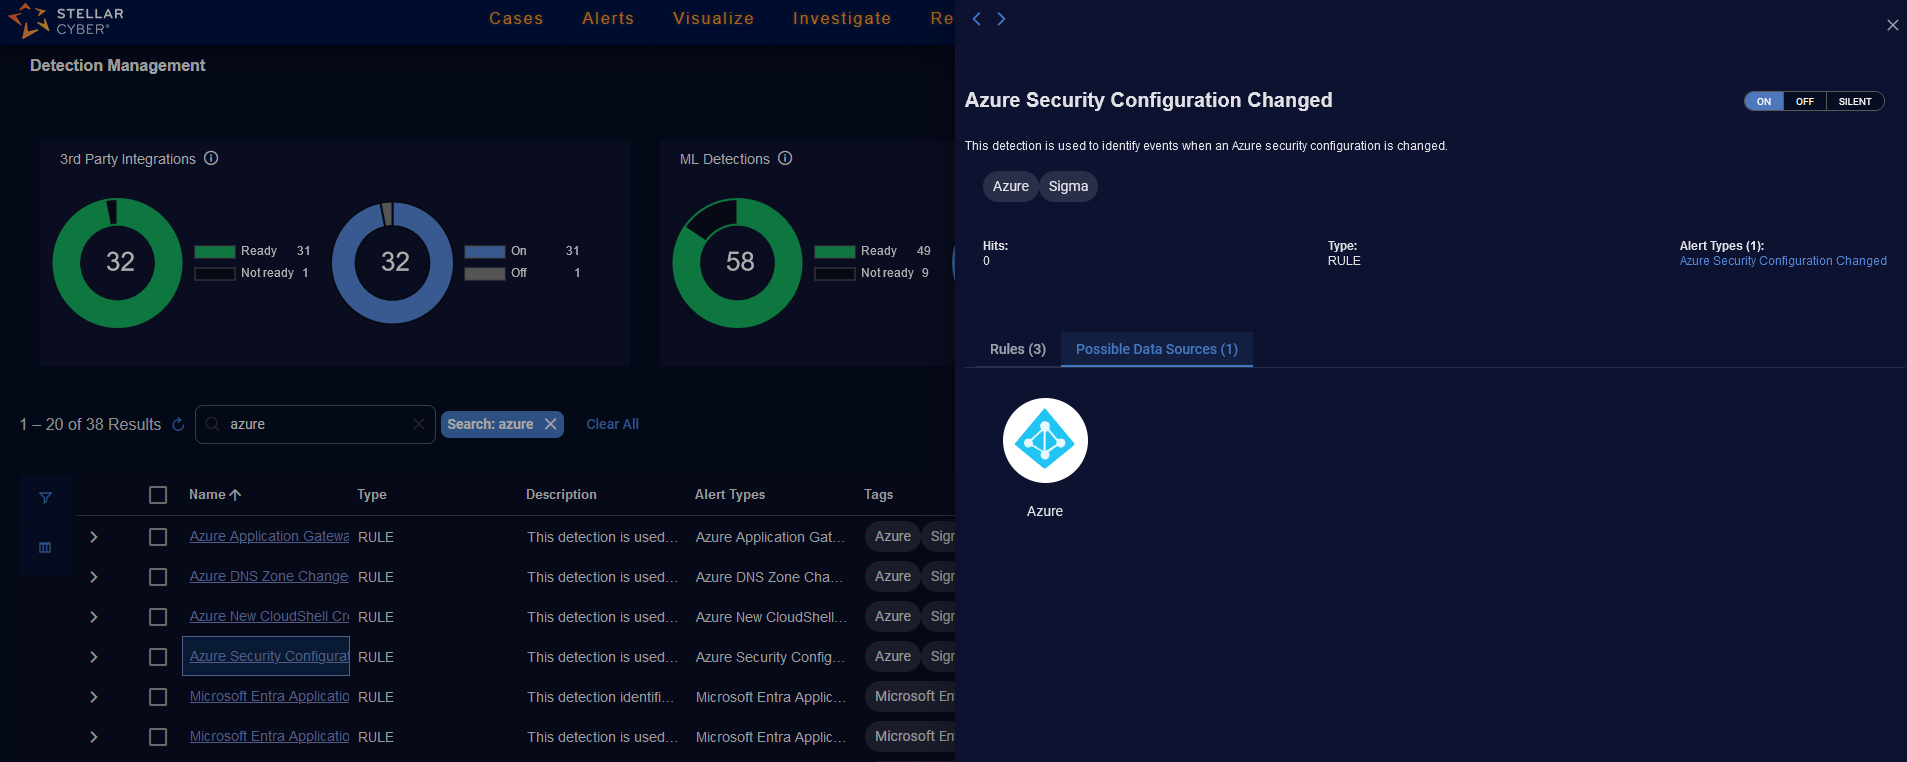
Then when you click the Possible Data Sources tab, the panel lists icons of the Possible Data Sources and their count.
Detection Panel for Sigma Rules
When you click the Rules tab in a Sigma rule type of detection, there is the following information:
-
check box to select all rules. If you select all rules, you can change the state on all rules at the same time to ON, OFF, or SILENT.
To deselect all the rules, check the check box again.
-
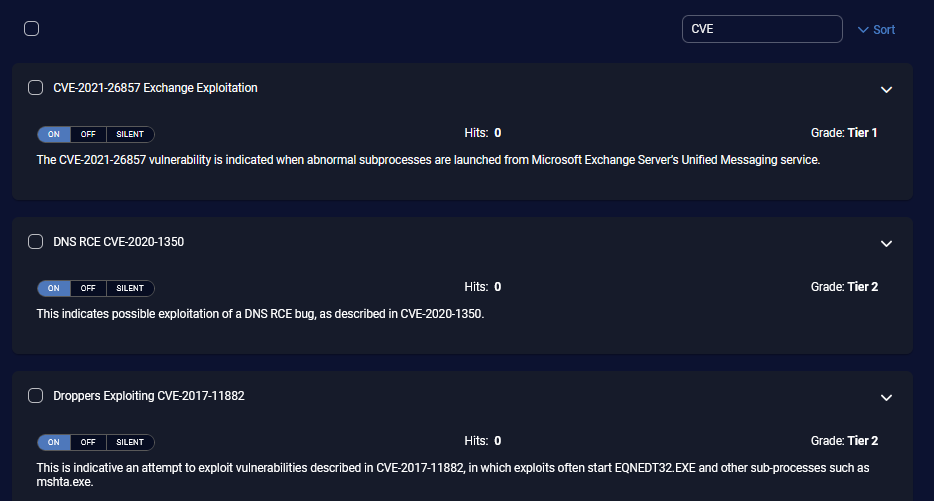
Search rules box in which you can enter a search string, for example, CVE.
-
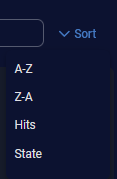
Sort, in which you can sort the rules as follows:
-
A-Z—alphabetic sort, in ascending order
-
Z-A—alphabetic sort, in descending order
-
Hits—numeric sort, in descending order (from the highest number of hits to the lowest)
-
State—OFF, ON, SILENT
-
-
pagination icons at the bottom for next and previous, and first and last pages, if there are many rules

The Rules tab has the following information for the individual rules in the detection:
-
check box to select an individual rule
-
Toggle for ON, OFF, or SILENT
-
Hits count of the number of alerts triggered
-
Grade of Tier1, Tier2, or Experimental
-
description of the individual rule
-
icon to expand the individual rule (
 )
)
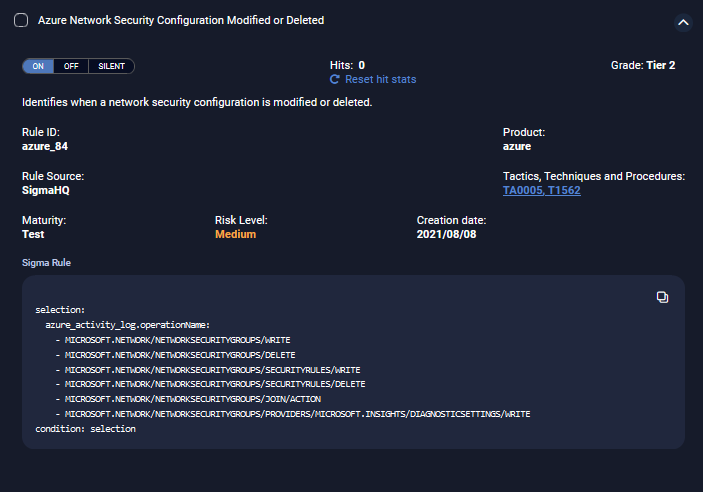
The expanded rule has the following information for an individual rule:
-
Reset hit stats button. When selected, a confirmation warning is displayed:
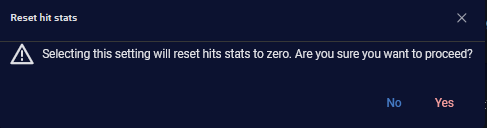
If the hits are reset, a successful message is displayed:

-
Rule ID—Stellar Cyber rule ID
-
Product—product, such as AWS, Azure, or Windows, or Category, such as process_creation
-
Rule Source—rule source, such as SigmaHQ or developed internally by Stellar Cyber
-
Tactics, Techniques and Procedure—links to https://attack.mitre.org/ for tactics or techniques
-
Maturity—maturity status as follows:
-
Production—for rules that are reliable in a production environment
-
Stable—for rules that have had one year of use
-
Test—for rules that have had months of use
-
Experimental—for new rules
-
-
Risk Level—color-coded risk level as follows:
-
Low—yellow
-
Medium—orange
-
High—red
-
-
Creation date—date the rule was created
-
Sigma Rule—Sigma rule, with Copy button
Using the Settings Page
Click the gear icon (![]() ) at the top right of the Detection Management page to open the Settings page.
) at the top right of the Detection Management page to open the Settings page.
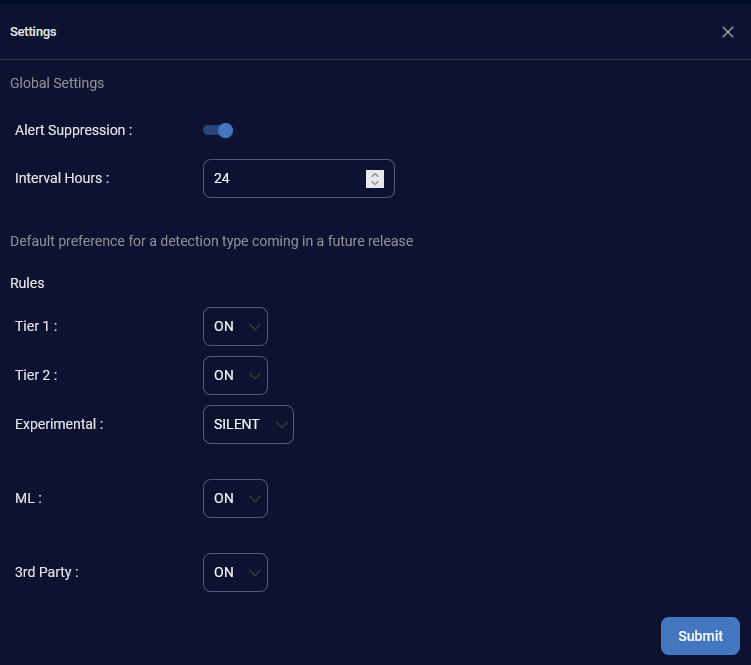
The Settings page has two parts. Use this page to configure alert suppression and interval hours, and to manage how new detections are integrated into your system.
Configuring Alert Suppression
To minimize excessive alerting, each alert type is triggered only once in a configurable period (from 1 to 24 hours) for the set of attributes that triggered that specific alert.
To configure Alert Suppression and Interval Hours:
-
Alert Suppression is on by default. To turn it off, click the toggle.
-
If Alert Suppression is on, select the Interval Hours from 1 hour to 24 hours. The default is 24 hours.
-
Click Submit to save the settings.
Alert Suppression Process
This section further explains the alert suppression process summarized in the sentence: To minimize excessive alerting, each alert type is triggered only once in a configurable period (from 1 to 24 hours) for the set of attributes that triggered that specific alert.
The set of attributes are the detected fields in an alert type. Examples include srcip, dstport, OrganizationId, tenant_id, and file_path. Refer to the Alert Type Model Summary.
The process is as follows:
-
The set of attributes reaches the alert threshold.
-
Stellar Cyber checks if an alert with the same set of attributes has already been triggered within the past X hours.
-
If yes, suppress (do not report) the current alert.
-
If no, report the alert.
-
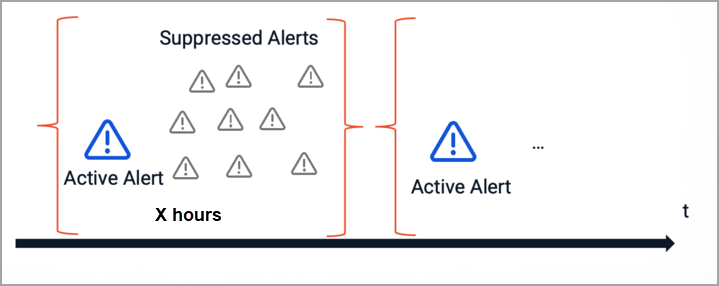
For example, if the detection is based on the source IP address and the alert suppression period is set to 6 hours, then alerts for the same source IP address will only be reported if their timestamps are more than 6 hours apart.
The following diagram shows that the alerts with similar detected field attributes are suppressed.
Configuring Default Preferences
The Default preference for a detection type coming in a future release are preferences for any new detections or rules coming in a future release. These preferences do not impact existing detections.
To configure Default preference for a detection type coming in a future release:
-
For Rules, you can change the preferences based on the grade:
-
Tier 1—ON, OFF, or SILENT. The default is ON.
-
Tier 2—ON, OFF, or SILENT. The default is ON.
-
Experimental—ON, OFF, or SILENT. The default is SILENT.
-
-
For ML detections, you can change the preferences to ON or OFF. The default is ON.
-
For 3rd Party detections, you can change the preferences to ON or OFF. The default is ON.
-
Click Submit to save the settings.
