Configuring Netskope Connectors
This connector allows Stellar Cyber to collect data from external sources and add the records to the data lake.
Netskope integration with Stellar Cyber enables organizations to monitor and protect their cloud environment, providing real-time threat intelligence and automated response workflows to improve incident response and threat mitigation.
There can be any number of Netskope connectors active.
In addition, you can use Netskope responders to configure Webhook actions that can be triggered manually or that can enhance Automated Threat Hunting (ATH) actions.
Netskope responders use Webhook templates that support actions. Each action is one responder, there are six actions, and hence there are six Netskope responders: Netskope Add Destination To Block List, Netskope Quarantine User From Private Application, Netskope Quarantine User From Web Application, Netskope Release Quarantine For User From Private Application, Netskope Release Quarantine For User From Web Application, and Netskope Remove Destination From Block List.
This document describes how to configure a Netskope responder using the Universal Webhook Responder, how to add the respond function to a Netskope connector and how to manually trigger an action and perform ATH actions with a Netskope responder.
Stellar Cyber connectors with the Collect function (collectors) may skip collecting some data when the ingestion volume is large, which potentially can lead to data loss. This can happen when the processing capacity of the collector is exceeded.
Connector Overview: Netskope
Capabilities
-
Collect: Yes
-
Respond: Webhook actions

-
Native Alerts Mapped: Yes
-
Runs on: DP
-
Interval: Configurable
Collected Data
|
Content Type |
Index |
Locating Records |
|---|---|---|
|
Alert Event Incident Network Page POPs Tunnels |
Syslog
|
msg_class: netskopewsg_alert netskopewsg_event netskopewsg_incident netskopewsg_network netskopewsg_page netskopewsg_pops netskopewsg_tunnels |
Domain
|
https://<Netskope Tenant Name>.goskope.com where <Netskope Tenant Name> is a variable from the configuration of this connector |
Response Actions
Webhook action templates:![]()
-
Netskope Add Destination To Block List
-
Netskope Quarantine User From Private Application
-
Netskope Quarantine User From Web Application
-
Netskope Release Quarantine For User From Private Application
-
Netskope Release Quarantine For User From Web Application
-
Netskope Remove Destination From Block List
Prerequisites
To use the Add/Remove Destination action, create a Destination Profile via the Netskope API and create a real-time policy in the Netskope portal. The Add/Remove Destination action then requires the Destination Profile ID as a parameter.
To use the Quarantine User Private Application action, provide the private application name, the template name, and the user’s email address. The private application name and template name can be obtained via the Netskope API.
To use the Quarantine User Web Application action, create a real-time policy in the Netskope portal to block traffic.
Third Party Native Alert Integration Details
This connector ingests logs from Netskope to get the raw alerts that are stored in the Syslog index. Select the Alert content type.
Stellar Cyber maps Netskope alerts. The alerts are read from the Syslog index, enriched with Stellar Cyber fields, and mapped (with deduplication) to the Alerts index.
Deduplication is by the following fields:
-
All types—
tenantid,user.name,host.name, andnetskopewsg._event_id
-
Breach—
tenantid,user.name,netskopewsg.breach_id -
Connection—
tenantid,user.name,netskopewsg.connection_id -
Malsite—
tenantid,user.name,netskopewsg.malsite_id
The following types are supported:
-
Netskope Alert
-
Netskope Alert (Breach)
-
Netskope Alert (Connection)
-
Netskope Alert (Malsite)
For details, see Integration of Third Party Native Alerts.
Required Credentials and Configurations
-
For Collect: Netskope Tenant Name and API Key
-
For Respond: Hostname, Protocol, and API Key
Locating Records
To search the alerts in the Alerts index or to search the Original Records in the Syslog index, use the queries:
-
msg_class: netskopewsg_alert AND NOT netskopewsg.type: (breach OR connection OR malsite) AND _exists_: event.threat.name
-
msg_class: netskopewsg_alert AND netskopewsg.type: breach
-
msg_class: netskopewsg_alert AND netskopewsg.type: connection
-
msg_class: netskopewsg_alert AND netskopewsg.type: malsite
Adding a Netskope Connector
To add a Netskope connector:
- Obtain your Netskope credentials (Collect)
- Obtain your Netskope credentials (Respond)
- Add the connector in Stellar Cyber (Collect)
- Add the connector in Stellar Cyber (Respond)
- Test the connector
- Verify ingestion
- Use actions
Obtaining your Netskope Credentials (Collect)
Before you configure the connector in Stellar Cyber, you must obtain an API token from Netskope.
Default Method
Use Netskope’s RESTful API token generation workflow under the Role-Based Access Control (RBACv3) framework to create API tokens.
-
Follow the guidance in the Netskope Service Account and Role documentation for Administrators RBAC V3.
-
Specify the roles needed for the integration.
Legacy Method
-
Log in as an administrative user to the Netskope Admin Console, for example: https://netskope-tech.okta.com/app/UserHome.
-
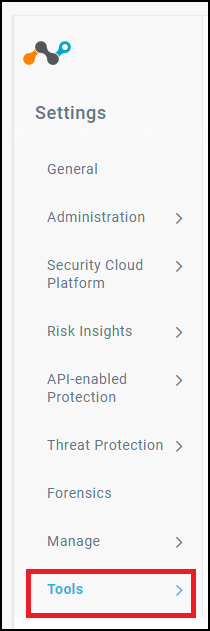
Choose Settings.
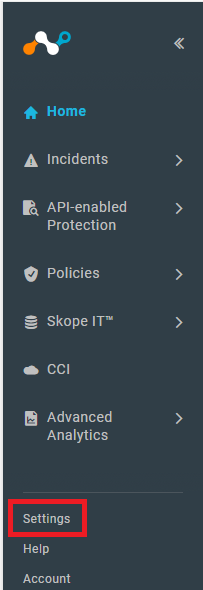
-
Choose Tools.
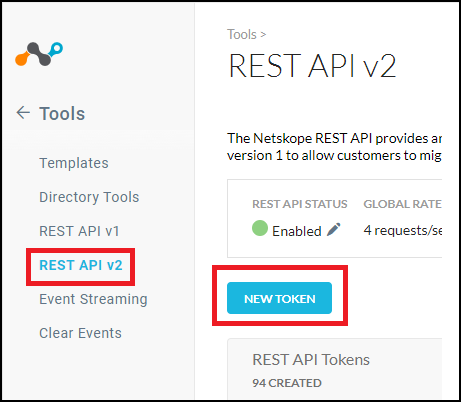
-
Choose REST API v2 to get an API token for all the available content types. Then choose NEW TOKEN.
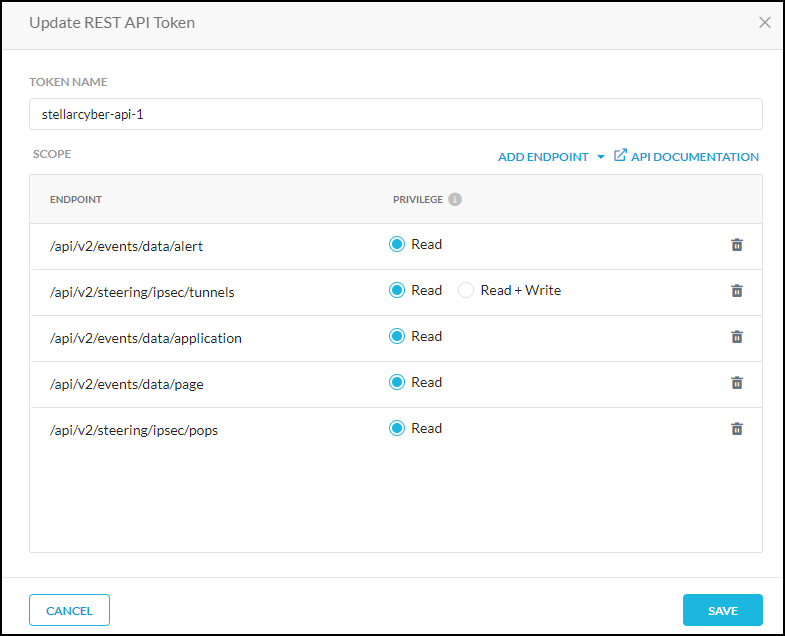
The following endpoints are supported:
-
/api/v2/events/data/alert (supports data types: policy, dlp, watchlist)
-
/ api/v2/events/data/application (supports data type: application)
-
/api/v2/events/datasearch/incident (supports data type: incident)
-
/api/v2/events/data/network (supports data type: network)
-
/api/v2/events/data/page (supports data type: page)
-
/api/v2/steering/ipsec/pops (supports data type: pops)
-
/api/v2/steering/ipsec/tunnels (supports data type: tunnels)
-
-
Select the privilege for the endpoints you want to select. At a minimum, select Read. For example:
-
Click Save.
Obtaining Netskope Credentials (Respond)
Before you configure the connector in Stellar Cyber, you must obtain the following Netskope credentials:
-
Hostname—The Hostname for API access. The default is: expert-line.eu.goskope.com. Do not include http or https in the Hostname.
-
Protocol—The protocol used by the hostname. The options are HTTP or HTTPS. If you select HTTPS, another field is available: Disable SSL Certificate Verification.
-
API Key—The authentication credential. Follow the guidance in the Netskope Administrators RBAC V3 document for REST API Auth Settings.
Adding the Connector in Stellar Cyber (Collect)
With the configuration information handy, you can add the Netskope connector in Stellar Cyber:
-
Log in to Stellar Cyber.
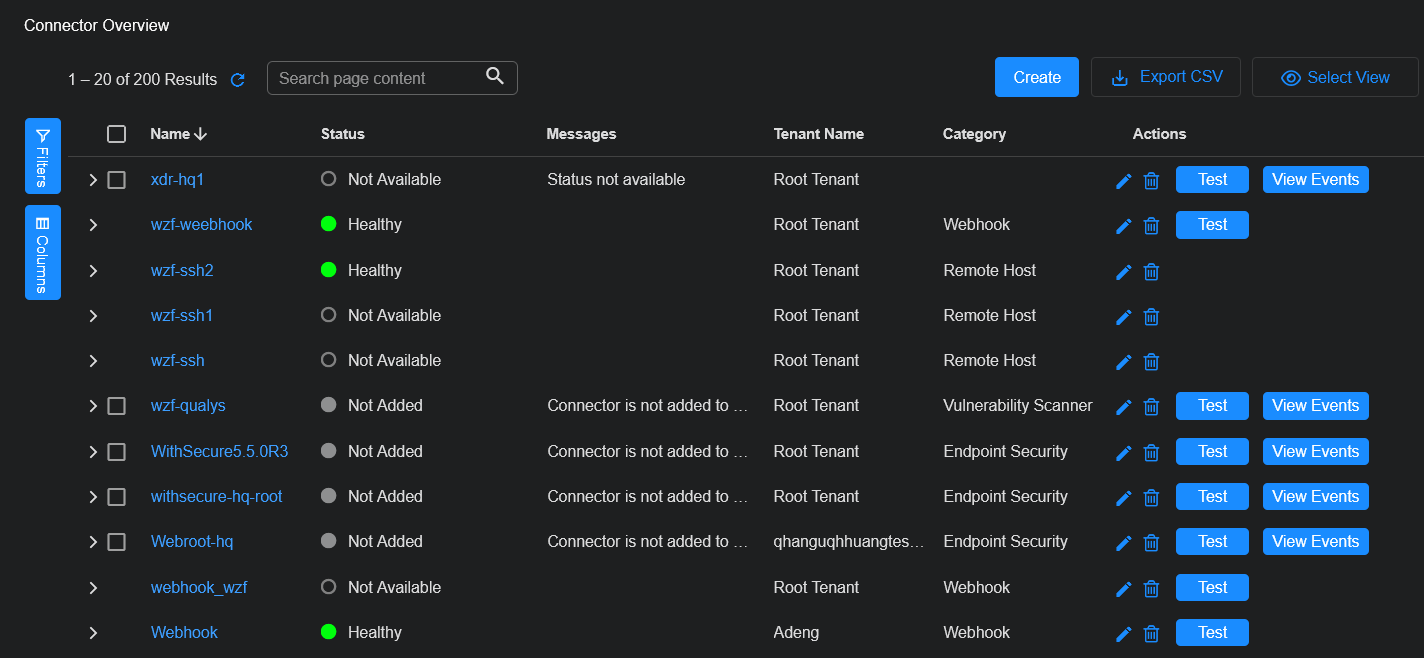
-
Click System | INTEGRATIONS | Connectors. The Connector Overview appears.
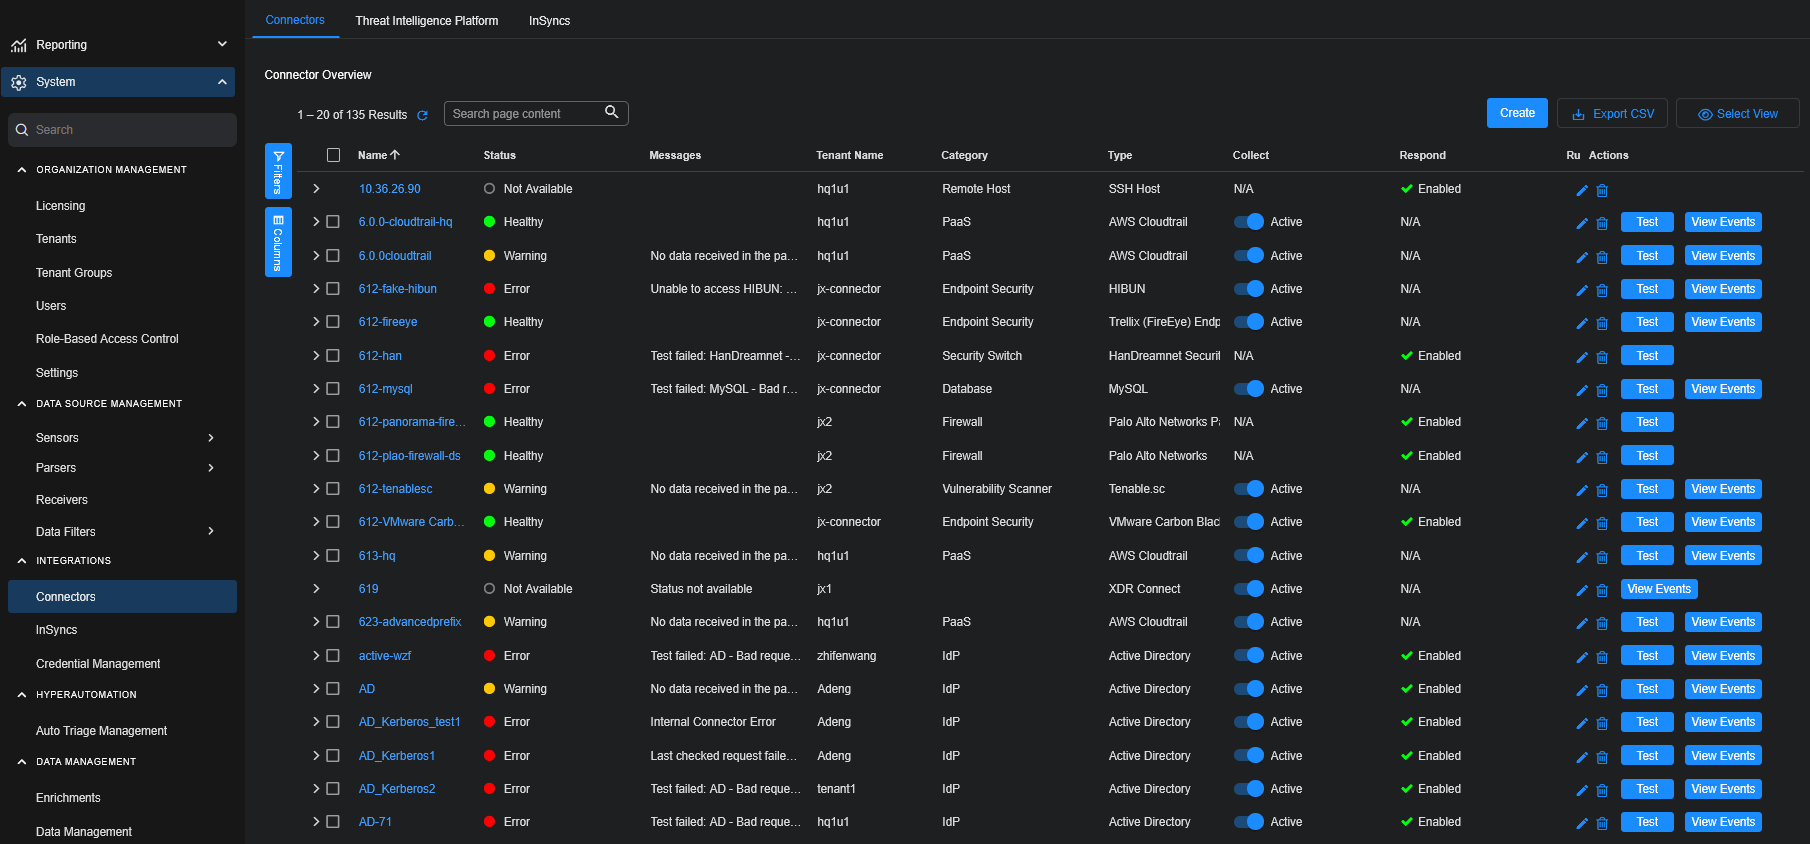
-
Click Create and select Connector.
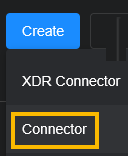
The General tab of the Add Connector screen appears. The information on this tab cannot be changed after you add the connector.
-
Choose Web Security from the Category dropdown.
-
Choose Netskope from the Type dropdown.
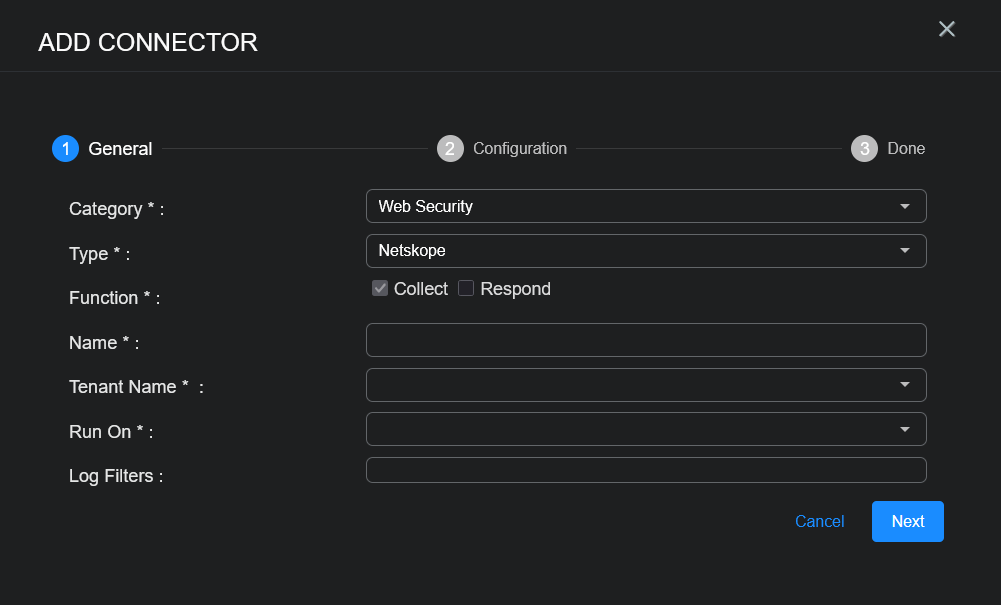
The asterisk (*) indicates a required field.
-
For this connector, the supported Function is Collect, which is enabled already.
-
Enter a Name. This field is required, and does not accept multibyte characters.
-
Choose a Tenant Name.
Notes:- This field does not accept multibyte characters.
- It is recommended that you follow a naming convention such as tenantname-connectortype.
-
Choose the device on which to run the connector.
-
(Optional) When the Function is Collect, you can apply Log Filters. For information, see Managing Log Filters.
-
Click Next. The Configuration tab appears.
-
The V2 Netskope API Version is already selected.
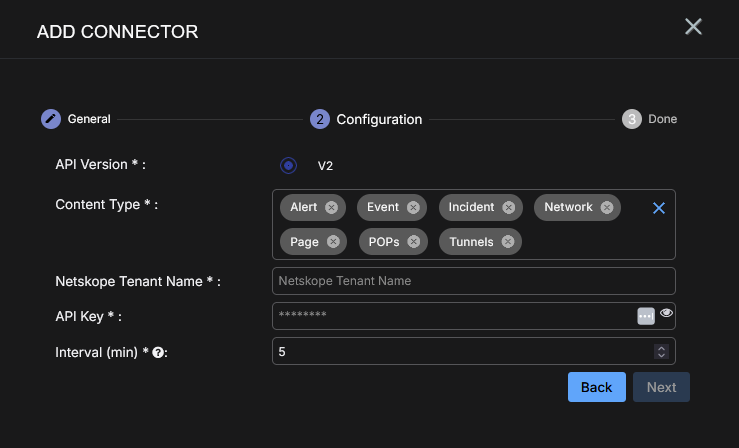
The asterisk (*) indicates a required field.
-
Choose the Content Type you would like to collect. The logs for Alert, Event, Incident, Network, Page, POPs, and Tunnels are supported.
-
Enter the Netskope Tenant Name, for example, companya.
Do not enter a full URL, for example, companya.goskope.com.
-
Enter the API Key you noted above in Obtaining your Netskope Credentials (Collect).
-
Choose the Interval (min). This is how often the logs are collected. The default interval is 5 minutes.
The logs for POPs and Tunnels are queried every 24 hours.
-
Choose the Interval (min). This is how often the logs are collected.
-
Click Next. The final confirmation tab appears.
-
Click Submit.
The new connector is immediately active.
Adding the Connector in Stellar Cyber (Respond)
To add the respond function for a Netskope connector in Stellar Cyber:
-
Log in to Stellar Cyber.
-
Click System | INTEGRATIONS | Connectors. The Connector Overview appears.
-
Click Create and select Connector.
The General tab of the Add Connector screen appears. The information on this tab cannot be changed after you add the connector.
-
Choose Webhook from the Category dropdown.
-
Choose one of the predefined templates from the Type dropdown: Netskope Add Destination To Block List, Netskope Quarantine User From Private Application, Netskope Quarantine User From Web Application, Netskope Release Quarantine For User From Private Application, Netskope Release Quarantine For User From Web Application, and Netskope Remove Destination From Block List.
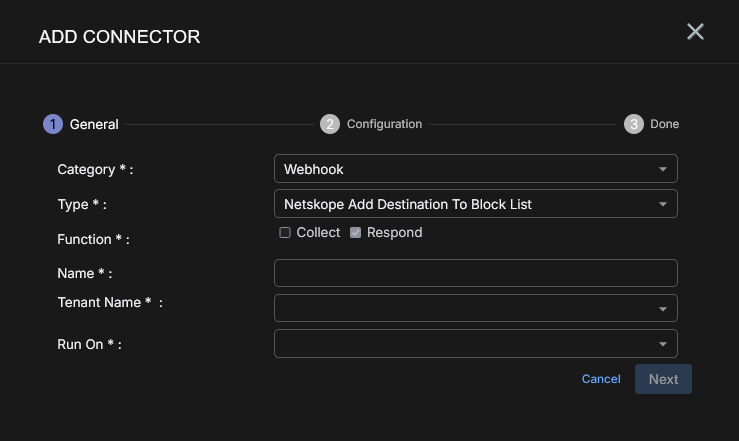
The asterisk (*) indicates a required field.
-
For this connector, the supported Function is Respond, which is enabled already.
-
Enter a Name.
Notes:- This field does not accept multibyte characters.
- It is recommended that you follow a naming convention such as tenantname-connectortype.
-
Choose a Tenant Name. This identifies which tenant is allowed to use the connector. In addition to specific tenants, this connector supports All Tenants, which means that a Netskope responder can be used across tenants.
-
Choose the device on which to run the connector.
-
Certain connectors can be run on either a Sensor or a Data Processor. The available devices are displayed in the Run On menu. If you want to associate your collector with a sensor, you must have configured that sensor prior to configuring the connector or you will not be able to select it during initial configuration.
-
If the device you're connecting to is on premises, we recommend you run on the local sensor. If you're connecting to a cloud service, we recommend you run on the DP.
-
-
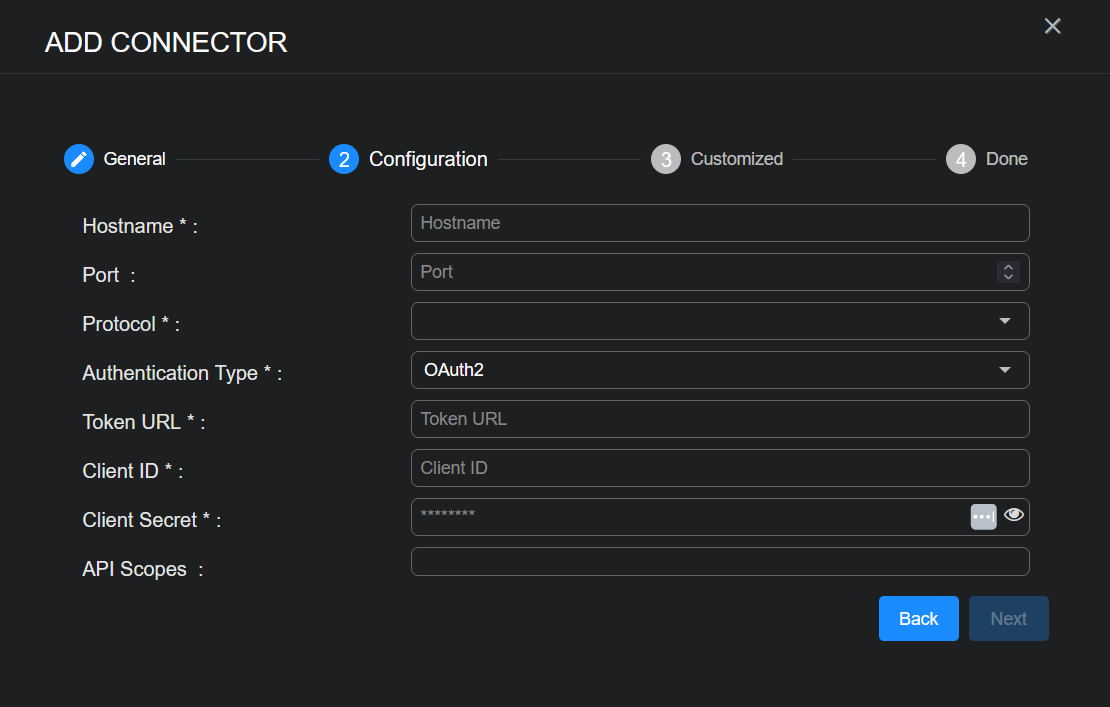
Click Next. The Configuration tab appears.
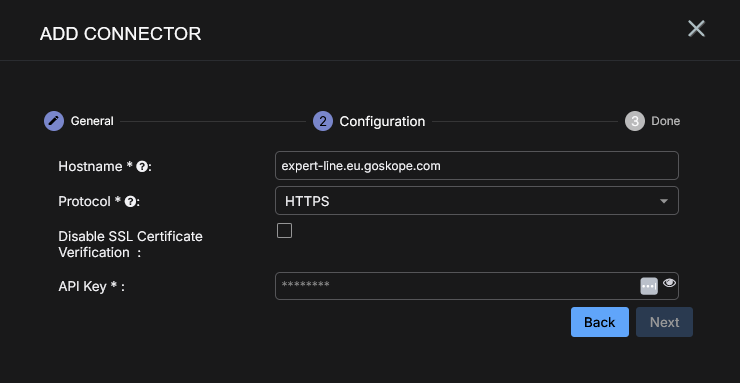
The asterisk (*) indicates a required field.
-
Enter the Hostname. The default is expert-line.eu.goskope.com.
Do not include http or https in the Hostname.
-
Select the Protocol, either HTTP or HTTPS, which is used by the Hostname. If you select HTTPS, another field is available: Disable SSL Certificate Verification.
-
(Optional) Click Disable SSL Certificate Verification if you want to disable SSL certificate verification. Only disable SSL certificates if you have a necessary reason to, otherwise, it is not a good security practice and may expose the connection to security risks.
-
Enter the API Key you noted above in Obtaining your Netskope Credentials (Respond).
-
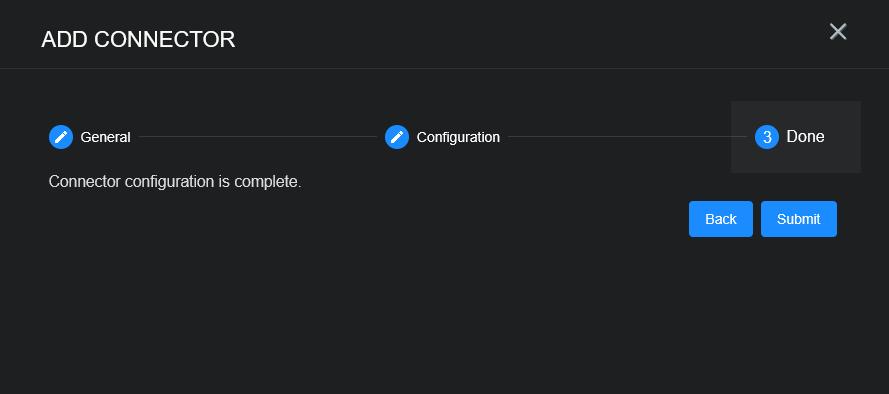
Click Next. The final confirmation tab, Done, appears.
-
Click Submit.
Testing the Connector
When you add (or edit) a connector, we recommend that you run a test to validate the connectivity parameters you entered. The test validates authentication and connectivity.
For connectors running on a sensor, Stellar Cyber recommends that you allow 30-60 seconds for new or modified configuration details to be propagated to the sensor before performing a test.
-
Click System | INTEGRATIONS | Connectors. The Connector Overview appears.
-
Locate the connector by name that you added, or modified, or that you want to test.
-
Click Test at the right side of that row. The test runs immediately.
Note that you may run only one test at a time.
Stellar Cyber conducts a basic connectivity test for the connector and reports a success or failure result. A successful test indicates that you entered all of the connector information correctly.
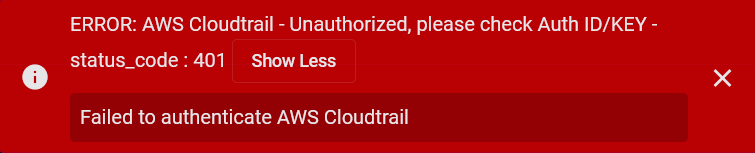
To aid troubleshooting your connector, the dialog remains open until you explicitly close it by using the X button. If the test fails, you can select the button from the same row to review and correct issues.
The connector status is updated every five (5) minutes. A successful test clears the connector status, but if issues persist, the status reverts to failed after a minute.
Repeat the test as needed.

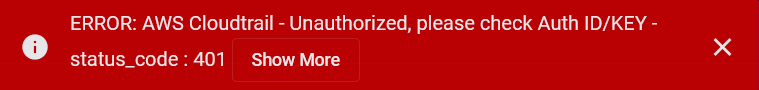
If the test fails, the common HTTP status error codes are as follows:
| HTTP Error Code | HTTP Standard Error Name | Explanation | Recommendation |
|---|---|---|---|
| 400 | Bad Request | This error occurs when there is an error in the connector configuration. |
Did you configure the connector correctly? |
| 401 | Unauthorized |
This error occurs when an authentication credential is invalid or when a user does not have sufficient privileges to access a specific API. |
Did you enter your credentials correctly? Are your credentials expired? Are your credentials entitled or licensed for that specific resource? |
| 403 | Forbidden | This error occurs when the permission or scope is not correct in a valid credential. |
Did you enter your credentials correctly? Do you have the required role or permissions for that credential? |
| 404 | Not Found | This error occurs when a URL path does not resolve to an entity. | Did you enter your API URL correctly? |
| 429 | Too Many Requests |
This error occurs when the API server receives too much traffic or if a user’s license or entitlement quota is exceeded. |
The server or user license/quota will eventually recover. The connector will periodically retry the query. If this occurs unexpectedly or too often, work with your API provider to investigate the server limits, user licensing, or quotas. |
For a full list of codes, refer to HTTP response status codes.
Verifying Ingestion
To verify ingestion:
-
Select Threat Hunting.
The Interflow Search tab appears.
-
Change the Indices to Syslog.
The table immediately updates to show ingested Interflow records.
Manually Triggering an Action
To manually trigger an action with a Netskope responder:
-
Select Threat Hunting.
The Interflow Search tab appears.
-
Change the Indices for the record type, for example, Syslog.
-
Scroll down the page and click the icon for More Info in the Actions column.
-
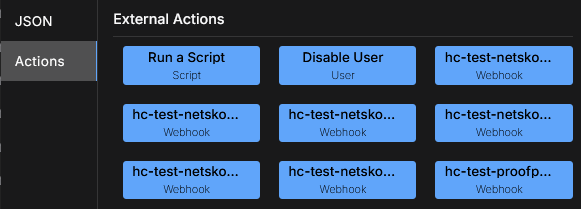
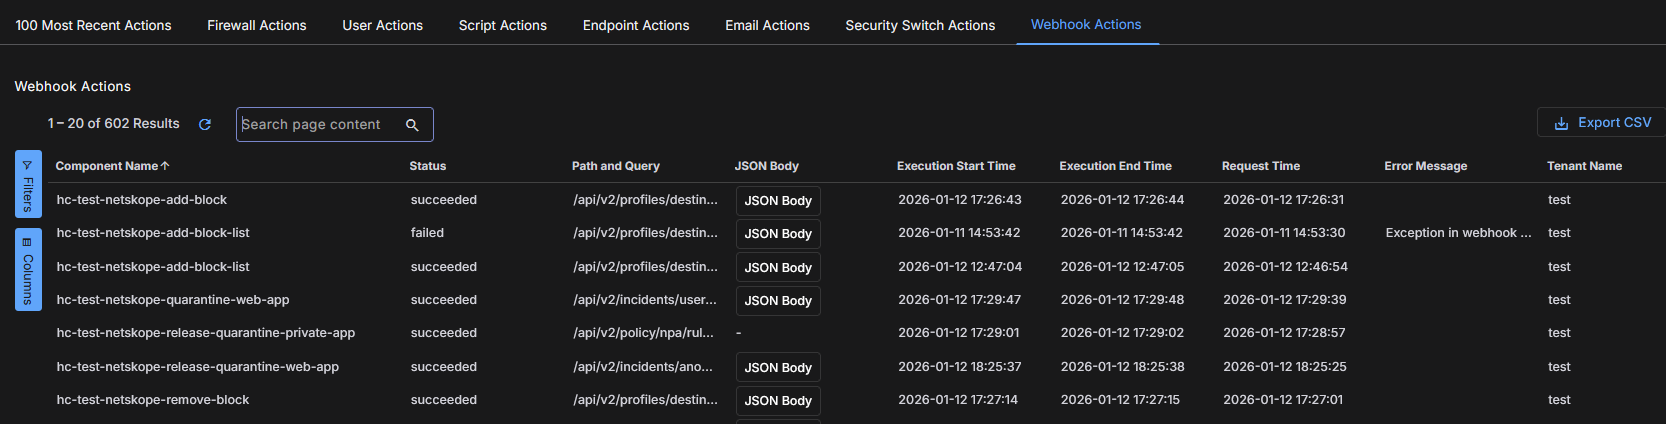
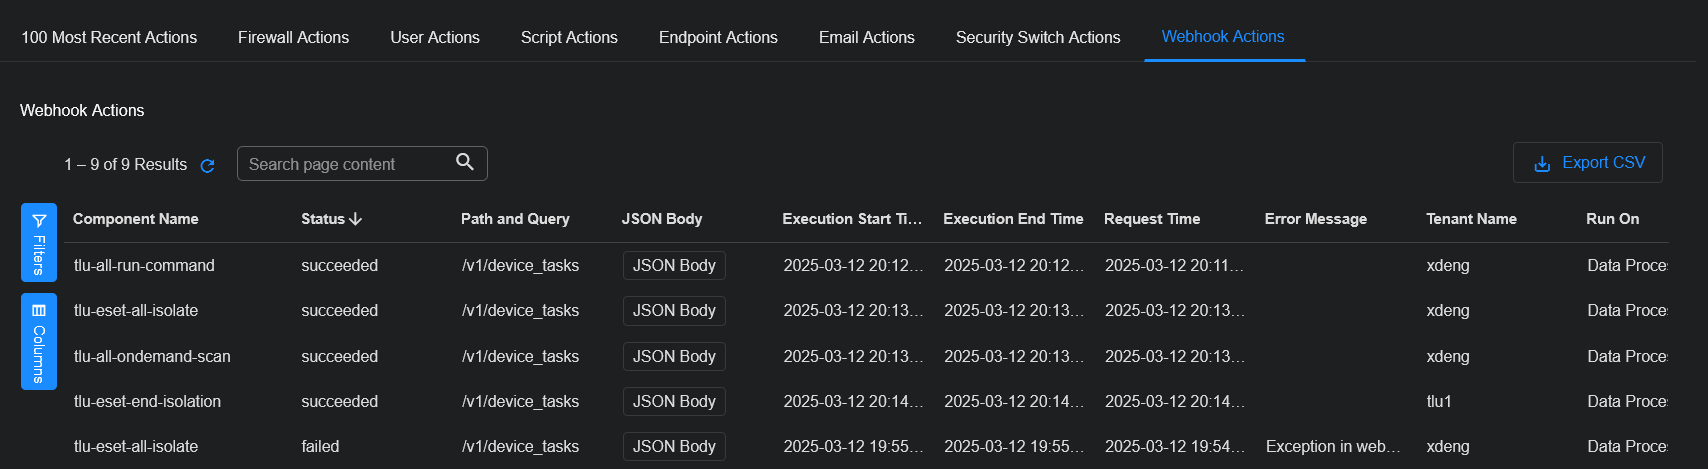
Click the Actions tab. Webhook actions appear under External Actions.
-
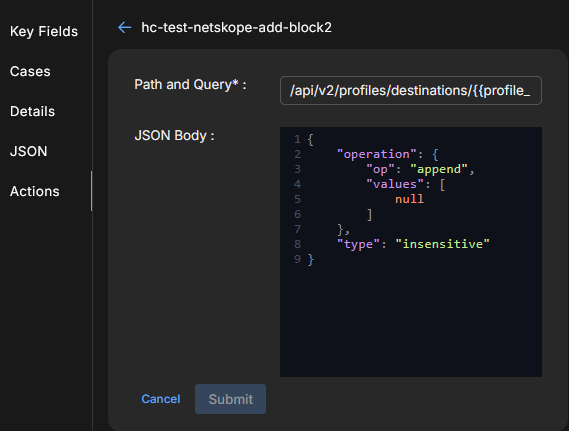
Click a Netskope Webhook action.
The template populates the fields in the Path and Query and the JSON Body.
-
You can modify the JSON Body by entering string values or curly brace expressions.
-
To perform the action, click Submit.
Performing an ATH Action
To perform an ATH action with a Netskope responder:
-
Click Automation | Automation.
-
Click Create.
-
Scroll down to Actions.
-
Click the button to add an action. Another action appears below the existing action.
-
Select the Trigger on condition.
-
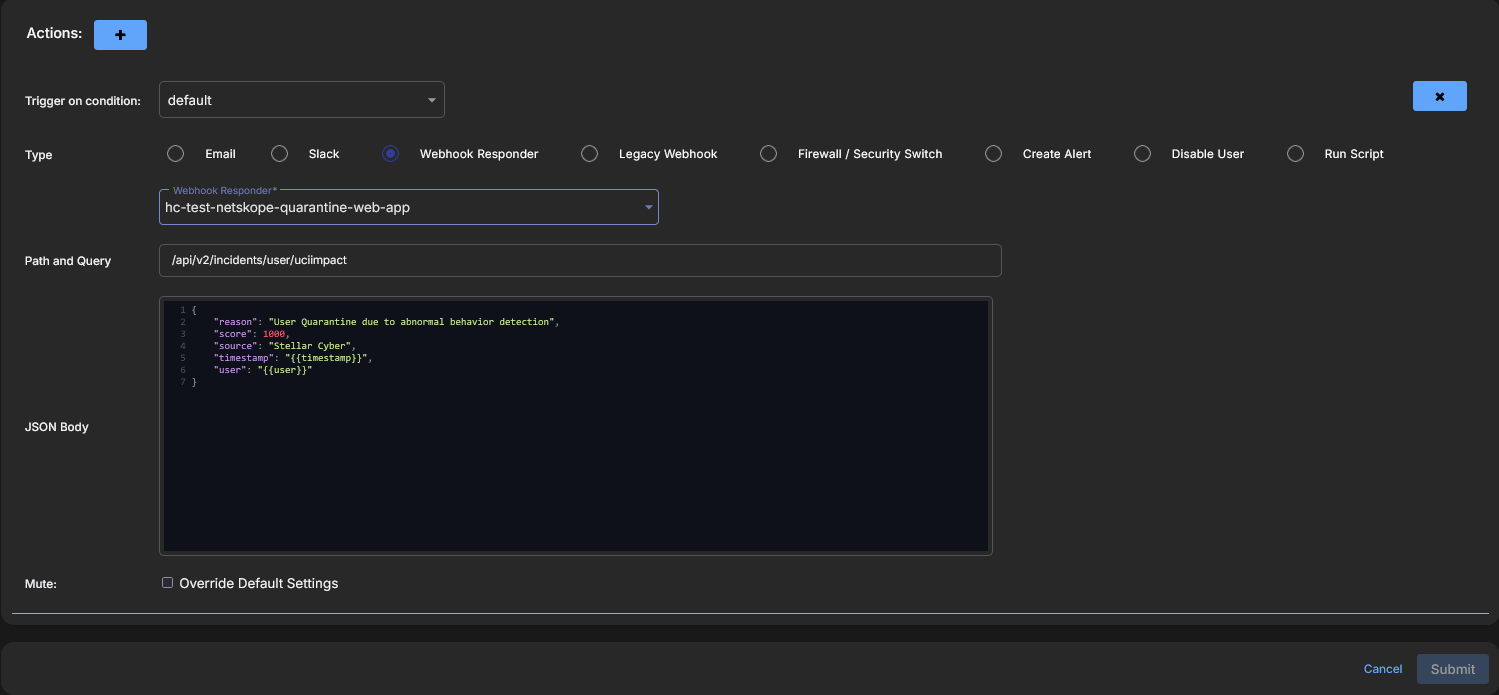
Select Webhook Responder for the Type.
-
Select a previously configured Netskope responder from the dropdown menu for the Webhook Responder.
The template populates the fields in the Path and Query and JSON Body.
-
You can modify the JSON Body by entering string values or curly brace expressions.
-
(Optional) Click Override Default Settings to override the playbook's mute settings and mute just this action.
-
Click Submit.
