Working with Dashboards
 Learn more at Stellar Cyber Academy.
The following link takes you to a course on the Stellar Cyber Academy technical training portal where you can learn more about this topic by watching the suggested lessons.
P09 Creating Dashboards and Reports in Stellar Cyber (30m:00s)
 PART 1: Working with Dashboards and Reports in Stellar Cyber (06m:00s)
Learn how dashboards in the Stellar Cyber Platform provide real-time insights by aggregating data from multiple sources. Understand how visual elements like heat maps support threat detection, while reports deliver structured insights for compliance and operational summaries.
PART 2: Using Dashboards and Reports for Threat Detection and Remediation in Stellar Cyber (07m:30s)
Discover how dashboards centralize security data for faster incident triage and threat response. Explore prebuilt dashboards for compliance and vulnerabilities, and see how exporting reports communicates findings to stakeholders.
PART 3: DEMO: Creating and Scheduling Custom Reports and Dashboards in Stellar Cyber (12m:45s)
Watch a demonstration of creating custom reports and dashboards. See how to edit queries using the Query Builder, create data visualizations, and export reports as CSV or PDF files.
The first time you access a link on the portal during a session, you must log in to access content.
Stellar Cyber stores a vast amount of information that must be sorted, sifted, and presented clearly to be actionable. The Dashboards Hub (Dashboards | CREATION | Dashboards) is the starting point for working with dashboards. From the Hub you can locate and open any dashboard, create new custom dashboards, and manage existing ones. Custom dashboards let you define and view data on activity in your network in ways that accelerate comprehension through visual clarity and clean design. You control which components to include—various types of charts, text boxes, counters, heatmaps, and tables—and you determine their number, placement, and layout within each dashboard.
Filters at the top left of this page are applied when you're viewing a dashboard. They are not applicable for filtering dashboards that have objects related to the filters.
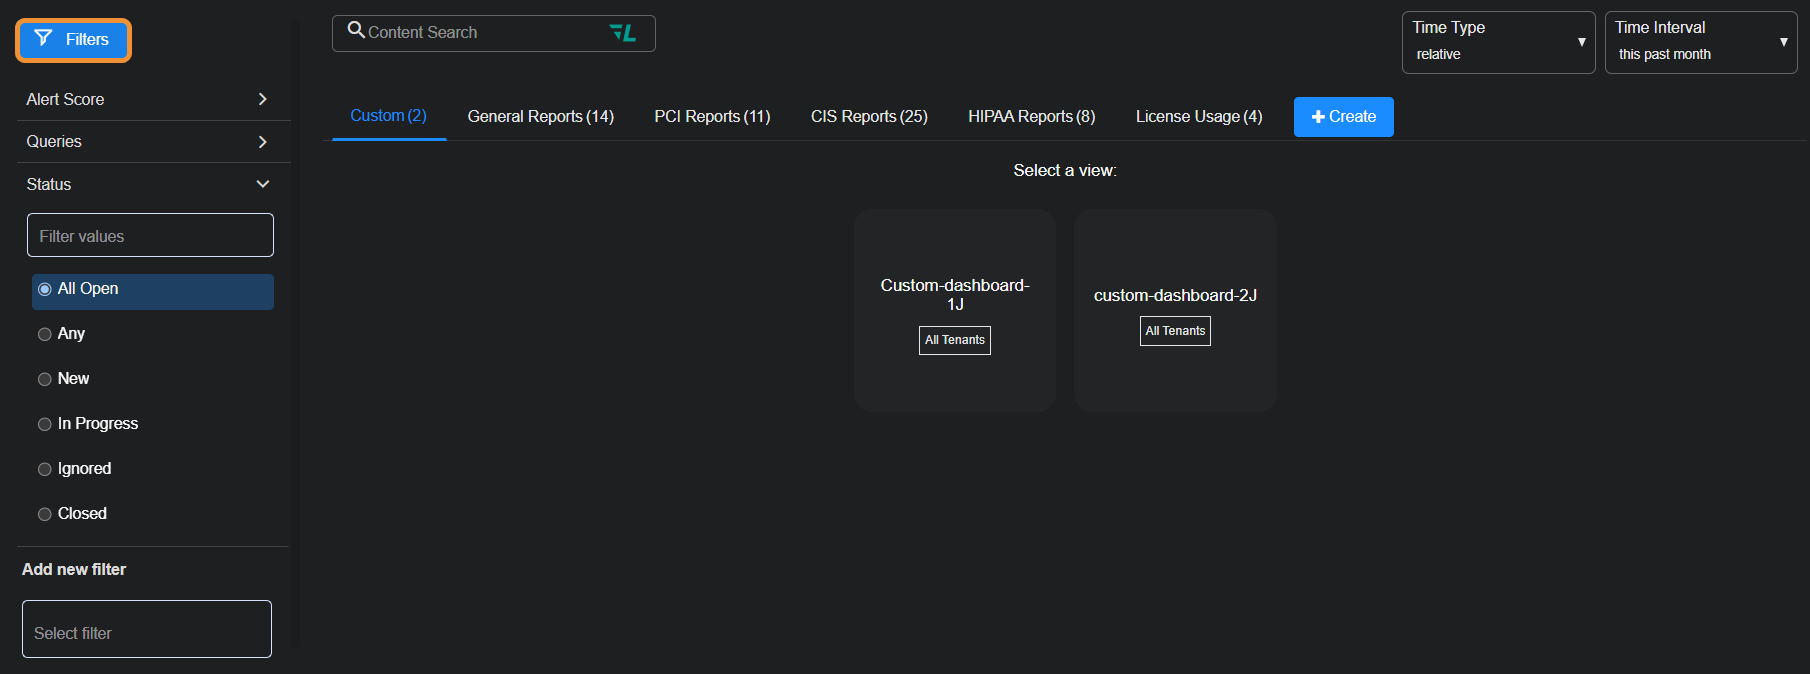
You can define custom dashboards, add components—charts, text boxes, counters, heatmaps, and tables—to display data you find relevant, share your custom dashboards, and view predefined dashboards. All dashboards are accessible from the Dashboards Hub, which organizes them into the following categories:
Access to Dashboards, Widgets, and Charts
Stellar Cyber controls access to dashboards, reports, and individual charts based on the scope of your user account, the privileges assigned to your user role, and the deployment type of your Stellar Cyber Platform. Content that you are not permitted to see is removed from the interface rather than displayed in a disabled state.
Access is evaluated at three levels: the dashboard, the individual widget within a dashboard, and the chart template used by a widget. Each level is evaluated in order. If access is denied at one level, the levels below it are not evaluated.
The same rules apply consistently in the Dashboards Hub, on a dashboard that is open in View mode, in the Dashboard editing canvas, on the Reports pages, and in generated PDF and CSV output.
The following table describes how a restriction at each level appears in the interface.
|
Level |
What You See When Access Is Denied |
|---|---|
| Dashboard | The dashboard is not listed. Opening a direct link to the dashboard displays the Dashboard Not Found page. Generating a PDF of the dashboard is refused. |
| Widget | The widget does not appear on the dashboard at all, in either the viewer or a generated PDF. |
| Chart | The widget remains on the dashboard, and the chart area displays a lock icon and a Permission Denied message. Stellar Cyber does not request any data for a restricted chart. |
The combined outcomes are as follows.
|
Dashboard |
Widget |
Chart |
Result |
|---|---|---|---|
| Denied | — | — | The dashboard is unavailable in the dashboard list, through a direct link, and in PDF output. |
| Allowed | Denied | Any | The widget is hidden. |
| Allowed | Allowed | Denied | The widget appears, and the chart area displays Permission Denied. |
| Allowed | Allowed | Allowed | The content displays normally. |
Chart templates that you cannot access are also removed from the Add widgets panel and from the template list in the Chart Builder.
These restrictions apply in addition to the sharing permissions that you assign to a custom dashboard. For information about how sharing permissions combine with the privileges in your user role, see How Sharing Combines with Role Privileges. For the restrictions that apply to license content, see License Usage Reports.
Custom Dashboards
With custom dashboards you can create, use, and share visualizations in the following ways:
- See an existing custom dashboard
- Create a new custom dashboard
- Edit a custom dashboard
- Delete a custom dashboard
- Clone (and then customize) an existing dashboard
- Export a dashboard as a PDF
- Export a dashboard as a configuration
- Import a dashboard
See an Existing Dashboard
To see an existing dashboard:
-
Select Dashboards | CREATION | Dashboards to open the Dashboards Hub.
-
Locate the dashboard using the Recent section, the Explore section, or the All Dashboards table. To show only custom dashboards, select the Custom category filter in the All Dashboards section.
-
Select the dashboard name to open it.
Stellar Cyber displays your selection.
Create a New Dashboard
To add a new custom dashboard:
-
Select Dashboards | CREATION | Dashboards.
-
Select + Create | Add New Dashboard.
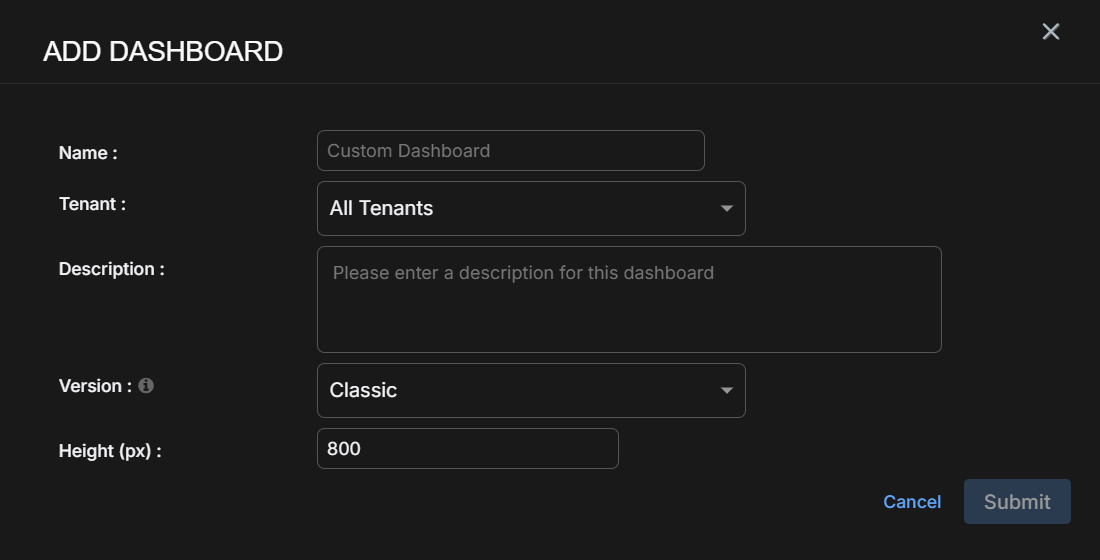
The Add Dashboard dialog box appears.
-
Enter the following and then select Submit:
Name: Enter a meaningful name for the dashboard.
This field does not support multibyte characters.
Special characters are not permitted in name fields for queries, watchlists, reports, or dashboards. Letters, underscores, spaces, dashes, numbers and periods are permitted.
You cannot change the dashboard name after you create the dashboard.
Tenant: Choose an individual tenant or All Tenants.
Description: Enter a useful description about the purpose of the dashboard.
Version: Choose either Classic or New Layout. The Classic layout uses a fixed-height structure. New Layout uses a grid-based layout system that supports configurable column formats (12, 16, or 24 columns) and drag-and-drop placement. This layout provides greater flexibility when organizing dashboard components and supports responsive display adjustments across different screen sizes.
Height (appears when the Version is Classic): Use the default height of 800 pixels (px) or enter a custom height.
- From the View setting that appears when the layout version is New Layout, choose one of the four responsive layout options to optimize the dashboard display on various monitor types:
Auto (default) – Automatically selects a layout based on detected browser width
Laptop – Optimizes for standard screen widths of 1440–1920 px
Grid dimensions: 12 columns wide x 2-100 rows high
Individual grid component dimensions: 2-6 columns wide x 2-4 rows high
Monitor – Optimizes for larger screen widths of 1920–2560 px screen widths
Grid dimensions: 16 columns wide x 3-100 rows high
Individual grid component dimensions: 3-6 columns wide x 3-4 rows high
Wide – Optimizes for ultrawide or large screen widths >2560 px for maximum data density
Grid dimensions: 24 columns wide x 3-100 rows high
Individual grid component dimensions: 4-6 columns wide x 3-4 rows high
-
To view the dashboard canvas with options to add various types of charts, text boxes, counters, and tables, select Edit.
Stellar Cyber displays your new dashboard with a blank canvas and buttons for adding components.
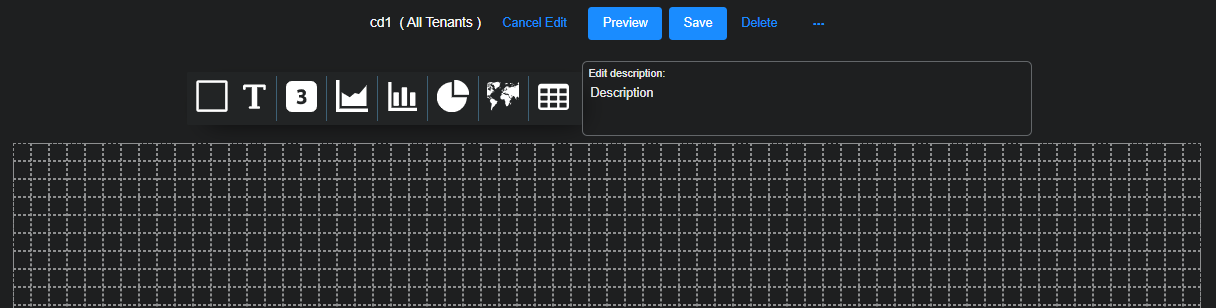
The grid pattern only appears for the Classic layout.
-
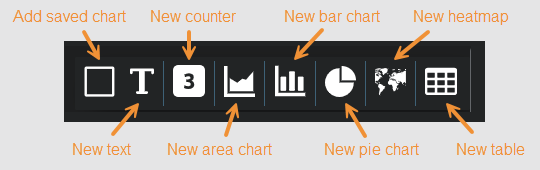
Select a button to add a component (chart, counter, heatmap, text, or table). See the Dashboard Components page for details on each component.
-
Select Save to add the component to your dashboard canvas.
Stellar Cyber displays the canvas with the new component, which you can then resize, move, edit, or delete.
When you export a dashboard as a scheduled report, components are expanded so that all information is visible on the PDF (because you cannot scroll individual images within the PDF). For more control over the design of the PDF report, resize components in the layout area to remove scrollbars.
-
Move and add components.
When you use the New Layout, you can select-and-drag components to different parts of the dashboard. As you do so, the other elements in the dashboard automatically adjust and adapt to its new position.
You can resize a component by hovering your cursor over an edge and then select-and-dragging resize handles in the two lower corners. If you reduce the size of one component, others might dynamically move into the vacated space.
You can also remove a component from a dashboard by selecting the X icon in its upper right corner.
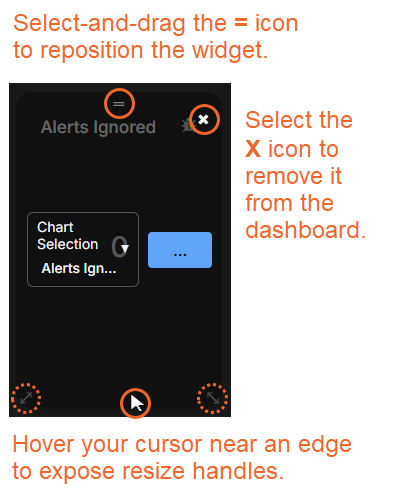
When you use the Classic layout and place a component on the dashboard, you only need to position it near an intended area on the grid. When you save the dashboard, Stellar Cyber automatically snaps the component into alignment with the grid.
-
Preview the dashboard to see how it will look when saved.
-
Save the dashboard when you’re done.
If you cannot see all of the components on your dashboard, adjust the layout and increase the dashboard height.
Edit a Custom Dashboard
To edit a custom dashboard:
-
Select Dashboards | CREATION | Dashboards to open the Dashboards Hub, then locate and open the custom dashboard you want to edit.
-
Select Open in Visualizer | Edit.
When a dashboard is in Edit mode, Stellar Cyber replaces the Edit button with Cancel Edit and changes the dashboard view to the editing canvas with a group of buttons for adding components.
-
Select a button to add a component.
See the Dashboard Components page for details on each one.
-
After you've configured a component, select Submit to add it to your dashboard canvas.
Stellar Cyber displays the canvas with the new component, which you can edit or delete later.
-
Add more components to the dashboard and rearrange them if you want.
-
Select Preview to see your changes.
-
Select Save when you're done to save your changes or select Cancel Edit to abandon all changes.
Delete a Custom Dashboard
To delete a custom dashboard:
-
Select Dashboards | CREATION | Dashboards to open the Dashboards Hub.
-
In the All Dashboards section, select the Custom category filter and then select the custom dashboard that you want to delete.
-
Select the Delete button.
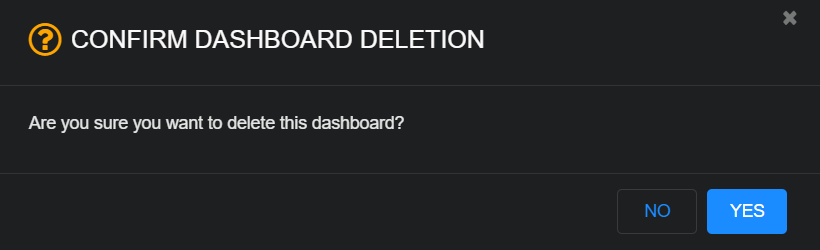
The Confirm Dashboard Deletion dialog appears.
-
Select Yes to immediately delete the dashboard or No to cancel the deletion.
Clone a Dashboard
-
Select Dashboards | CREATION | Dashboards to open the Dashboards Hub, then locate the dashboard you want to clone in the All Dashboards table and open it.
-
Select the Clone button.
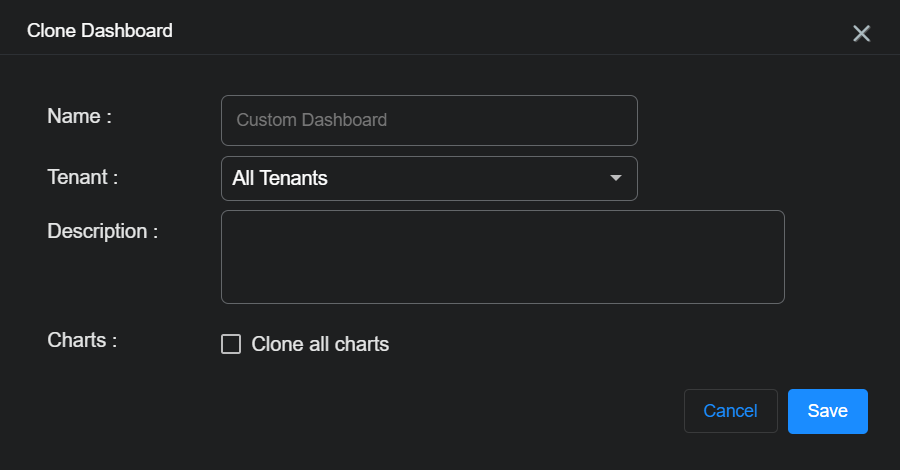
The Clone Dashboard dialog box appears.
-
Enter the following and then select Save:
Name: Enter a name for the cloned dashboard.
This field does not support multibyte characters.
Special characters are not permitted in name fields for queries, watchlists, reports, or dashboards. Letters, underscores, spaces, dashes, numbers and periods are permitted.
Tenant: Choose an individual tenant or All Tenants.
Description: Add a meaningful description of the cloned dashboard for future reference.
Clone all charts: Select the check box to Clone all charts from the source dashboard.
If you are cloning a dashboard for which you do not have edit permissions, make sure you select the Clone all charts option if you intend to edit the charts. Otherwise, you won't be able to edit the charts in the cloned dashboard because they do not belong to your account.
The new dashboard is saved and becomes accessible from the Dashboards Hub under the Custom category. You can now edit it as with any custom dashboard.
A custom dashboard that you create by cloning a predefined dashboard inherits the access rules of the original dashboard. The rules are evaluated each time the custom dashboard is opened or exported, so a change to the access rules of the original dashboard applies immediately to every existing custom copy. For a description of these rules, see Access to Dashboards, Widgets, and Charts.
-
Charts that you cannot access when you create the clone are not copied into the custom dashboard. A clone contains what you can see.
-
Saving a dashboard that contains restricted widgets does not remove those widgets from the stored dashboard. They remain in place and reappear if your access changes.
Share a Dashboard
To configure sharing for a dashboard, you must have Owner or Editor permissions for it.
To share a custom dashboard:
-
Select Dashboards | CREATION | Dashboards to open the Dashboards Hub, then locate and open the custom dashboard you want to share.
-
Select the Share button.
The Share <dashboard-name> dialog box appears.
-
Assign Editor (read/write) or Reader (read-only) permissions to specific users.
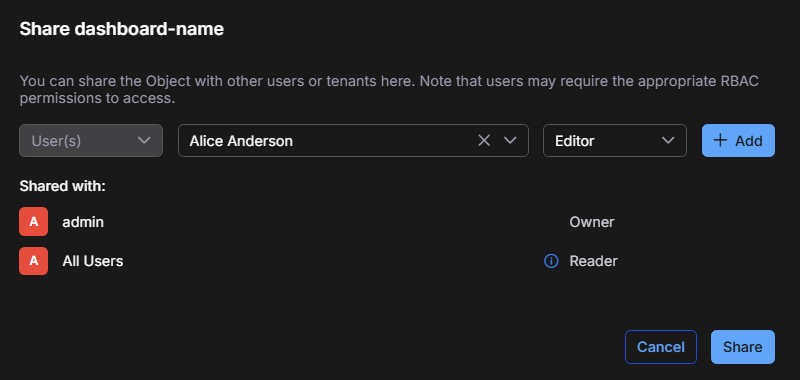
These settings determine which users can edit or view the dashboard. The owner retains full control and can modify or revoke shared access at any time. For complete information about global defaults and dashboard-level permissions, see Configuring Object-Level Sharing and Access Control.
Export a Dashboard as a PDF / CSV
To export a dashboard:
-
Select Dashboards | CREATION | Dashboards to open the Dashboards Hub, then locate and open the dashboard you want to export.
-
Select Export and choose the applicable option:
-
Export PDF / CSV: For dashboards/reports without tables, you are offered the option to Export as PDF. If the dashboard has one or more tables, the export also downloads a CSV file, you are offered the option to Export as PDF / CSV.
Stellar Cyber converts the page to a PDF and displays it in another browser tab from where you can download it. If applicable, a CSV file is downloaded directly to your desktop.
-
Export as Enhanced PDF / CSV
 : When you choose this option, the PDF of the exported dashboard offers several enhancements over the standard PDF export:
-
Each dashboard component appears on a dedicated page so that all the details in the rendered content are clearly visible.
-
The PDF contains a table of contents that lets you link directly to whatever specific component you want to see.
-
The rendering of tables supports multi-line values and text wrapping so that data isn't truncated.
-
Wide tables span multiple pages when necessary to ensure that all columns and the data in them are displayed.
-
-
Configuration: For selected dashboards/reports, you might also be offered the option to Export as Configuration. In this case, a JSON file is created for you to save on your local system. From there you can import it within the Dashboards | Creation | Dashboards page on other systems.
-
You must enable pop-ups for Stellar Cyber to display the PDF.
PDF and CSV output matches what the dashboard viewer displays. Restricted widgets are omitted, and restricted charts appear as a Permission Denied placeholder. For details, see Access to Dashboards, Widgets, and Charts.
Export a Dashboard as a Configuration
You can export a dashboard to share it with another system or another tenant.
-
Select Dashboards | CREATION | Dashboards to open the Dashboards Hub, then locate and open the custom dashboard you want to export.
-
Select Export and then choose Export as Configuration.
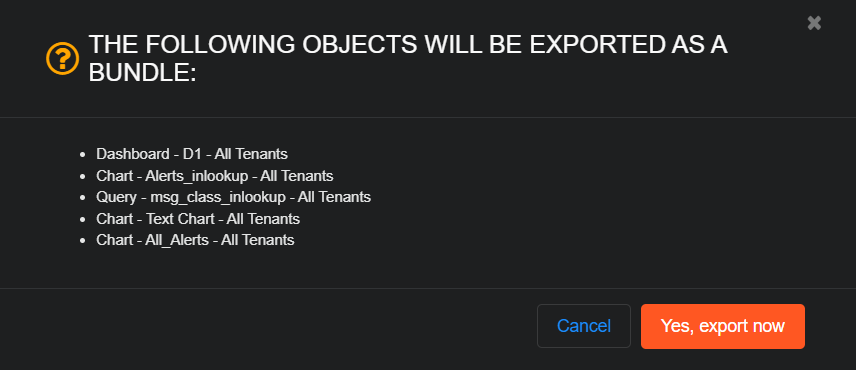
A confirmation appears.
-
Review what will be exported.
Stellar Cyber exports all charts in the dashboard and all associated queries.
The tenant is set to All Tenants regardless of the tenant when you export. You can set the tenant when you import.
-
Select Yes, export now.
The dashboard is exported as a JSON file to your desktop.
Import a Dashboard
You can import a dashboard that was saved in JSON format.
-
Select Dashboards | CREATION | Dashboards.
-
Select Create and choose Import Dashboard.
The Import Dashboard dialog box appears.
-
Choose an individual tenant or All Tenants, select Choose File, and then select the JSON file to import.
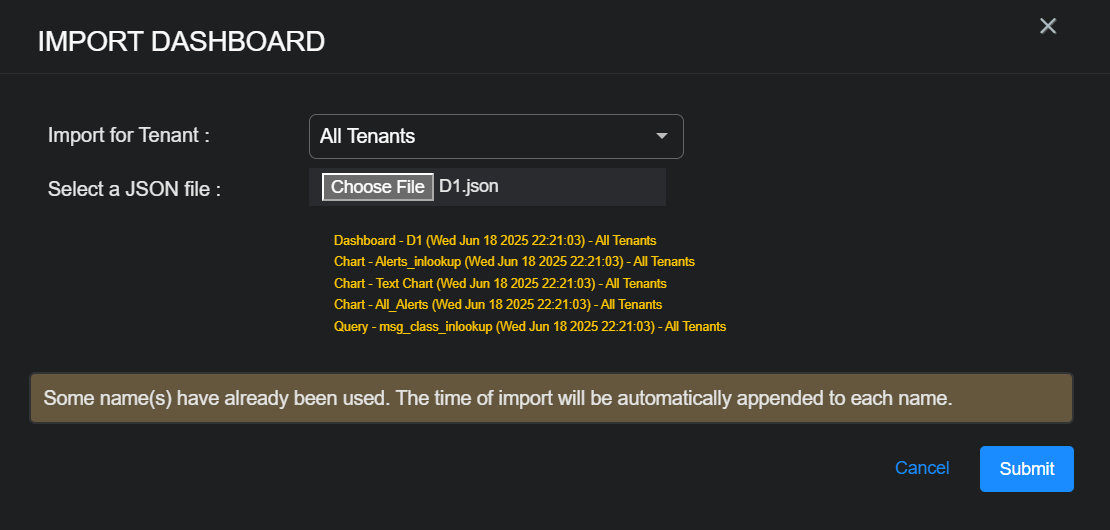
If you have duplicate dashboards, charts, or queries in your system, Stellar Cyber automatically appends the import time to the name of each object.
-
Select Submit.
Stellar Cyber imports the dashboard and displays it.
Dashboard Categories
Stellar Cyber provides over 60 predefined dashboards in the Dashboards Hub (Dashboards | CREATION | Dashboards), grouped into categories that support compliance monitoring, threat detection, operational oversight, and platform management. These dashboards offer curated visualizations that help you assess risk, measure performance, and support regulatory standards. In addition, the Custom category allows you to build dashboards tailored to your unique security and business requirements.
Use the category filters in the All Dashboards section of the Hub to narrow the dashboard list to a specific category.
Custom
Select the Custom category filter to see user-defined dashboards. You determine the layout and content using a variety of components such as charts, counters, tables, and heatmaps. These dashboards are fully configurable, allowing tailoring to specific visibility needs, roles, or workflows.
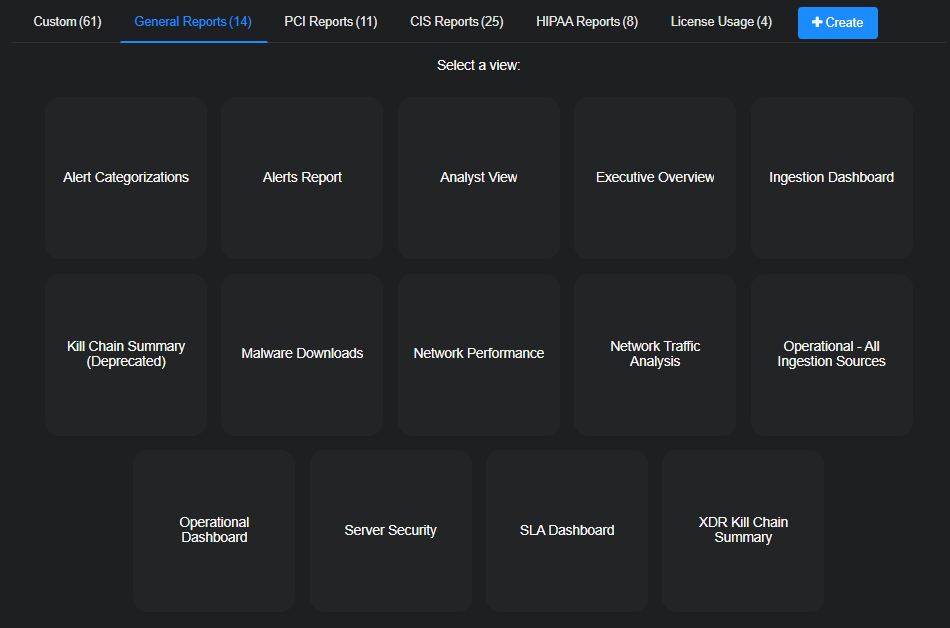
General Reports
Select the General category filter to see the dashboards that provide operational visibility across your deployment.
These dashboards display high-level data on alerts, cases, anomaly detection, sensor activity, and detection performance. Use them to monitor overall system health, analyst activity, and trends across tenants.
PCI Reports
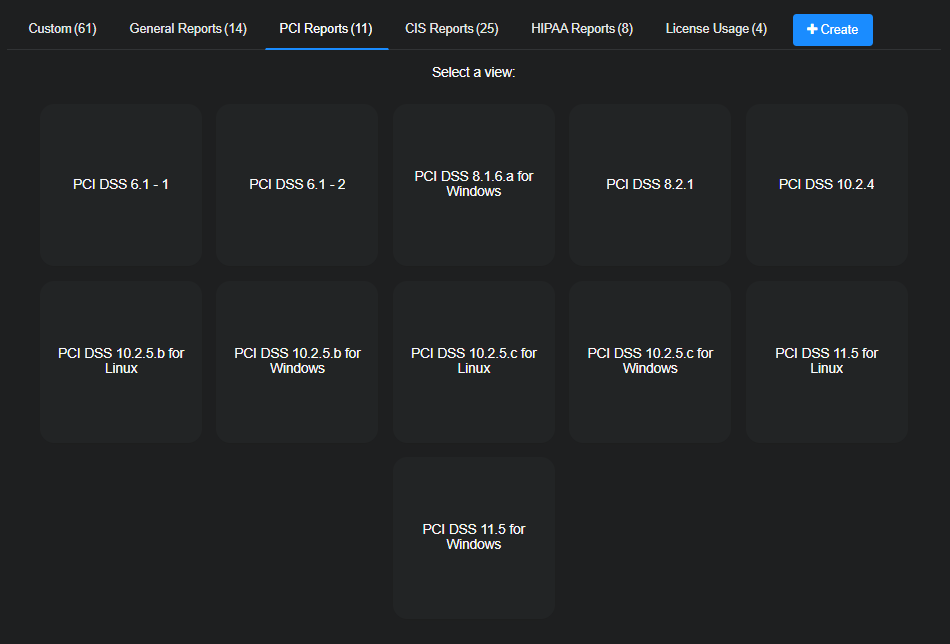
Select the PCI DSS category filter to see dashboards related to the Payment Card Industry Data Security Standard (PCI DSS).
These dashboards help you monitor and report activities relevant to PCI compliance, such as access control, authentication, system logging, and data handling. They support internal audits and external assessments by aligning dashboard content with PCI control categories.
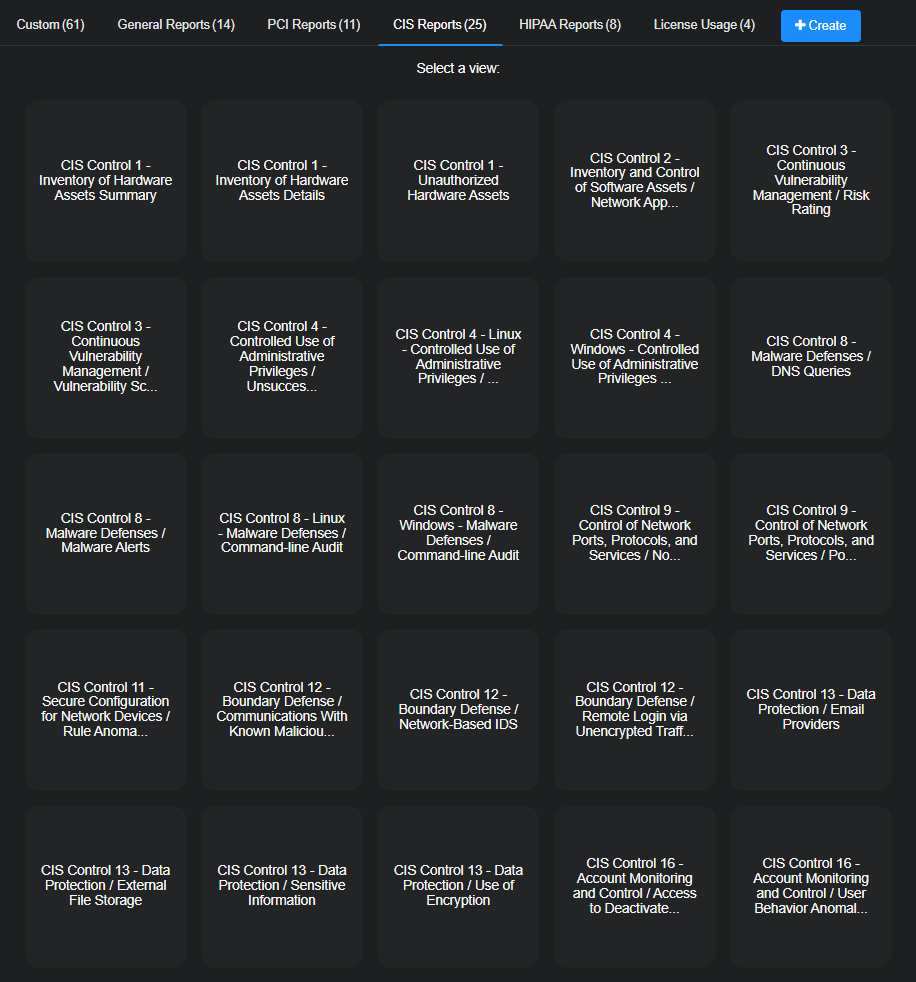
CIS Reports
Select the CIS Controls category filter to see dashboards aligned with the Center for Internet Security (CIS) Controls. Dashboards under this category are mapped to CIS benchmarks and controls, such as secure configurations, account monitoring, and access management.
These dashboards visualize asset behavior, login events, privilege use, and configuration compliance in accordance with CIS best practices. Use them to evaluate your adherence to foundational cybersecurity hygiene and hardening guidelines.
HIPAA Reports
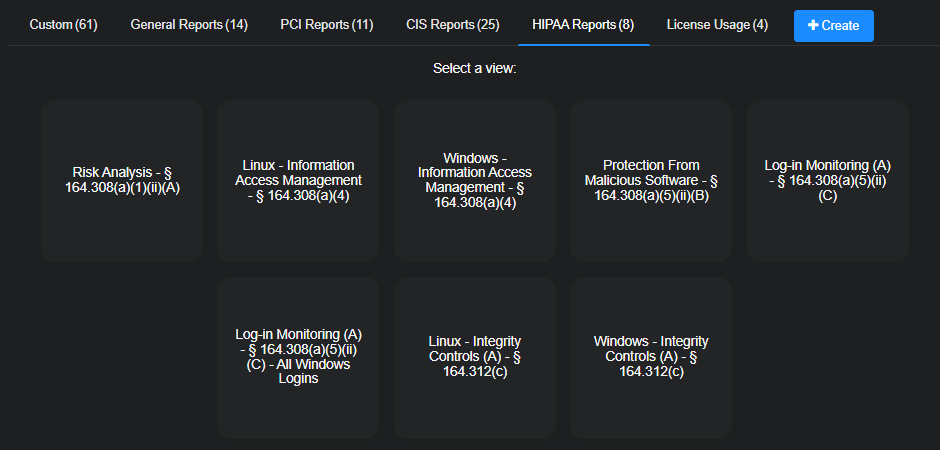
Select the HIPAA category filter to see dashboards focused on compliance with the Health Insurance Portability and Accountability Act (HIPAA). Dashboards here help healthcare organizations monitor controls related to protected health information (PHI).
These dashboards track activity related to the protection of health information, including unauthorized access attempts, account usage, and system events that may impact confidentiality. Use them to support incident tracking and safeguard compliance in regulated healthcare environments.
License Usage Reports
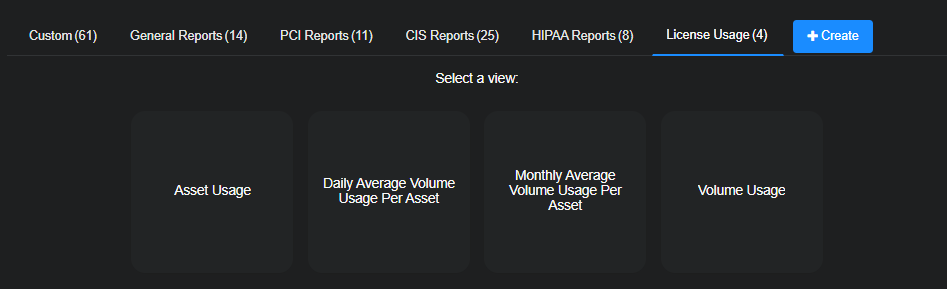
Select the License category filter to see dashboards that show how your deployment uses Stellar Cyber licensing resources.
License Usage reports are visible from the Reporting | Reports | License Usage tab.
These dashboards present metrics on data ingestion, retention, sensor traffic, and tenant-level license distribution. Use them to ensure license utilization stays within entitlements and to plan for scaling across tenants or service tiers.
The set of license dashboards and license reports available to you depends on your deployment. The Dashboards Hub and the report catalog always present the same set, so a license dashboard that is available to you always has a matching report entry.
Some of the dashboards in the License Usage tab are only available as part of an Early Access Program and might not appear in your version of the Stellar Cyber Platform. Contact your account manager to inquire about taking part in an Early Access Program.
Access to License Dashboards and Reports
The license dashboards and the license reports show usage figures for the entire organization. Access to this content is restricted as follows:
-
Root-scope users can view license dashboards and license reports.
-
Partner-scope and tenant-scope users cannot view them unless access is granted for your Stellar Cyber Platform.
-
Tenant group breakdowns within license dashboards are never shown to partner-scope or tenant-scope users, even when the surrounding dashboard is available to them.
-
Users whose role does not include the Software License View privilege never see license reports, regardless of scope.
Effect of the Tenant Selector
When you are a root-scope or partner-scope user and you set the tenant selector to a specific tenant or tenant group, license dashboards and scheduled license reports are hidden. License figures are calculated across the whole organization, so presenting them beneath a tenant heading misrepresents the data.
Tenant-scope users are not affected by this behavior, because the tenant selector is always fixed to their own tenant.
