Create & Schedule Reports
A major part of the Stellar Cyber Open XDR Platform is the ability to generate security reports. Use the instructions in this article to understand how to view, clone, schedule and export reports.
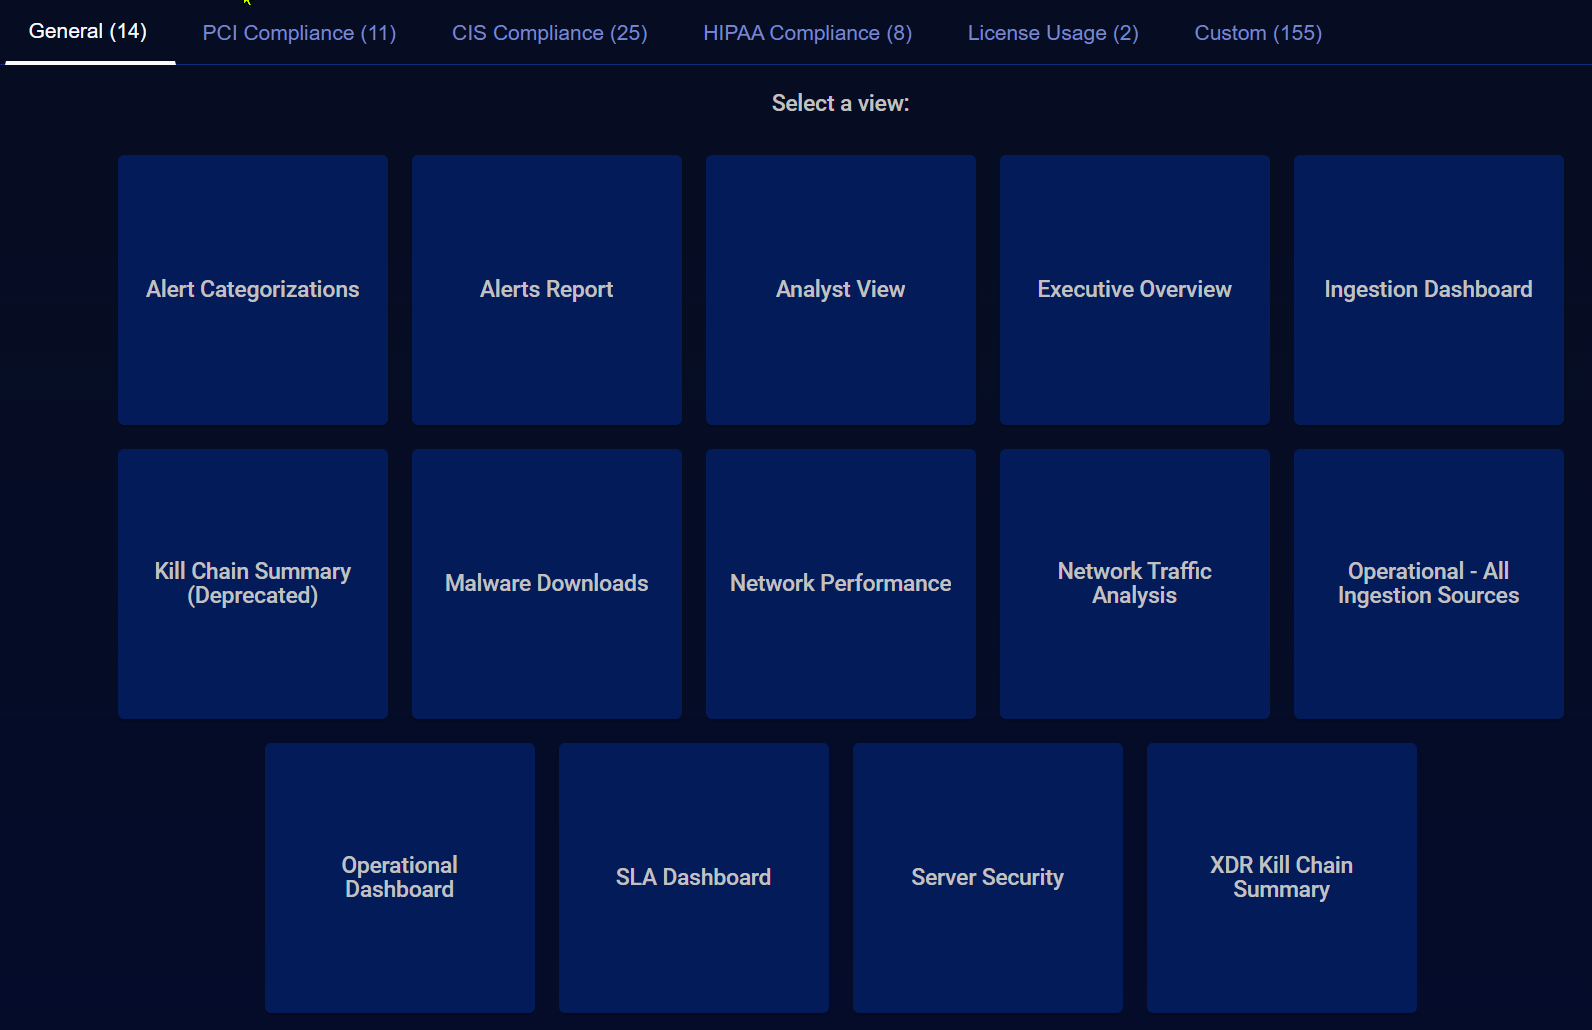
Access reports from the Respond | Reports menu. The Reports screen shows report collections organized into category tabs: General, PCI Compliance, CIS Compliance, HIPAA Compliance, and Custom. Certain reports are predefined. Reports you create or clone are saved in the Custom tab. The License Usage reports are generated based on the information from the System | Administration | Licensing tabs of the same name. You do not create these in the Visualize | Creation | Dashboard page, but can use the same tools to clone, schedule, and edit.
See the Visualize page for information on constructing custom reports. View a list of scheduled reports on the Scheduled Reports page. The License Usage reports are directly correlated to the tabs of the same name in System | Administration | Licensing.
While a report is displayed, you have the option to:
Viewing Reports
You can select a different report by clicking one of the tabs near the top of the page. The tab shows the categories of available reports (along with the number of reports in each category). Click any tab to see a new report selection screen with the available reports in that category.
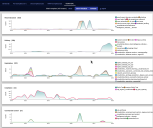
The data
in the reports is subject to the filters and queries defined at the top of the page. The exception to this are the Operational View and Analyst View, which are intentionally unaffected by the Event Status Filter. ![]()
-
From the Reports screen, select a tab of interest such as General, or Custom.
-
Select one of the blue squares to view that report. When the report displays, you are presented with options to Schedule , Clone or Export the report . If it is a Custom report, you also have the option to edit it from the Visualize | Creation | Dashboards menu.

Editing or Cloning a Report
You can clone a report to use it as the basis for a custom report.
As of v4.3.0, the availability of certain components (such as charts, correlations, ATH rules) with tenant visibility settings has changed. Specifically, the top level component cannot have a less restrictive visibility than its children components.
-
For any component, such as a query you create, with visibility set to All Tenants, then all its sub-components (such as a lookup list) must also be set to All Tenants.
-
Similarly, if a component is set for a specific tenant, then all its sub-components must be specified for either that tenant or All Tenants.
-
Click Respond | Reports. The Select a view screen appears.
-
Click a report to select it, or click a tab to select a different report. The report is displayed.
-
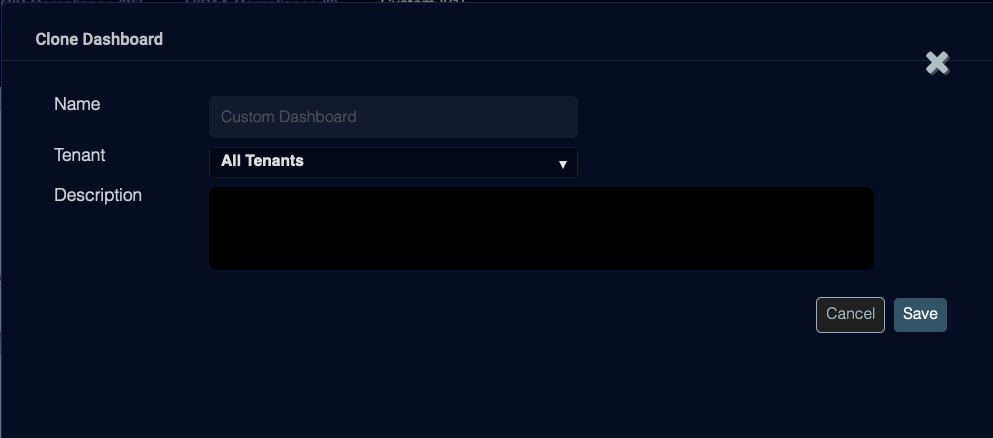
Click Clone. The Clone Dashboard screen appears.

-
Enter a Name.
-
Select a Tenant.
-
Optionally, enter a Description
-
Click Save. The report is saved to the Custom tab and can be edited from the Working with Dashboards menu.
The charts used in Stellar Cyber's pre-defined asset reports (such as CIS Control 1 - Inventory of Hardware Assets Summary and CIS Control 1 - Inventory of Hardware Assets Details, and Risk Analysis) rely on a definition that is present with their associated dashboard. For that reason, the option to clone all charts when you clone a dashboard has been disabled for those reports. This will be addressed in a future release.
Scheduling A Report
You can schedule a report to run at a specific time. Stellar Cyber runs the report and sends it to the recipients you specify. To schedule a report:
-
Click Respond | Reports. The Select a view screen appears.
-
Select the report from the collection of tabs.
-
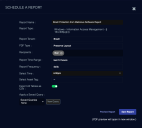
Click Schedule. The Schedule a Report screen appears.
-
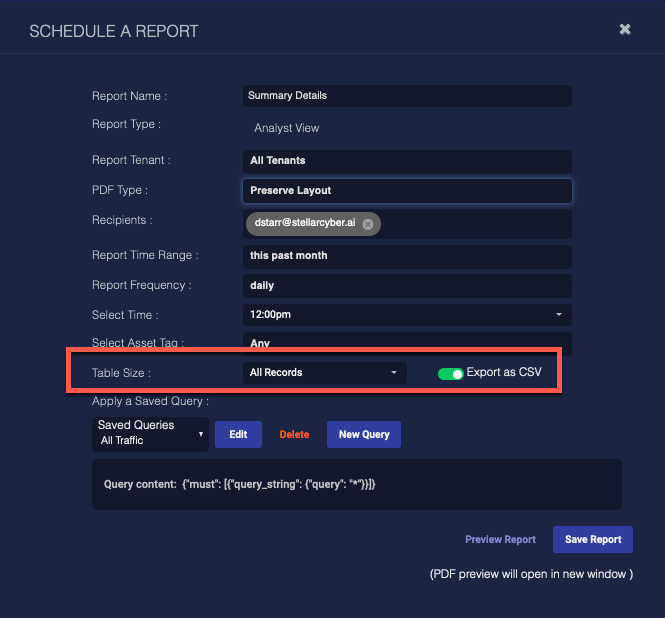
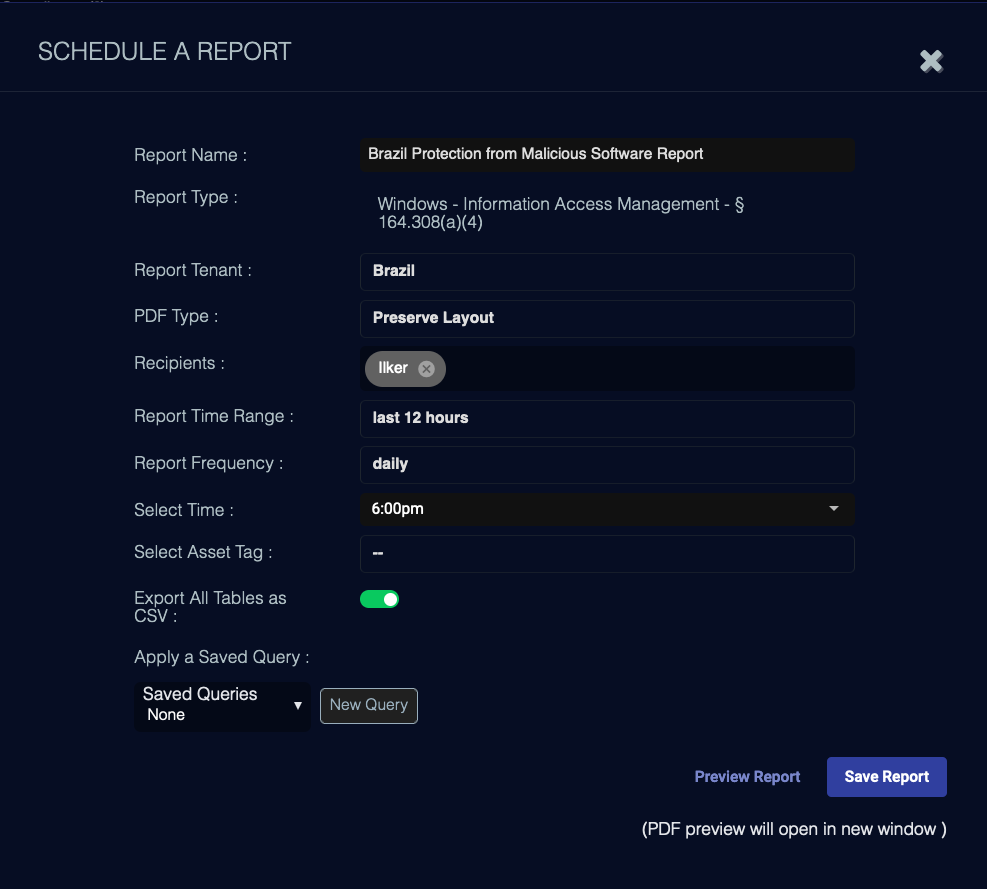
Enter a Report Name. This field does not support multi-byte characters.
-
The Report Type field is automatically set. For custom reports, this is the same value as the Name field. For pre-defined reports, the value is automatically set from internal attributes.
-
Choose a Tenant.
-
Choose a PDF Type, either Preserve Layout or Print Optimized.
-
Enter or select email Recipients for the report. You can enter a valid email address or select from the list of recipients added using the Configure | Recipients page.
-
Choose a Report Time Range. The range is relative to the time the report is run.
-
Choose a Report Frequency. Can be Daily, Weekly, or Monthly.
-
If you chose Weekly, choose the day.
-
If you chose Monthly, choose the date.
-
-
Choose the Time to run the report.
-
For applicable reports, the asset list is populated. You can optionally choose an asset on which to report.
-
You can specify the report to Export as CSV. If this is disabled, the report is generated as a PDF.
-
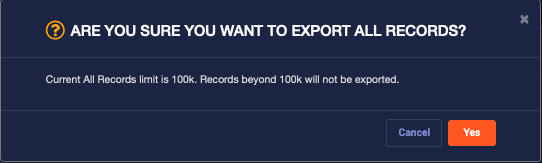
You also must specify the Size of the data table you want to report. The available options range from 25 to 10,000, or All Records.
When you save a report with the size set to All records, a warning displays to advise of the report will include a maximum of 100,000 records.
-
You can preview the report by clicking the Preview Report button. The preview is opened in a new browser window.
-
You can also Apply a Saved Query to further refine the data. If you don't have a saved query, you can create a new query and save it.
-
Click Save Report. The schedule is saved and appears on the Scheduled Reports page.
Exporting a Report
To export a report:
-
Click Respond | Reports. The Select a view screen appears.
-
Select the report from the collection of tabs.
-
Click the Export button.
-
Choose the applicable option:
-
PDF/CSV: For dashboards/reports without tables, you are offered the option to Export as PDF. If the dashboard has one or more tables, the export also downloads CSV file, choose Export as PDF / CSV.
Stellar Cyber converts the page to a PDF and displays it in another browser tab. If applicable, a CSV file is downloaded to your desktop.
-
Configuration: For selected dashboards/reports, you may also be offered the option to Export as Configuration. In this case, a JSON file is created for you to save on your local system. From there you can import it within the Visualize | Creation | Dashboards page on other systems.
Neither the report display nor the exported PDF may show all available entries for the Ingestion and License Usage reports. To see complete data for these, use the CSV files exported for each table together with the PDF. Alternatively, you can use the Visualize | Ingestion Dashboard or the System | Licensing | Asset Usage and Volume Usage views to scroll through all entries.
-
When you export a dashboard as a scheduled report, components are expanded so that all information is visible on the PDF (because you cannot scroll individual images within the PDF). For more control over the design of the PDF report, resize components in the layout area to remove scrollbars.
Notes on Predefined Report Contents
In general, the contents of the predefined reports are self-explanatory. This section provides some additional notes on the predefined reports to help you understand what you are seeing:
-
The byte counts shown in the General | Ingestion Dashboard represent the amount of data sent by connectors and sensors to the DP. Once data arrives at the DP from these sources, it undergoes additional enrichment and compression before it is stored on disk in the DP. Because of this, the byte counts shown in the Ingestion Dashboard will not match those shown in the System | Administration | Licensing | Volume Usage page or the License Usage reports, which represent the actual data stored on disk, post-enrichment and compression. To summarize:
-
Ingestion Dashboard – Reports byte counts based on data sent by connectors and sensors to the DP prior to enrichment and compression.
-
License Usage Reports – Report byte counts based on actual data stored on disk. These are the counts used for licensing purposes.
-
-
Some reports, including the General | Alerts report, include sections breaking out alerts into Critical, Major, Minor, and Notice categories. Each of these categories corresponds to a different bucket of Alert Scores, as follows:
Alert Category in Stellar Cyber Displays
Alert Score
Critical Alert Score ≥ 75 Major Alert Score ≥ 50 and < 75 Minor Alert Score ≥ 25 and < 50 Notice Alert Score < 25 -
Similarly, some reports may break out alerts according to their fidelity (High Fidelity or Other Fidelity). These categories correspond to Fidelity Categories, as follows:
Fidelity Category in Stellar Cyber Displays
Fidelity Score
High Fidelity Fidelity Score ≥ 75 Other Fidelity Fidelity Score < 75
