Ingestion Dashboard
The Visualize | Predefined | Ingestion Dashboard helps you understand which data sources are contributing the most bytes to the DP's ingestion, both over the last day in total bytes and as a daily average over the last 30 days. The dashboard includes the following tables, each of which can be sorted and searched using standard table techniques:
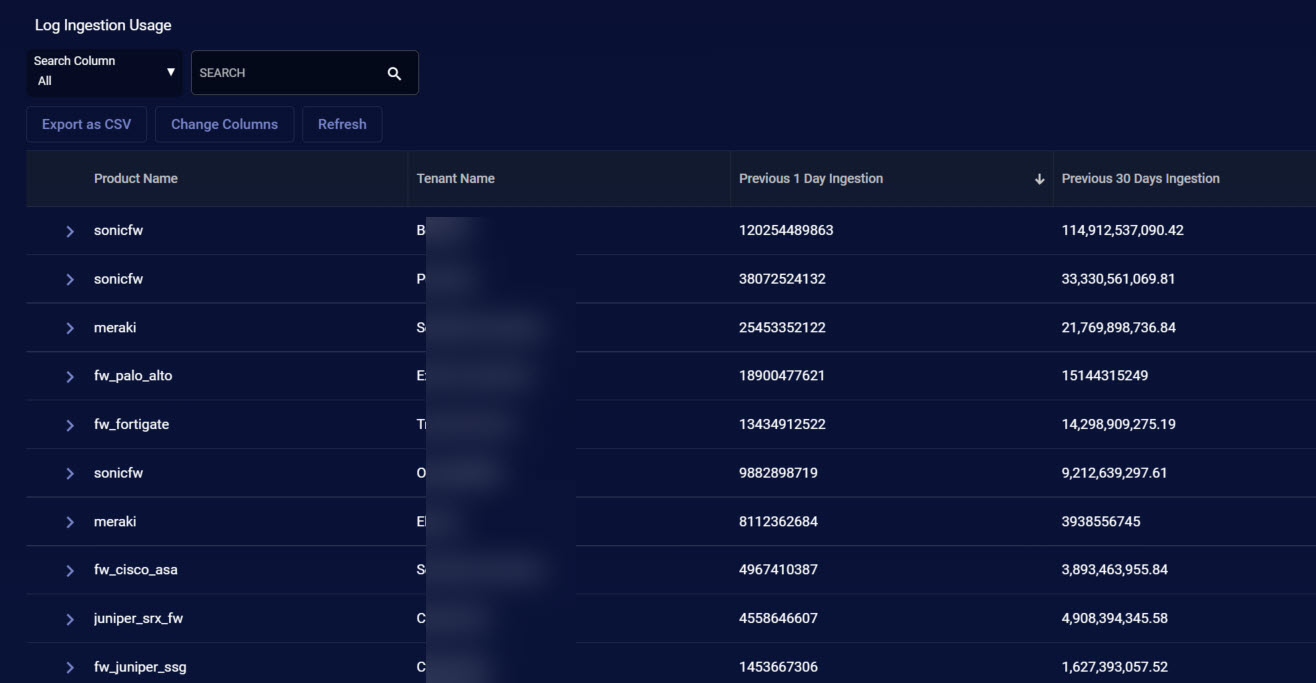
The figure below shows an example of the Log Ingestion Usage table in the Ingestion Dashboard, sorted in descending order by average daily ingestion over the last 30 days. You can see right away from which products the DP ingested the greatest amount of log data:
About Byte Counts in the Ingestion Dashboard
The byte counts shown in the Ingestion Dashboard represent the amount of data sent by connectors and sensors to the DP. Once data arrives at the DP from these sources, it undergoes additional enrichment and compression before it is stored on disk in the DP. Because of this, the byte counts shown in the Ingestion Dashboard will not match those shown in the System | Administration | Licensing | Ingestion Usage page, which represent the actual data stored on disk, post-enrichment and compression. To summarize:
-
Ingestion Dashboard – Reports byte counts based on data sent by connectors and sensors to the DP prior to enrichment and compression.
-
Licensing | Ingestion Usage – Reports byte counts based on actual data stored on disk. These are the counts used for licensing purposes.
![]() The Ingestion Dashboard expresses byte counts using Bytes, KB, MB, and GB units, as appropriate to the data volume. Sorts on byte-based columns work as expected, taking units into account – for example, an entry of 1000 KB is considered smaller than an entry of 2 MB.
The Ingestion Dashboard expresses byte counts using Bytes, KB, MB, and GB units, as appropriate to the data volume. Sorts on byte-based columns work as expected, taking units into account – for example, an entry of 1000 KB is considered smaller than an entry of 2 MB.
Connector Ingestion Usage Table
Summarizes ingestion by connector. Each connector from which the DP ingested data in the last 30 days is listed with the following information:
-
Connector Name – The name assigned to the connector in System | Integration | Connectors.
-
Tenant Name – The tenant to which the connector is assigned in System | Integration | Connectors.
-
Previous 24 hours Ingestion – The number of bytes sent by this connector to the DP in the last day, prior to enrichment and compression on the DP, inclusive of the current moment back to the previous 24 hours.

-
Avg Previous 30 Days Ingestion – The number of bytes sent by this connector to the DP as a daily average over the last 30 days, prior to enrichment and compression on the DP.
Log Ingestion Usage Table
Summarizes log ingestion by product across all indices (Syslog, ML-IDS/Malware, and Traffic). Each product from which the DP ingested logs in the last 30 days is listed with the following information:
- Product Name – The type of product sending log data to the DP (for example, fw_fortigate for a FortiGate Firewall). Products are identified uniquely by a combination of the product name and tenant name, so there can be multiple entries for the same product name. Note that if a given tenant has multiple products of the same type (for example, multiple FortiGate firewalls assigned to MyTenant), they are all rolled up into a single entry in this table. To see breakdowns of traffic from individual products assigned to the same tenant, use the Log Ingestion Usage by Log Source and Log Port table.
-
Tenant Name – The tenant to which the product is assigned.
-
Previous 24 hours Ingestion – The number of bytes sent from this product to the DP in the last day, prior to enrichment and compression on the DP, inclusive of the current moment back to the previous 24 hours.
-
Avg Previous 30 Days Ingestion – The number of bytes sent from this product to the DP as a daily average over the last 30 days, prior to enrichment and compression on the DP.
Log Ingestion Usage by Log Source and Log Port Table
Summarizes log ingestion by product, IP address, and destination port across all indices (Syslog, ML-IDS/Malware, and Traffic). Each product from which the DP ingested logs in the last 30 days is listed with the following information:
- Product Name – The type of product sending log data to the DP (for example, fw_fortigate for a FortiGate Firewall). Products are identified uniquely by a combination of the product name and tenant name, so there can be multiple entries for the same product name.
-
Tenant Name – The tenant to which the product is assigned.
-
Source IP – The IP address of the product sending the log data.
-
Destination Port – The port to which the product sent log data.
-
Previous 24 hours Ingestion – The number of bytes sent by this product/IP/port in the last day, prior to enrichment and compression on the DP, inclusive of the current moment back to the previous 24 hours.
-
Avg Previous 30 Days Ingestion – The number of bytes sent from this product/IP/port as a daily average over the last 30 days, prior to enrichment and compression on the DP.
Sensor Ingestion Usage Table
Summarizes data ingestion by sensor. Each sensor from which the DP ingested data in the last 30 days is listed with the following information:
- Sensor Name – The name assigned to the sensor when it was added to the Sensor List.
- Sensor ID – The internal ID assigned to the sensor by the DP.
- Sensor Type – Identifies the sensor type, as follows:
ds – data sensor
sds – security data sensor
wds – windows data sensor
modular – modular data sensor
-
Tenant Name – The tenant to which the sensor is assigned.
-
Previous 24 hours Ingestion – The number of bytes sent by this sensor to the DP in the last day, prior to enrichment and compression on the DP, inclusive of the current moment back to the previous 24 hours.
-
Avg Previous 30 Days Ingestion – The number of bytes sent by this sensor to the DP as a daily average over the last 30 days, prior to enrichment and compression on the DP.
Working with the Ingestion Dashboard Tables
This section describes common techniques for working with the tables in the Ingestion Dashboard.
Viewing JSON Data
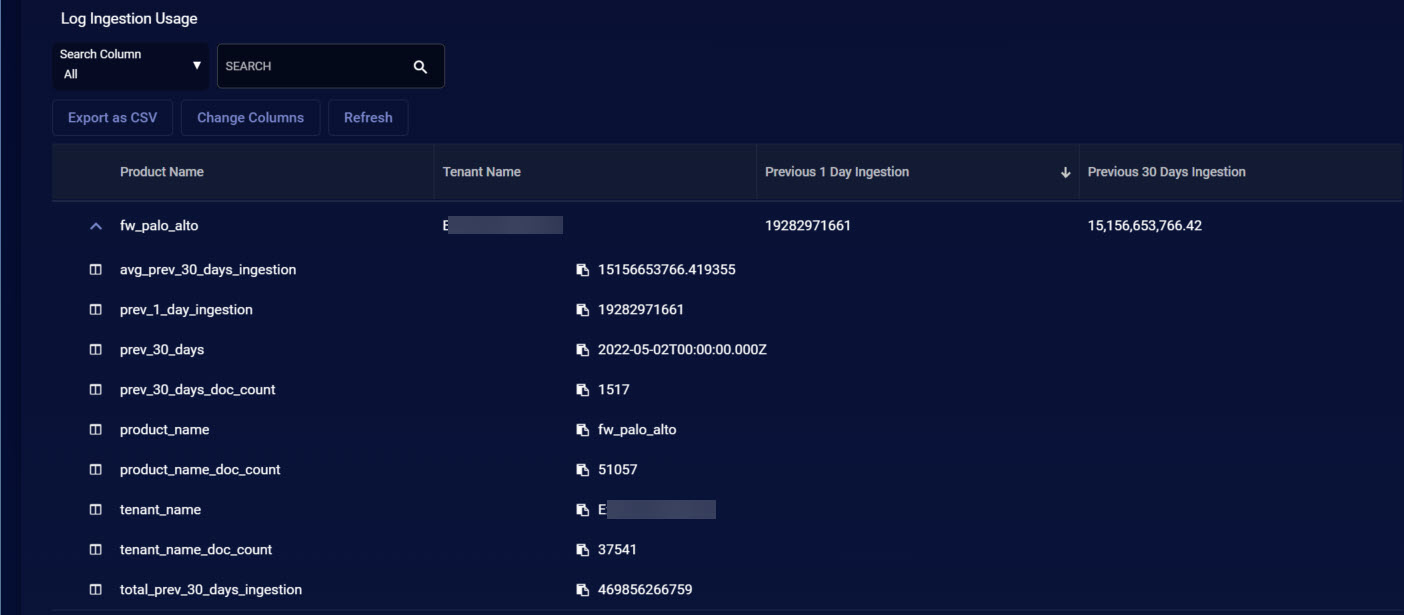
Each table entry in the Ingestion Dashboard can be cascaded open to display the supporting JSON data for the entry. For example, the following figure shows the JSON details for log data ingested from a specific Palo Alto Networks firewall:
About "Unknown" Entries in the Ingestion Dashboard
Under certain circumstances, you may see entries in the Ingestion Dashboard with a Product Name of unknown. This happens when logs cannot be parsed because they do not follow the expected log format. You can still see useful information on these entries by cascading them open to view the underlying JSON.
Table Actions
Each of the tables in the Ingestion Dashboard supports standard table actions, including search, sort, CSV export, column change, and table refresh.
