Configuring Azure Event Hub Connectors
Azure Event Hub connectors allow Stellar Cyber to ingest Azure events and add them to the data lake.
Stellar Cyber connectors with the Collect function (collectors) may skip collecting some data when the ingestion volume is large, which potentially can lead to data loss. This can happen when the processing capacity of the collector is exceeded.
Connector Overview: Azure Event Hub
Capabilities
-
Collect: Yes
-
Respond: No
-
Native Alerts Mapped:

-
Runs on: DP
-
Interval: Continuous
Collected Data
|
Content Type |
Index |
Locating Records |
|---|---|---|
|
Azure Activity Log Azure Bastion Azure Firewall Azure Keyvault Azure Security Center Azure Security Groups Azure SQL Server Azure Storage Azure Synapse Workspace Azure Web Application Firewall Microsoft Defender for Cloud |
Syslog Windows Events (for Microsoft Defender for Cloud) |
msg_class: azure_activity_log azure_bastion_log azure_firewall azure_keyvault_log azure_security_center azure_security_groups azure_sql_server azure_storage azure_synapse_workspace azure_web_application_firewall microsoft_defender_cloud |
Domain
N/A
Response Actions
N/A
Third Party Native Alert Integration Details
This connector ingests logs from the content type, Microsoft Defender for Cloud, to get the raw alerts that are stored in the Syslog index.
Stellar Cyber maps Microsoft Defender for Cloud alerts. The alerts are read from the Syslog index, enriched with Stellar Cyber fields, and mapped (with deduplication) to the Alerts index.
Deduplication is by microsoft_defender_cloud.SystemAlertId.
For details, see Integration of Third Party Native Alerts.
Required Credentials
-
Event Hub Name, Connection String, Consumer Group
Locating Records
To search the alerts in the Alerts index, use the query: msg_class: microsoft_defender_cloud
To search the Original Records in the Syslog index, use the query: msg_class: microsoft_defender_cloud
Let us know if you find the above overview useful.
Adding an Azure Event Hub Connector
To add an Azure Event Hub connector:
- Gather the Event Hub information
- Stream logs to Event Hub
- Add Azure Monitor logs to Event Hub
- Add the connector in Stellar Cyber
- Test the connector
- Verify ingestion
Gathering the Event Hub Information
Gather the following Event Hub information.
The subscription plan needed for the Azure Event Hub connector is Basic.
-
Azure Event Hub Name: The name of the Azure Event Hub
-
Connection String: Find the connection string in Azure. You must use a unique connection string for each of your Stellar Cyber Azure Event Hub connector instances.
-
Consumer Group: The consumer group for the Event Hub
-
Event Source: The source of the events you want to ingest (you must configure these sources to send data to your Event Hub):
-
Azure Activity Log
-
Azure Bastion

-
Azure Firewall
-
Azure Keyvault
-
Azure Security Center
-
Azure Security Groups

-
Azure SQL Server (includes AuditEvent log )
-
Azure Storage
-
Azure Synapse Workspace
-
Azure Web Application Firewall
-
Custom Event Source
-
Microsoft Defender for Cloud
-
Streaming Logs to Event Hub
To stream logs to an Event Hub, refer to the Microsoft documentation.
-
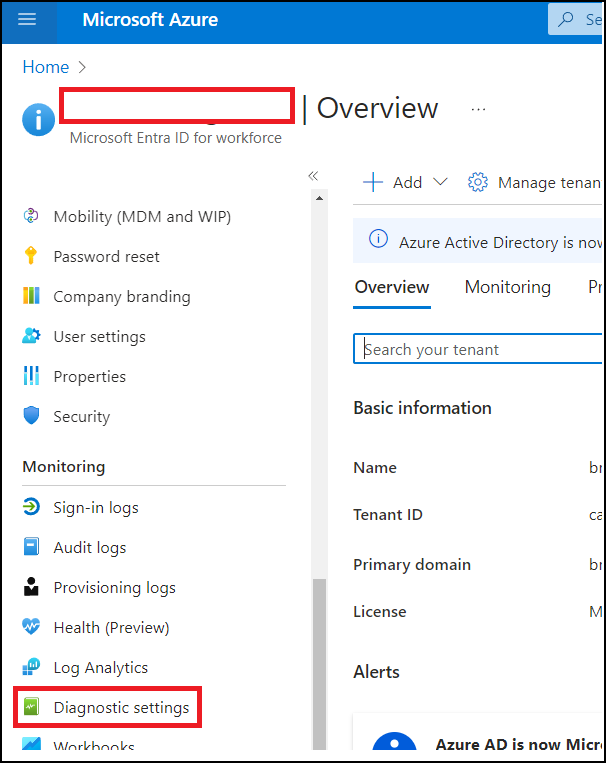
Log in as a Security Administrator to Microsoft Entra ID.
-
Scroll down to Monitoring and click Diagnostic settings.
-
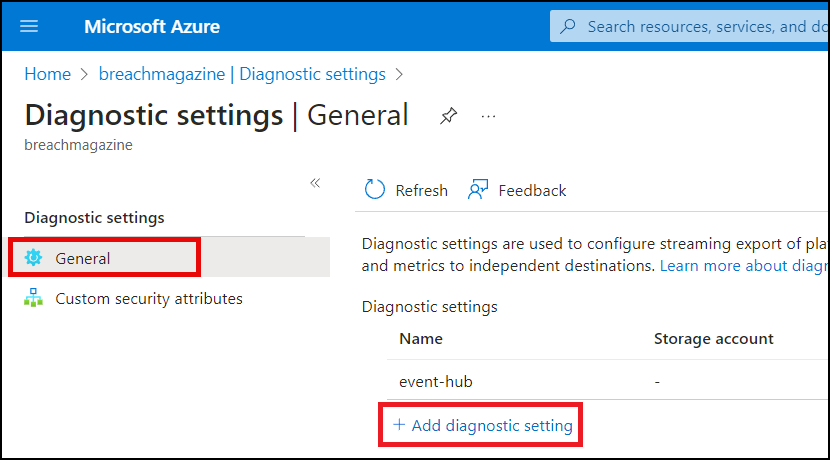
Click General and then click Add diagnostic setting.
-
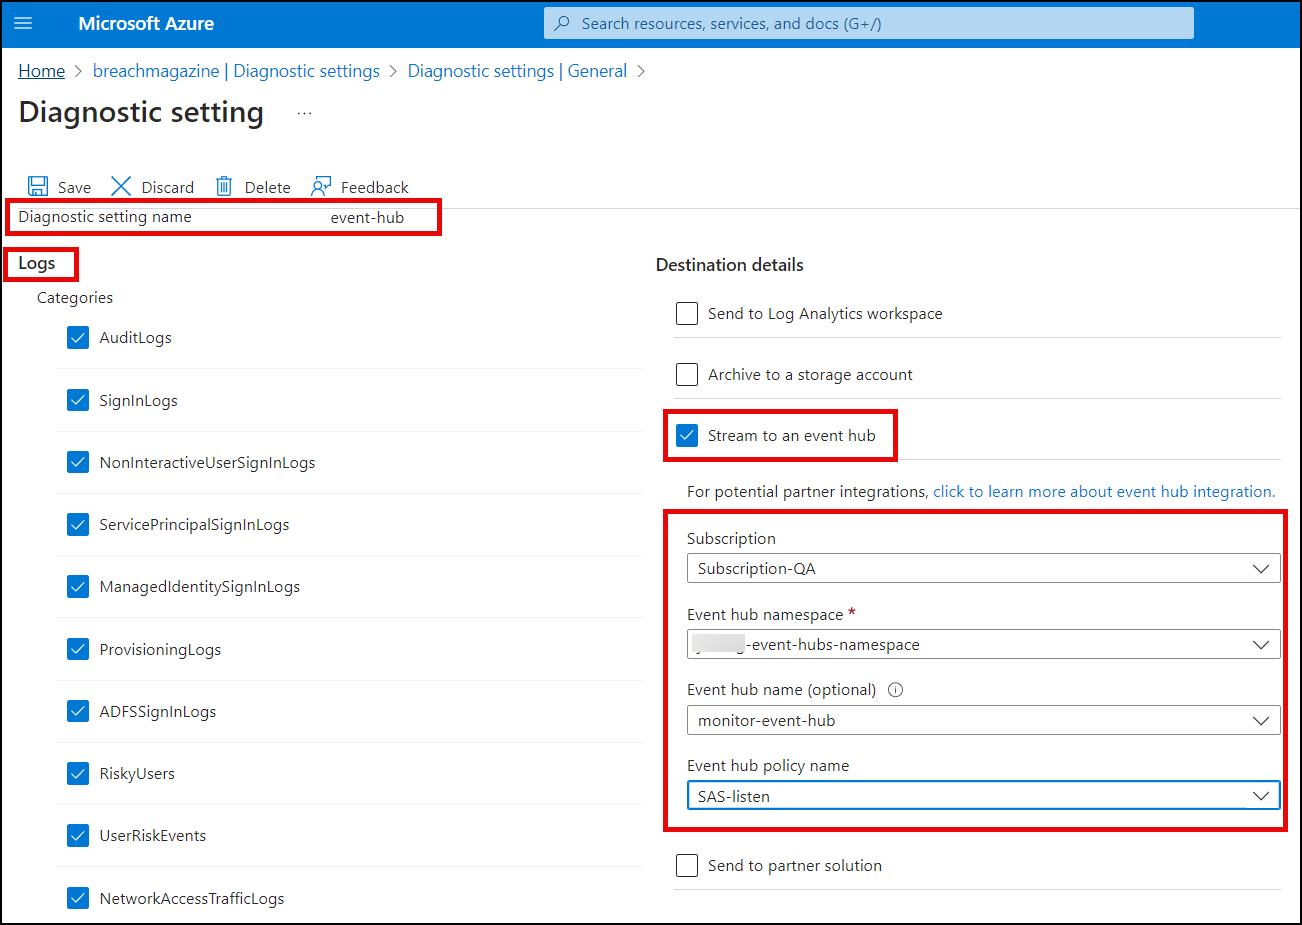
In the Diagnostic setting window:
-
Enter a Diagnostic setting name.
-
Select the Logs you want to stream.
-
Select the check box for Stream to an event hub.
-
For where you want to route the logs, select the Subscription, Event hub namespace, optional Event hub name, and Event hub policy name.
-
-
Click Save.
Make sure the Subscription and Event hub namespace are associated with the Microsoft Entra tenant from where the logs are streamed.
Adding Azure Monitor Logs to Event Hub
To add Azure monitor logs to an Event Hub:
-
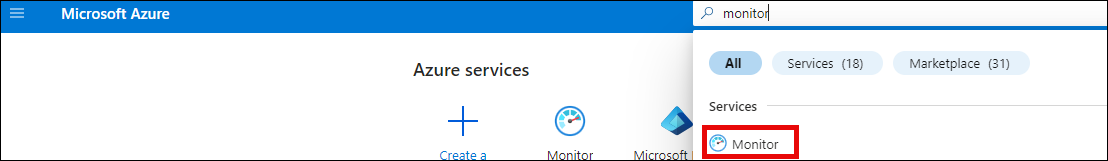
In Microsoft Azure, portal.azure.com, search for and select the Monitor service.
-
Click Activity log and then click Export Activity Logs.
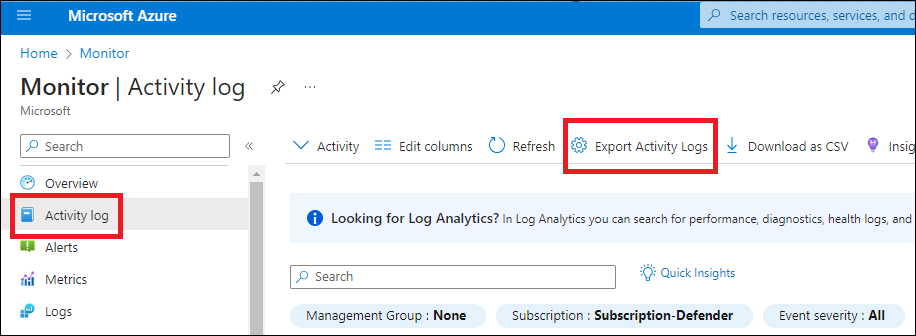
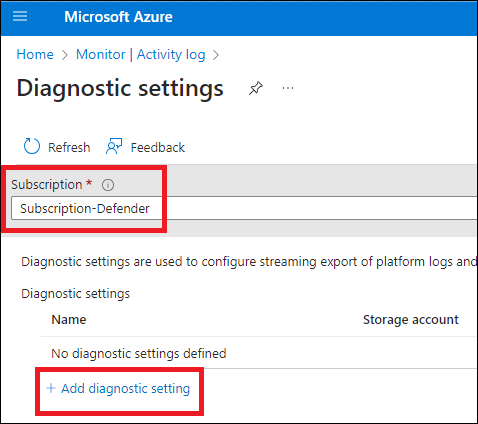
-
For the Diagnostic settings, select a Subscription and then click Add diagnostic setting.
-
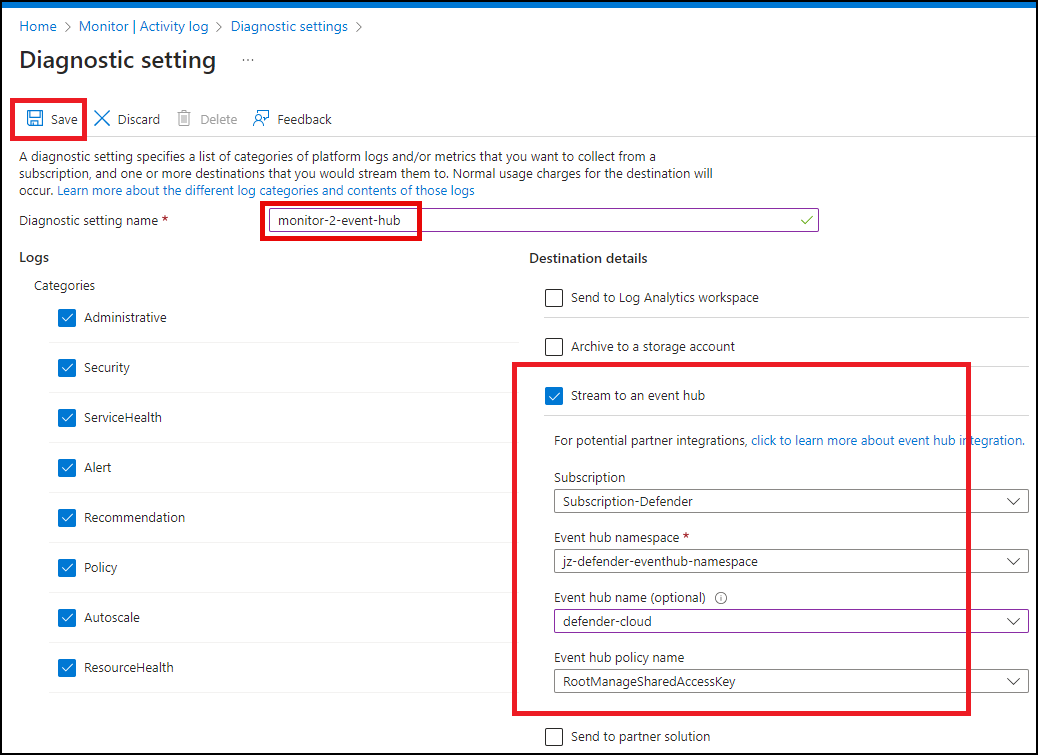
In the Diagnostic setting window:
-
Enter a Diagnostic setting name.
-
Select the Logs you want to stream.
-
Select the check box for Stream to an event hub.
-
For where you want to route the logs, select the Subscription, Event hub namespace, optional Event hub name, and Event hub policy name.
-
-
Click Save,
Adding the Connector in Stellar Cyber
With the access information handy, you can add an Azure Event Hub connector in Stellar Cyber:
-
Log in to Stellar Cyber.
-
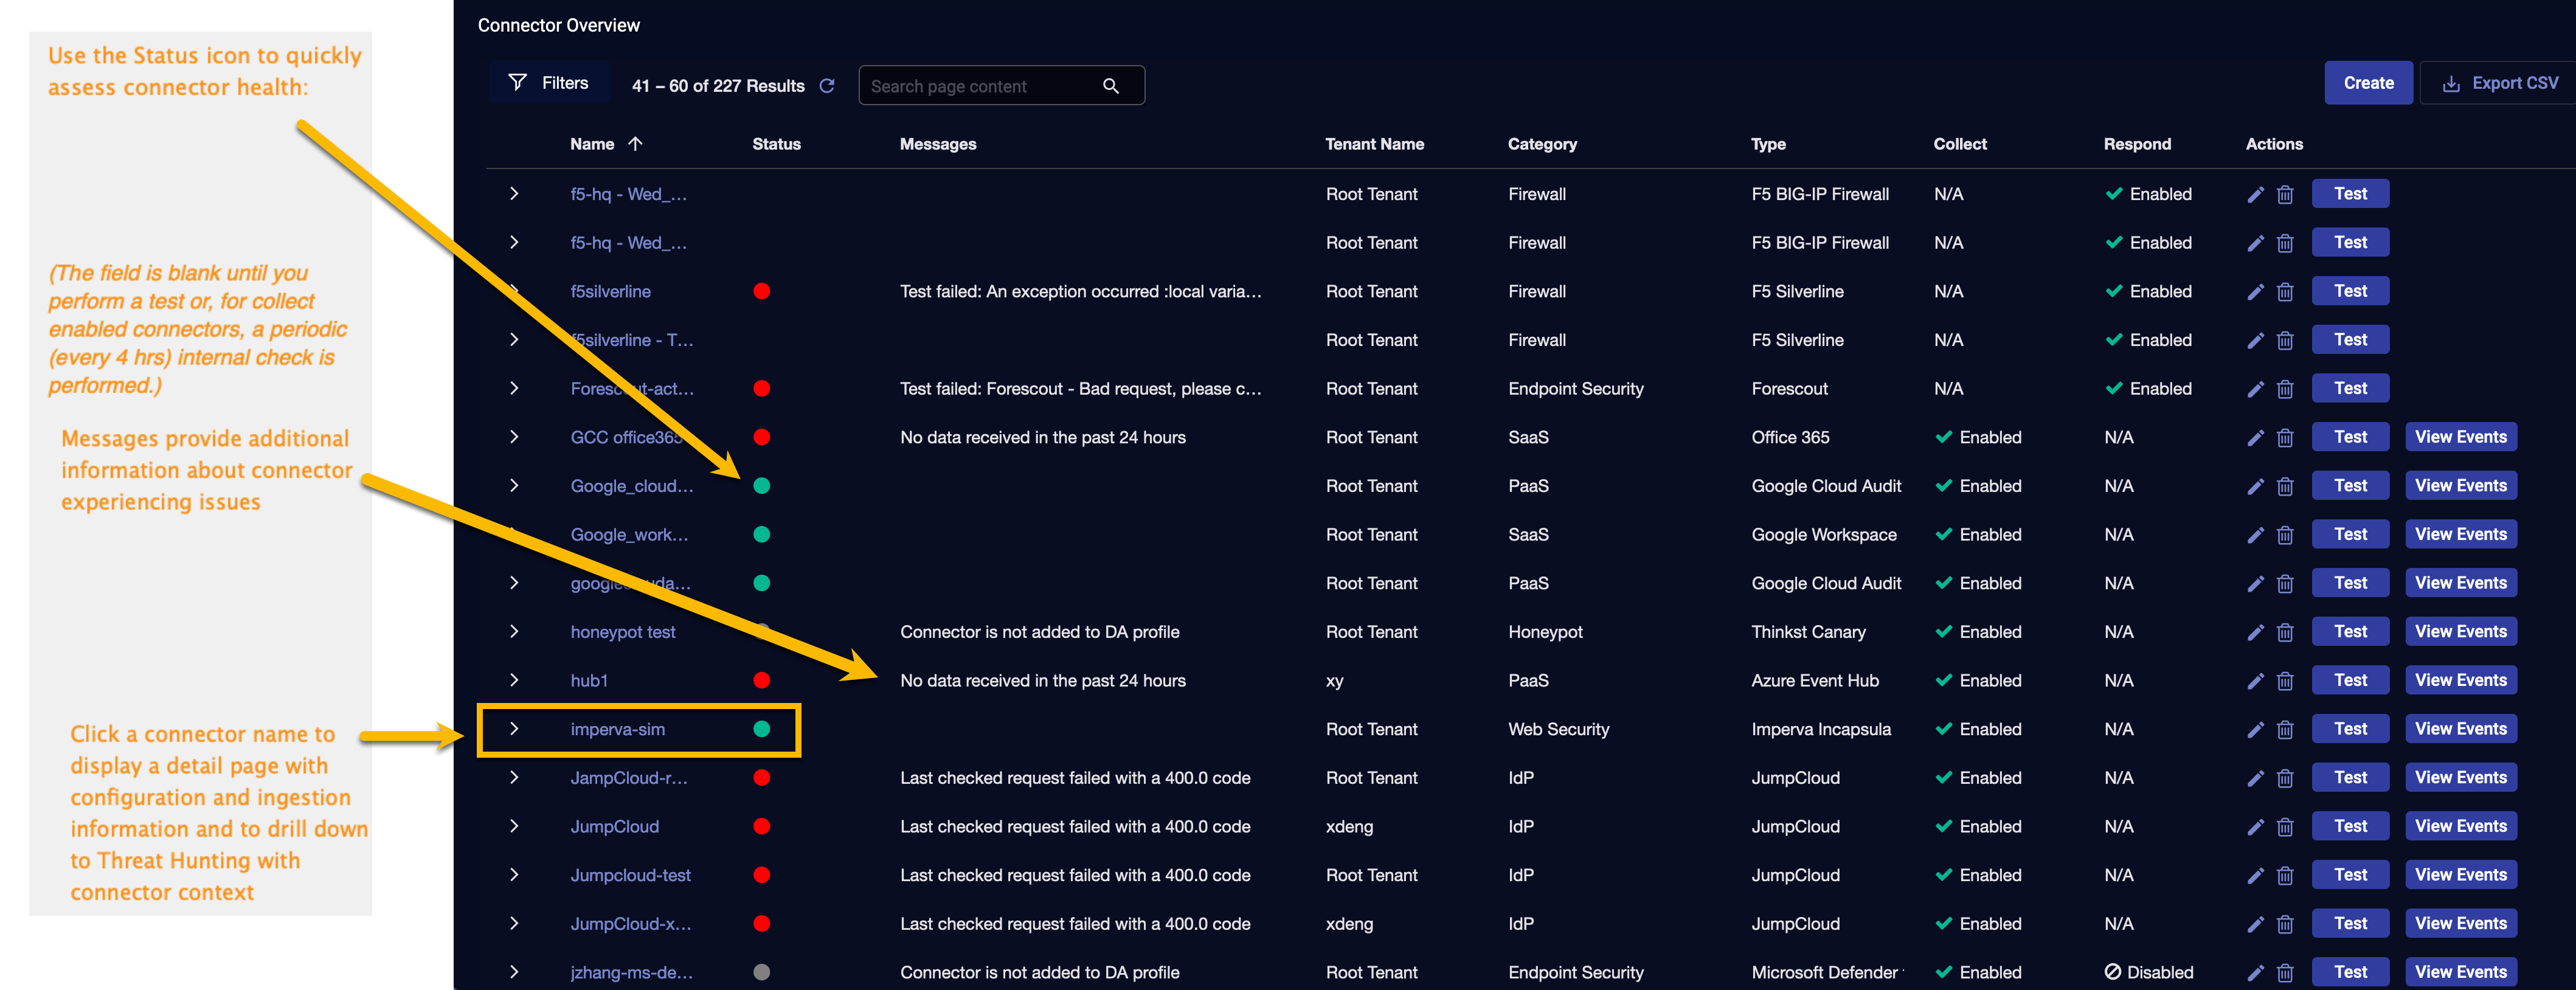
Click System | Integration | Connectors. The Connector Overview appears.
-
Click Create. The General tab of the Add Connector screen appears. The information on this tab cannot be changed after you add the connector.
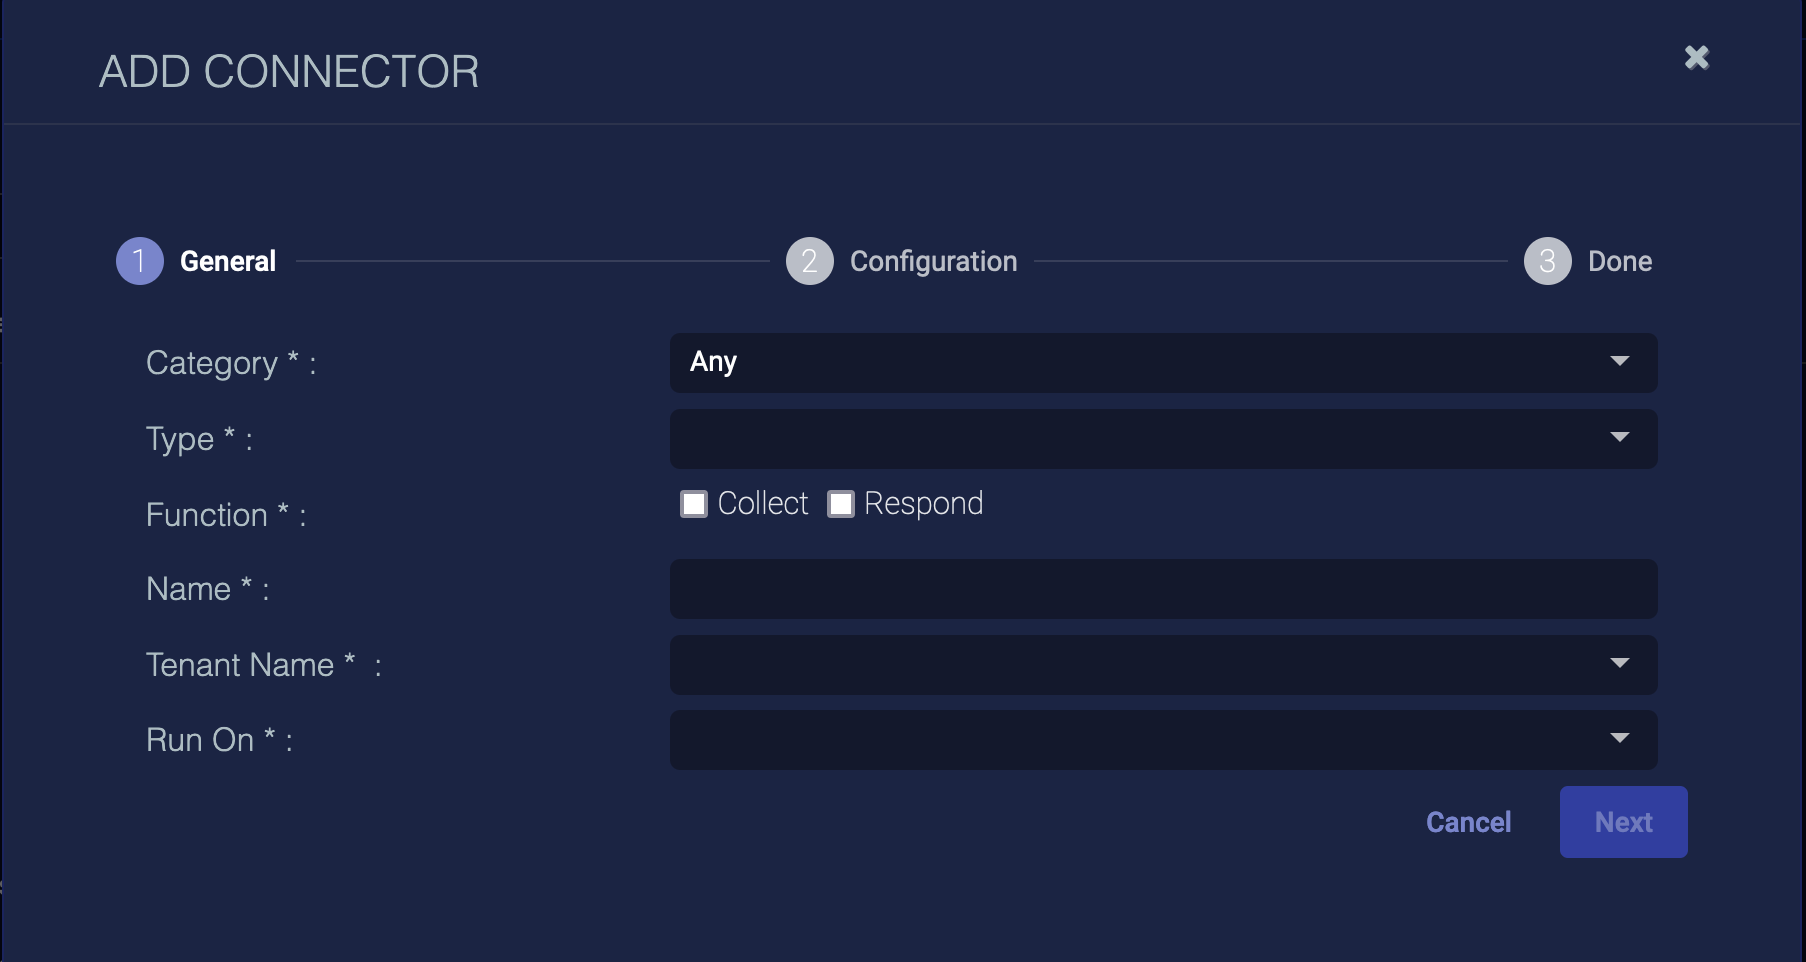
The asterisk (*) indicates a required field.
-
Choose PaaS from the Category drop-down.

-
Choose Azure Event Hub from the Type drop-down.
-
For this connector, the supported Function is Collect, which is enabled already.
-
Enter a Name.
Notes:- This field does not accept multibyte characters.
- It is recommended that you follow a naming convention such as tenantname-connectortype.
-
Choose a Tenant Name. The Interflow records created by this connector include this tenant name.
-
Choose the device on which to run the connector.
-
Certain connectors can be run on either a Sensor or a Data Processor. The available devices are displayed in the Run On menu. If you want to associate your collector with a sensor, you must have configured that sensor prior to configuring the connector or you will not be able to select it during initial configuration.
-
If the device you're connecting to is on premises, we recommend you run on the local sensor. If you're connecting to a cloud service, we recommend you run on the DP.
-
-
(Optional) When the Function is Collect, you can apply Log Filters. For information, see Managing Log Filters.

-
Click Next. The Configuration tab appears.
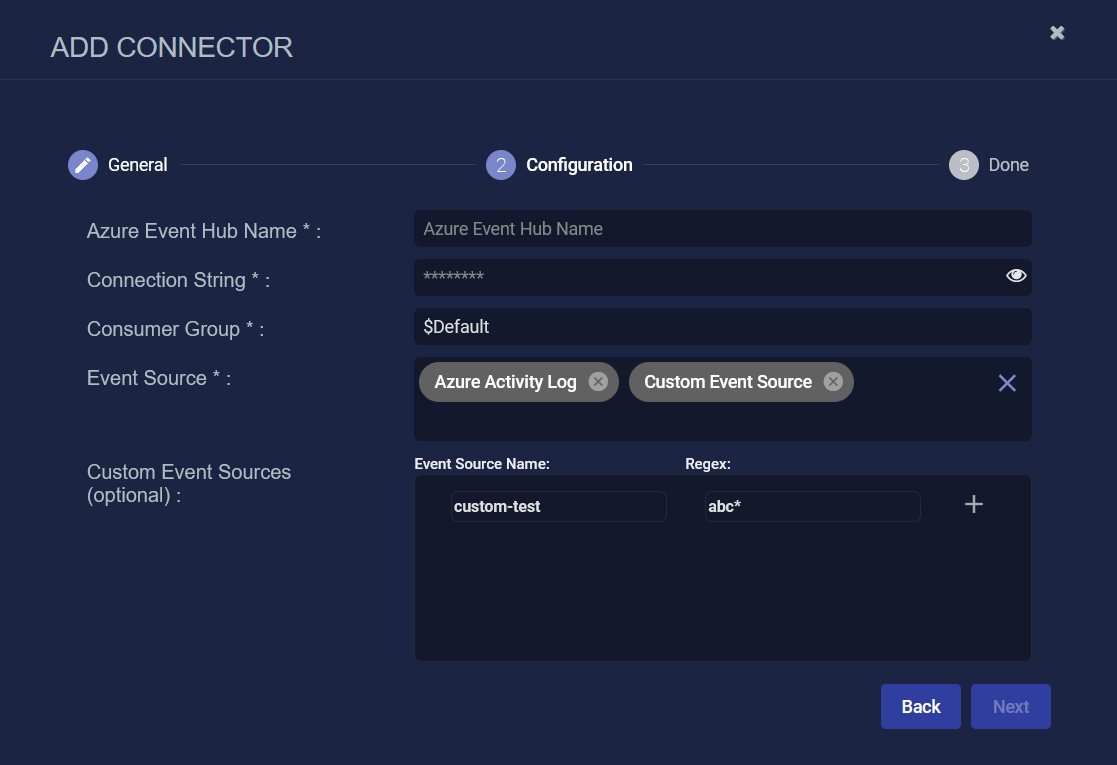
The asterisk (*) indicates a required field.
-
Enter the Azure Event Hub Name you copied earlier.
-
Enter the Connection String you copied earlier.
-
Enter the Consumer Group you copied earlier.
-
Select one or more Event Source. The currently available sources are:
-
Azure Activity Log
-
Azure Bastion
-
Azure Firewall
-
Azure Keyvault
-
Azure Security Center
-
Azure Security Groups
-
Azure SQL Server (includes AuditEvent log
 )
) -
Azure Storage
-
Azure Synapse Workspace
-
Azure Web Application Firewall
-
Microsoft Defender for Cloud
-
The order of the event sources in the above list dictates the content type that will be matched first. The event source that was added first will match first.
-
Custom Event Source (choose only if using optional Custom Event Sources)
-
-
(Optional) Use Custom Event Sources to set up customized event sources that pull specific types of data from Azure Event Hub.
For guidelines on how to create a custom content type, see Creating a Custom Content Type.
-
Select Custom Event Source from the Event Source drop-down menu.
-
In the Custom Event Sources (optional) area, enter a name for the Event Source Name that is unique within the connector. The name will be used for setting the
msg_classin the following format:azure_<customer defined name>. -
Enter a Regex, a Regular Expression that defines a unique string expected in the data, for example,
abc*. The connector looks in Azure Event Hub and pulls any data that matches the Regex. -
Click the + sign to add another custom event source. The recommended maximum is 10.
The order of the event sources in the list dictates the content type that will be matched first. The custom event source that appears in the list at the top will match first, meaning that the one added last will match first.
-
Click the trash can to delete a custom event source.
-
-
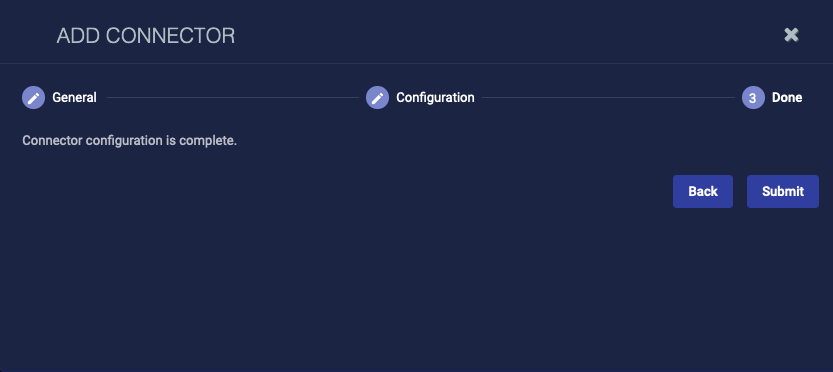
Click Next. The final confirmation tab appears.
-
Click Submit.
To pull data, a connector must be added to a Data Analyzer profile if it is running on the Data Processor.
-
If you are adding rather than editing a connector with the Collect function enabled and you specified for it to run on a Data Processor, a dialog box now prompts you to add the connector to the default Data Analyzer profile. Click Cancel to leave it out of the default profile or click OK to add it to the default profile.
-
This prompt only occurs during the initial create connector process when Collect is enabled.
-
Certain connectors can be run on either a Sensor or a Data Processor, and some are best run on one versus the other. In any case, when the connector is run on a Data Processor, that connector must be included in a Data Analyzer profile. If you leave it out of the default profile, you must add it to another profile. You need the Administrator Root scope to add the connector to the Data Analyzer profile. If you do not have privileges to configure Data Analyzer profiles, a dialog displays recommending you ask your administrator to add it for you.
-
The first time you add a Collect connector to a profile, it pulls data immediately and then not again until the scheduled interval has elapsed. If the connector configuration dialog did not offer an option to set a specific interval, it is run every five minutes. Exceptions to this default interval are the Proofpoint on Demand (pulls data every 1 hour) and Azure Event Hub (continuously pulls data) connectors. The intervals for each connector are listed in the Connector Types & Functions topic.
The Connector Overview appears.
-
The new connector is immediately active.
Creating a Custom Content Type
The following are guidelines to create a custom content type using Custom Event Sources in the Azure Event Hub connector.
-
Collect the log sample from Azure Event Hub directly to understand the log content, because the Stellar Cyber data enrichment and normalization occur after the custom parser matching of the configured Regex from the raw data retrieved from Azure Event Hub.
-
If you are not able to do the above step, then you can use the AzureAllLogs content type to study the data content.
For debugging purposes, you can optionally type AzureAllLogs into the Event Source drop-down menu and press Enter. The content type will display as follows:

The AzureAllLogs content type collects all logs available to the configured credentials. The logs collected this way have the
msg_class: azure_all.Keep in mind that AzureAllLogs is a debugging content type and is not usually used by the customer in normal cases. It may cause conflicting field types in Elasticsearch and thus data loss, because all logs that do not match the existing parser will send data under this content type.
-
To create the custom content type:
-
Select Custom Event Source from the Event Source drop-down menu.
-
In the Custom Event Sources (optional) area, enter a name for the Event Source Name that is unique within the connector.
-
Enter a unique Regex applied to this custom event source only. It can be either a field or value because each event is a string (
body_as_str) before it is converted to a valid JSON object. So use a unique value, a unique field, or both, or multiple values/fields to identify the event source. For information onbody_as_str, see the Microsoft documentation.
-
-
To verify the logs ingested under the custom event source, use the
msg_classas an indicator. Themsg_classfor a custom event source has the following format:azure_<customer defined name>, for example,azure_<source_name>.
Testing the Connector
When you add (or edit) a connector, we recommend that you run a test to validate the connectivity parameters you entered. (The test validates only the authentication / connectivity; it does not validate data flow).
-
Click System | Integrations | Connectors. The Connector Overview appears.
-
Locate the connector that you added, or modified, or that you want to test.
-
Click Test at the right side of that row. The test runs immediately.
Note that you may run only one test at a time.
Stellar Cyber conducts a basic connectivity test for the connector and reports a success or failure result. A successful test indicates that you entered all of the connector information correctly.
To aid troubleshooting your connector, the dialog remains open until you explicitly close it by using the X button. If the test fails, you can select the button from the same row to review and correct issues.
The connector status is updated every five (5) minutes. A successful test clears the connector status, but if issues persist, the status reverts to failed after a minute.
Repeat the test as needed.

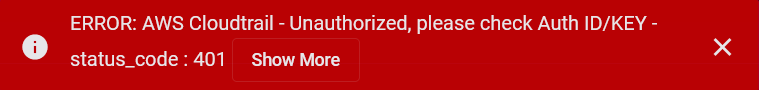
If the test fails, the common HTTP status error codes are as follows:
| HTTP Error Code | HTTP Standard Error Name | Explanation | Recommendation |
|---|---|---|---|
| 400 | Bad Request | This error occurs when there is an error in the connector configuration. |
Did you configure the connector correctly? |
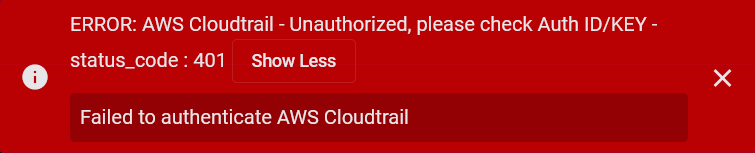
| 401 | Unauthorized |
This error occurs when an authentication credential is invalid or when a user does not have sufficient privileges to access a specific API. |
Did you enter your credentials correctly? Are your credentials expired? Are your credentials entitled or licensed for that specific resource? |
| 403 | Forbidden | This error occurs when the permission or scope is not correct in a valid credential. |
Did you enter your credentials correctly? Do you have the required role or permissions for that credential? |
| 404 | Not Found | This error occurs when a URL path does not resolve to an entity. | Did you enter your API URL correctly? |
| 429 | Too Many Requests |
This error occurs when the API server receives too much traffic or if a user’s license or entitlement quota is exceeded. |
The server or user license/quota will eventually recover. The connector will periodically retry the query. If this occurs unexpectedly or too often, work with your API provider to investigate the server limits, user licensing, or quotas. |
For a full list of codes, refer to HTTP response status codes.
Verifying Ingestion
To verify ingestion:
- Click Investigate | Threat Hunting. The Interflow Search tab appears.
- Change the Indices to Syslog.
- Or, for Microsoft Defender for Cloud logs, change the Indices to Windows Events.
The table immediately updates to show ingested Interflow records.
For custom event sources, the unique name provided during configuration displays in Threat Hunting with a msg_class containing an azure prefix. For example, if the unique name is test, the msg_class in Threat Hunting is azure_test.![]()
