Managing the Data Analyzer
You must have Root scope to use this feature.
One of the main functional components of Stellar Cyber is the Data Analyzer (DA) module. Each installation needs at least one and more can be added to increase capacity and fault tolerance. The collection of Data Analyzers and other modules that are parts of the same installation are referred to as a "cluster."
Both the cluster and each Data Analyzer instance are identified by a name that the user assigns.
Each Data Analyzer instance is designated either a "master" or a "worker." There can be any number of workers but only one master at any given time.
This screen enables the user to add and remove Data Analyzers to and from the cluster.
Improper use of this screen can negatively affect Stellar Cyber operations.
Data Analyzer Table
When you click System | Data Processor | Data Analyzer, Stellar Cyber displays a table listing all the currently configured Data Analyzers. An example is shown in the image below:
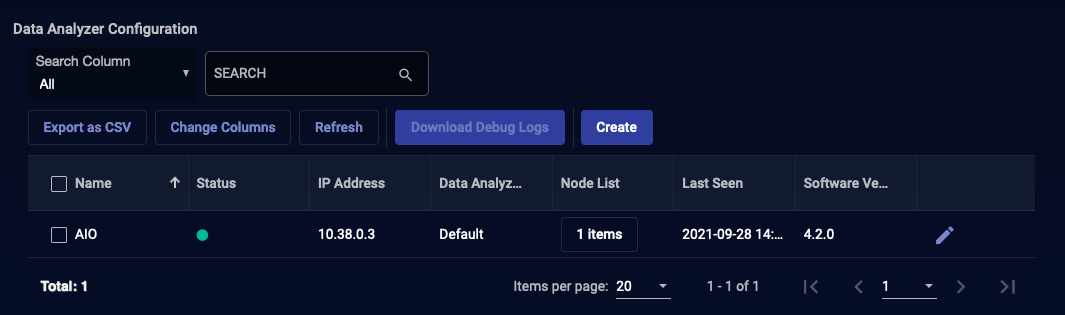
The table columns are described as follows:
- Name—The name of the DA instance.
- Status—The last recorded status.
- IP Address—The IP address in use by the DA.
- Data Analyzer Profile—The name of the profile that configures this DA instance.
-
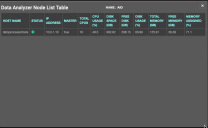
Node List—Click the Node List button in this column to display a list of nodes within the Data Analyzer, as shown below:
- Last Seen—Time of last status recording.
- Software Version—The version of software in use.

You can perform the following tasks in the Data Analyzer list:
-
Click Create to add a new Data Analyzer to the table. See the following section for a description of this process.
-
Click the Check box at the start of one or more rows, then click the Download Debug Logs button (details below).
-
Click the
 button to edit the associated Data Analyzer record. See the section below for a description of the process.
 -
Click the
 button to remove the associated Data Analyzer from the table.
See the Tables page for more information on working with tables.
Create / Add / Edit Data Analyzer
The dialog box for adding or editing a Data Analyzer is very similar, as shown in the example below.
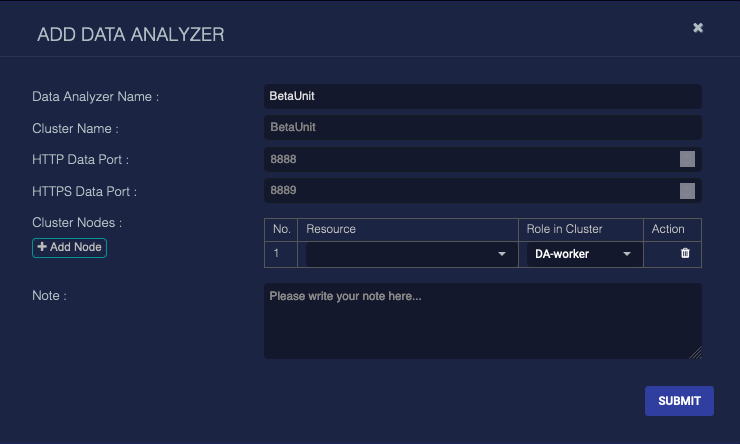
The fields available are:
- Data Analyzer Name—A name for the Data Analyzer instance. This field does not support multibyte characters.
- Cluster Name—The name of the cluster to which the DA will belong.
- HTTP Data Port—The TCP/UDP port number to be used for HTTP data transfer.
- HTTPS Data Port—The TCP/UDP port number to be used for HTTPS (secure) data transfer.
- Cluster Nodes—The cluster nodes that make up the Data Analyzer. This is shown as a table below this field with the following controls:
- Add Node —Clicking this button will add a new row to the table.
- Resource—
- Role In Cluster—This is a selection between master and worker.
- —Click this option to delete this row.
- Note—Arbitrary text that may be of use. This field does not support multibyte characters.
Click the Submit button to edit or create the Data Analyzer. Clicking on the button in the upper right corner dismisses the dialog box and discards all changes.
Download Debug Logs
If directed by Customer Support to obtain your log files, you can select one or more rows to download debug logs. After making a selection this button above the table is activated. When you click the button, you are given the opportunity to confirm the download. If you confirm the download, the system creates a tar file of all the debug logs, then downloads them to the location specified in your web browser.
