Managing Log Filters
You can create log filters that are used by sensor profiles to drop logs before they are transmitted to the Data Processor. Use this topic to understand how to define a log filter from the System menu or from data in the Event Display.
You can also use the Log Filters created in this page as Event Filters in a Windows Server Sensor profile or in Connectors. The Windows tab in the Create Standard Sensor Profile wizard includes Event Filter panels to include or exclude matching events. ![]()
Creating or Editing Log Filters from Log Filters Table
You must have Root scope to use this feature.
-
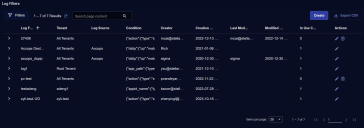
Click System | Collection | Log Filters. A table for managing Log filters is displayed.
-
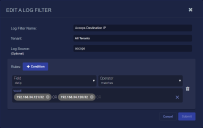
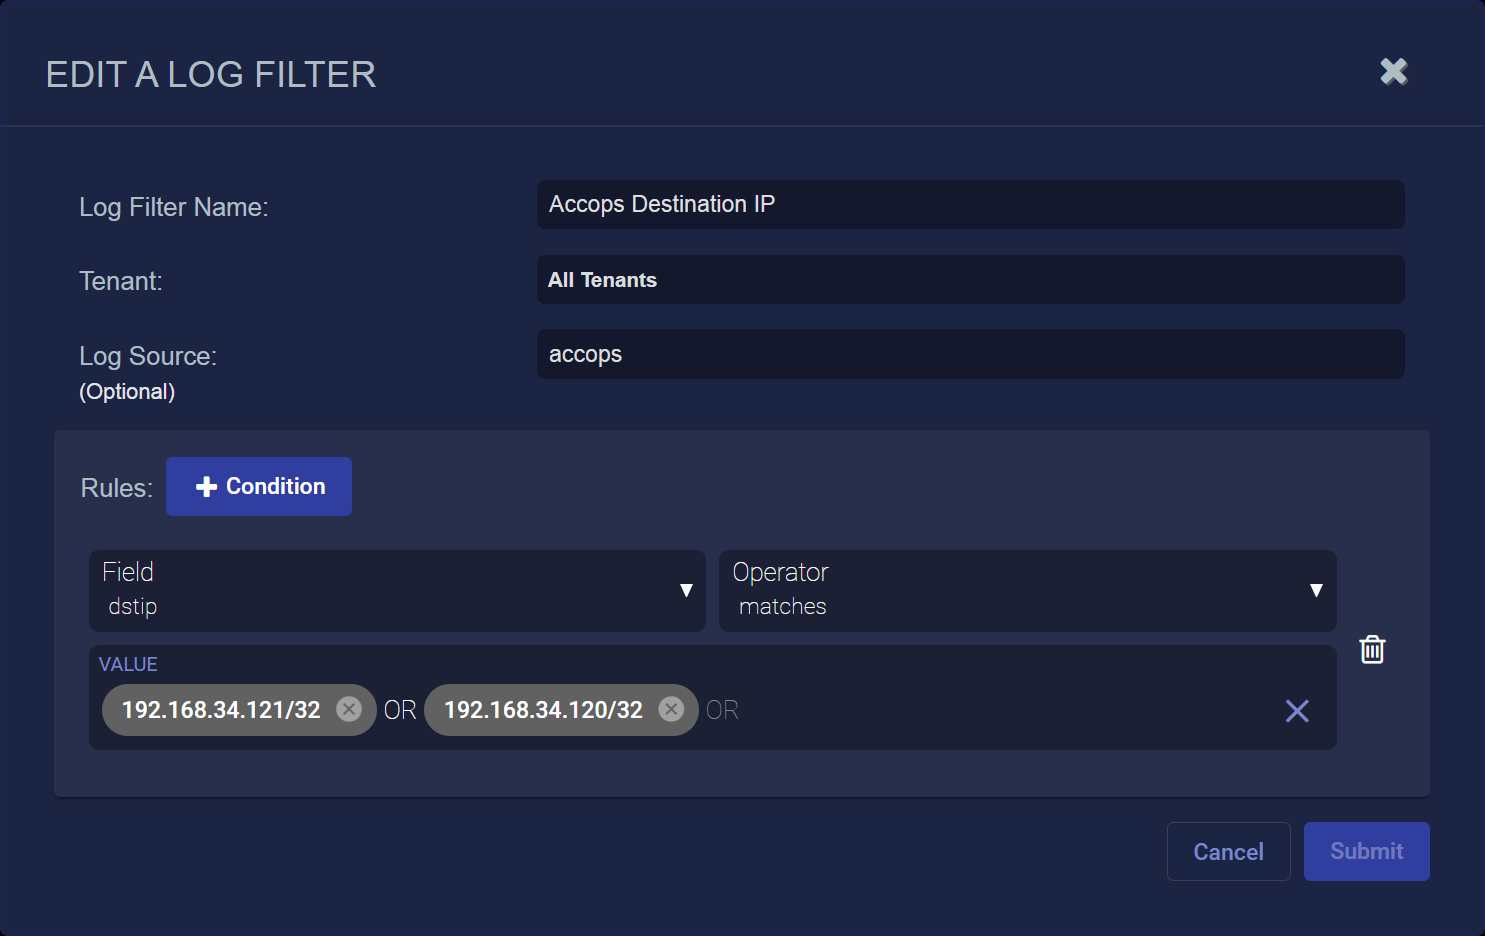
Click Create to add a filter (the Add A Log Filter screen appears) or click the pencil button to edit a row.
-
Enter the Log Filter Name.
To improve usability, Stellar Cyber recommends that you use unique names for log filter names across all tenants. This way, when a user with access to multiple tenants selects a log filter, they do not have to contend with duplicate names.
-
Choose a Tenant.
-
Choose an optional Log Source. Use this field if you want to apply the filter to a log forwarder.
Leave this field empty if you want to apply the filter to a connector or to a Windows sensor event log.

-
Click Condition. You can add multiple conditions, all of which are AND conditions.
-
Choose a Field.
-
Choose an Operator.
-
Enter the Values for your condition.
-
Click Submit. The filter is immediately available, but is not active until you include it in a sensor profile.

Applying Log Filters in Different Places
-
You can add the filter to a modular sensor profile under Log Forwarder | Data Filtering.
-
You can add the filter to a standard sensor profile under Feature Customization | Sensor | Log Forwarder.
-
You can add the filter as an Event Filter for Windows Server Sensors in the Windows tab of the standard sensor profile.
-
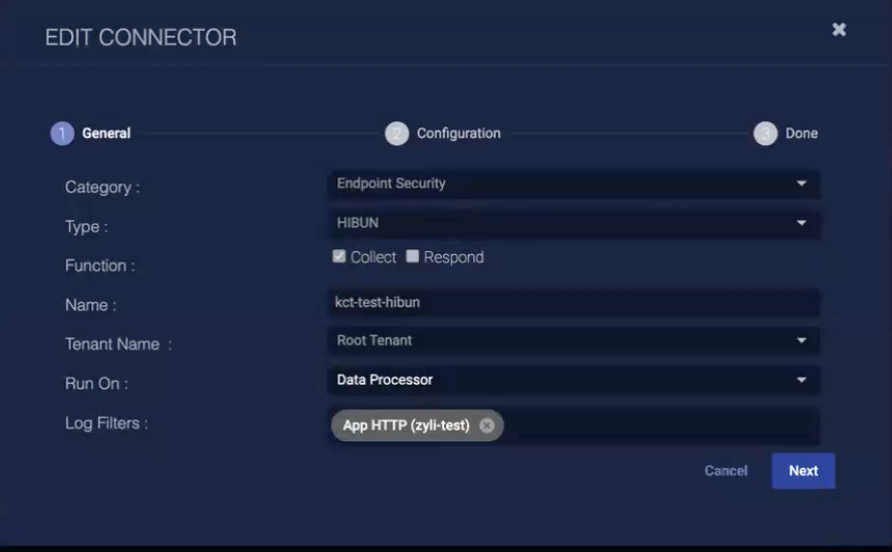
You can add the filter as an exclude filter to a Connector if your connector includes the Log Filters field at the bottom of the General configuration page, where you select the name of a filter, as illustrated below:

You can view statistics for each connector content type for each filter by choosing the Sensor Monitoring index in Investigate | Threat Hunting.
Log Filter Maximums
Keep in mind the following maximums when creating log filters:
-
The maximum number of Conditions (rules) per log filter is 10.
-
The maximum number of log filters that can be applied to a single connector is 10. Connectors only support Exclude filters.
Keeping Tabs on Log Filter Statistics
You can keep tabs on statistics related to log filters using the show logfilter and show logfilter < filter-id> commands in the sensor CLI. The show logfilter-id command shows the details of the last matching event during filtering and can be useful when evaluating filter performance.
In addition, log filter statistics are sent to the Sensor Monitoring index (aella-ade-*) on the DP using msgtype:41 and can be viewed in the Threat Hunting page with Indices set to Sensor Monitoring. See below for the schema.
{
    "msgtype": 41,
    "msg_origin": {
        "processor": {
            "type": "log_forwarder", "winlog", "fim", "log_collector", or, "aella_flow"
            "name": # Optional. It is <connector_name> when type is "connector".
            "id": # Optional. NG-SaaS, connector has id.
        }
    }
    "engid": # For connector running on DP, it is <connector type>_<connector name>
    "engid_name": # For connector running on DP, it is <connector type>_<connector name>
    "tenantid":
    "filter_id":
    "filter_name":
    "timestamp": # epoch ms
    "exclude_hits_delta": # Optional. The number of exclude hits of the filter by the processor since last report
    "exclude_bytes_delta": # Optional. The size of excluded logs matched the filter by the processor since last report
    "include_hits_delta": # Optional. The number of include hits of the filter by the processor since last report
    "include_bytes_delta": # Optional. The size of included logs matched the filter by the processor since last report
    "last_log": # Optional. The string of the latest log which was matched the filter
}
Log Filter Rules
Keep in mind the following rules when creating log filters:
-
Log filters work on raw log fields and do not support fields enriched by Stellar Cyber.
-
Log filters do not work on fields with a list of objects (for example, the
msg_datafield).
Keeping Track of Log Filter Performance
The Log Filters table provides the following columns to help you track log filter performance:
-
In Use – Shows you how many sensor profiles are using a particular log filter.
-
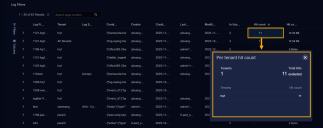
Hit count – Shows you how many logs have been excluded by the log filter in the time window specified by the global filters at the top of the display. You can click the entry to see the hit counts broken out by tenant.
-
Hit count size – Shows you the total size of the logs excluded by the log filter in the time window specified by the global filters at the top of the display. You can click the entry to see the volume of logs excluded by the log filter broken out by tenant.

Creating Log Filters from the Event Display
You can also create log filters directly from the Event Display interface. This lets you pre-populate the log filter settings from the selected Interflow data. Note that this feature is only available when working with Interflow data from the Syslog, Traffic, ML-IDS/Malware Sandbox, or Win Events indices.
The following example illustrates setting a log filter directly from the Event Display interface:
-
Navigate to Investigate | Threat Hunting.
-
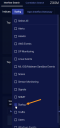
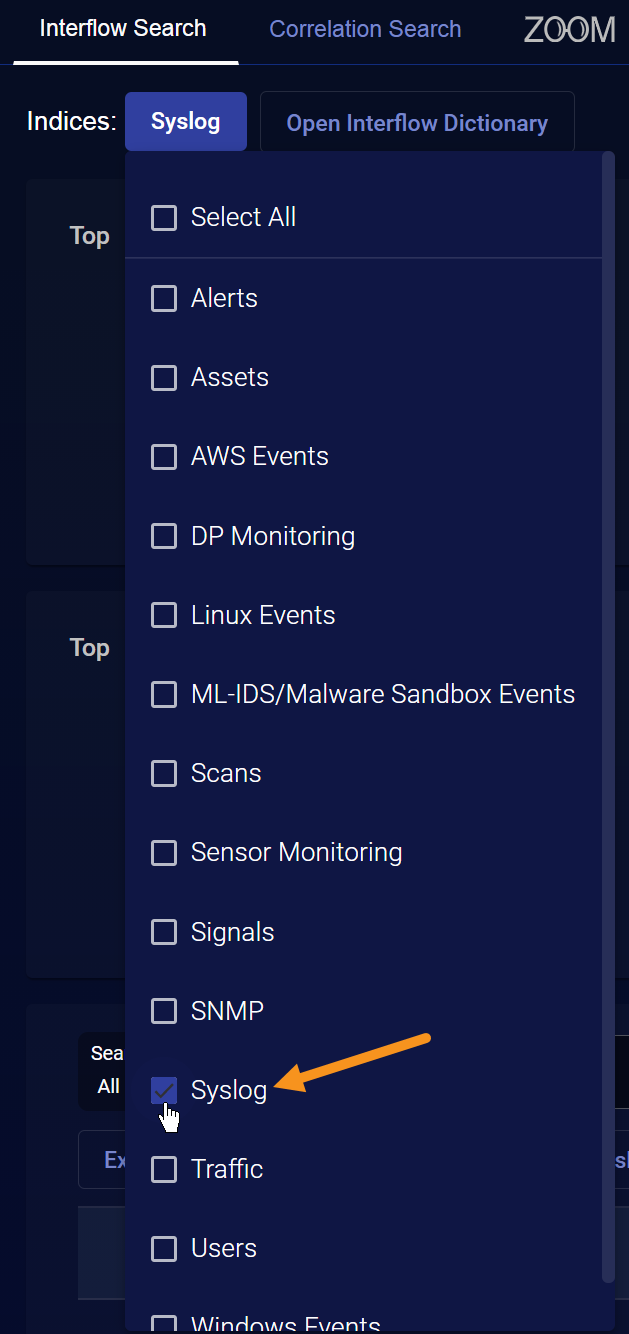
Set the Indices option to Syslog, Traffic, ML-IDS/Malware Sandbox, or Win Events. In this example, we've selected Syslog.
-
Scroll down to the table of events from the Syslog index and click the More Info button for the entry you'd like to use as the source of a log filter.
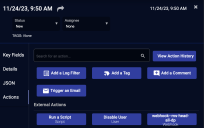
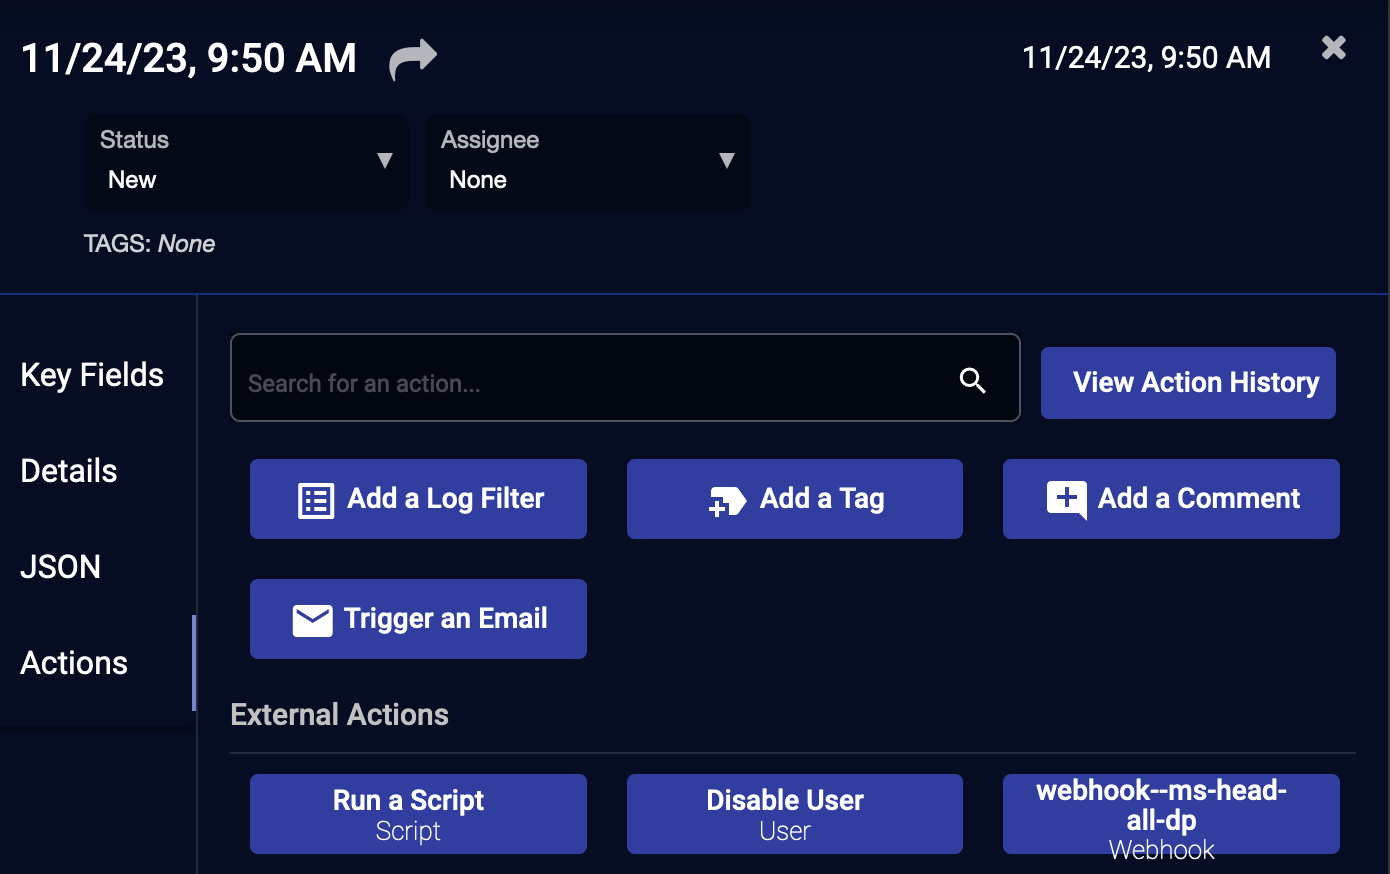
The Event Display appears.
-
Click the Add a Log Filter button to display the standard Add a Log Filter interface.
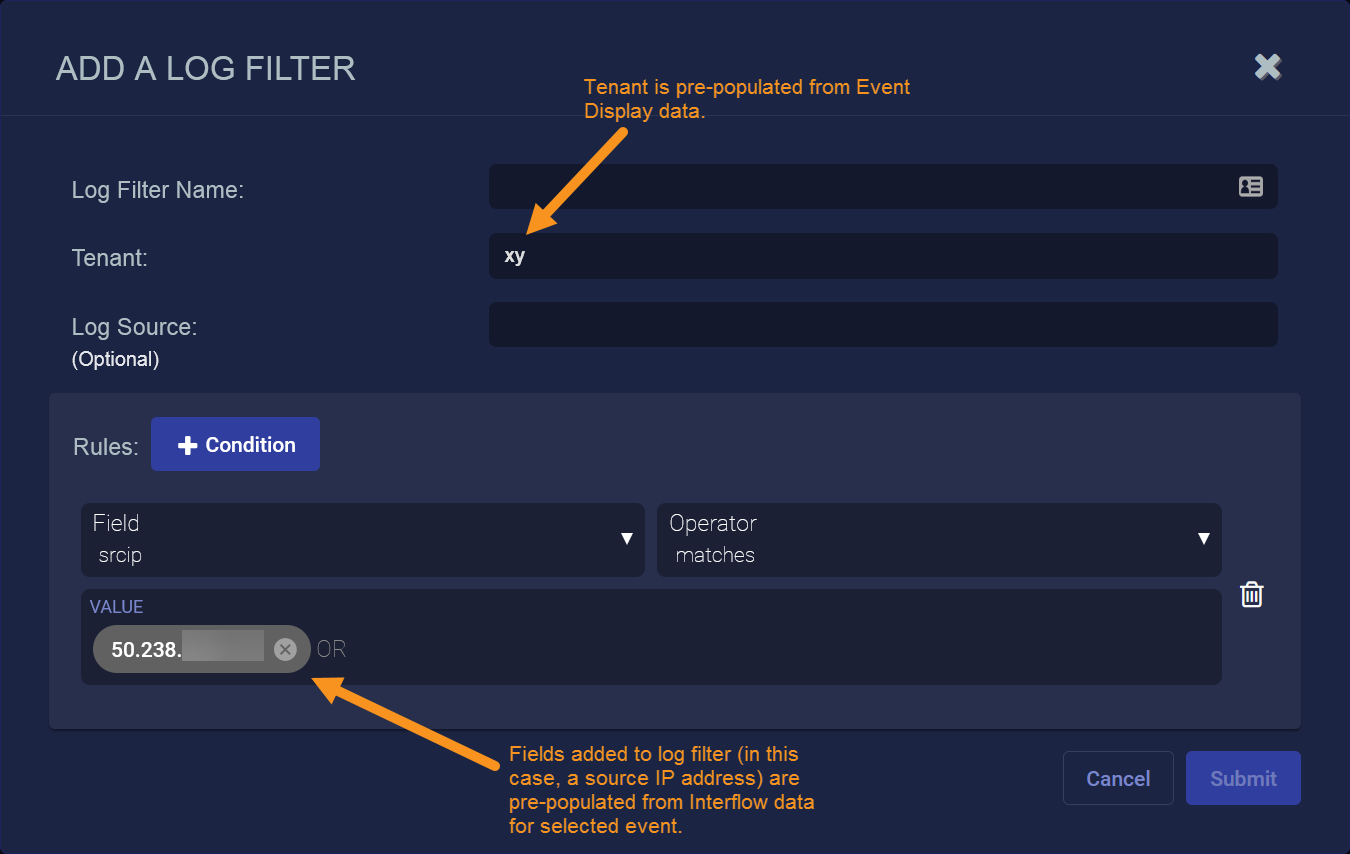
-
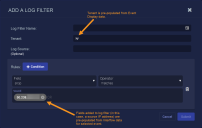
Stellar Cyber automatically pre-populates the Tenant field from the Event Display data. In addition, whenever you add a Field to the log filter, Stellar Cyber automatically pre-populates its setting from the associated Interflow data. For example, the illustration below shows a source IP address pre-populated from a syslog event's Interflow data.
- Click Submit. The filter is immediately available, but is not active until you include it in a sensor profile.
-
You can add the filter to a modular sensor profile under Log Forwarder | Data Filtering.
-
You can add the filter to a standard sensor profile under Feature Customization | Sensor | Log Forwarder.
-
You can add the filter as an Event Filter for Windows Server Sensors in the Windows tab of the standard sensor profile.
