Configuring Standard Sensor Profiles
Whether you add or edit a standard sensor profile you have the same options, except you cannot edit the profile name. Standard sensor profiles can only be applied to standard sensors. To add a standard sensor profile:
-
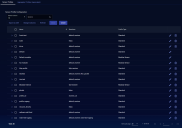
Click System | Collection | Sensor Profiles. The Sensor Profile Configuration page appears, with the Sensor Profile tab displayed by default.
-
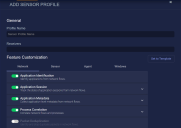
Click Create and select Add Standard Sensor Profile. The ADD SENSOR PROFILE screen appears.
-
Enter the Profile Name. We recommend that you establish a naming convention, so you can understand the intent of each profile by looking at the name. This field can only contain alphanumeric characters, underscores, spaces, and dashes.
-
Choose at least one Receiver. Each sensor profile must have at least one receiver, which is the destination of the data it collects. You can add one receiver of each type: packet and JSON.
See the Receiver configuration page for more information on creating and maintaining receivers.
-
Use the Set to template button to apply an available template to some of your profile settings. Currently, templates are available for settings in the Windows tab. Separate templates let you apply Low, Medium, and High volume settings for Windows server sensors, depending on your deployment needs. Refer to Windows Customizations for details on the available settings.
-
Customize your profile settings. The available settings are explained below.
-
Click Submit. The profile is immediately active.

Customizing Standard Sensor Profile Features
The available customizations are grouped into tabs under Feature Customization, providing control over:
-
Network – Network, Linux Server, and container sensor settings
-
Sensor – Malware, IDS, log forwarder, and buffering settings
-
Agent – Settings for Server Sensors
-
Windows – Settings specific to Windows Server sensors
To enable or disable an option or group of options within the tab, click on the toggle for that option. To open a group of options to fine-tune your customization, click on the name of the group (or anywhere else away from the toggle).
Network Customizations
These settings apply to network, Linux, and container sensors.
Application Identification
Enable this option for the network sensor to identify applications associated with events.
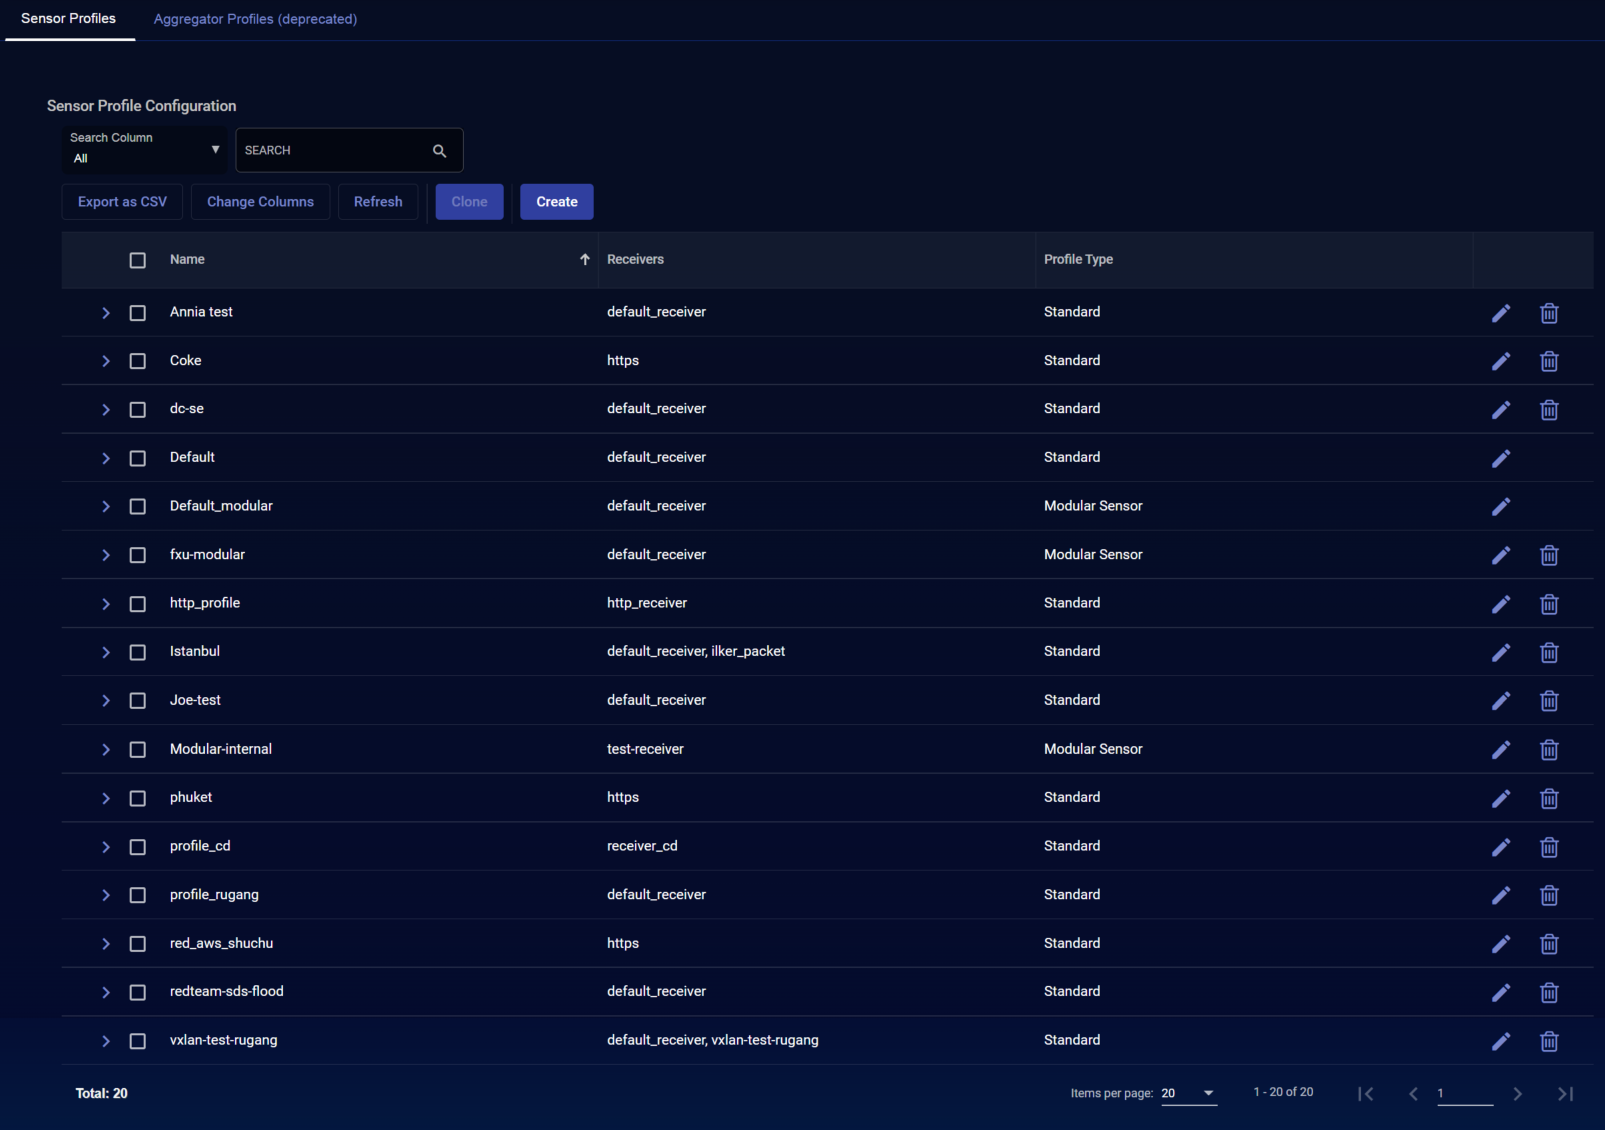
Application Session
Enable this for the sensor to identify the length of individual network sessions. The parameters specify how often to report the session information, and what length of time to apply when determining that a session has ended.
If you disable Application Session, network and agent sensors stop sending data to the DP, but data sensors continue to process traffic.
If you enable Session Combine, UDP sessions from the specified port to the same destination are combined into a single session.
Application Metadata
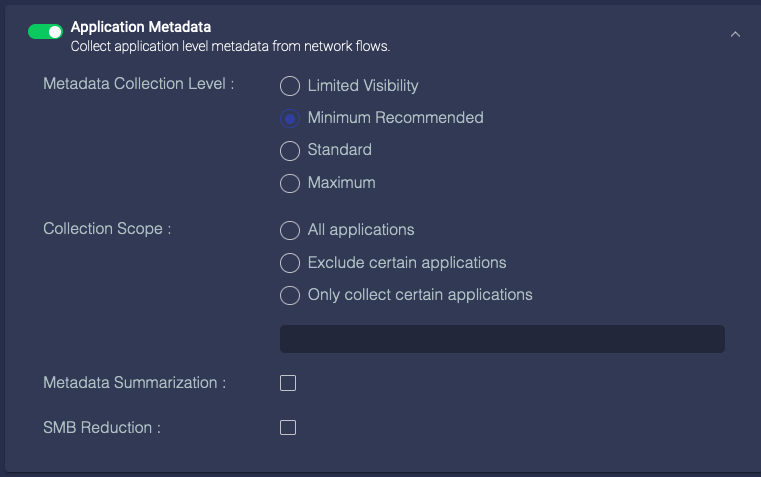
Enable this to control how application information is collected and which applications are included.
You can disable the collection of application metadata to increase sensor performance and save storage space, but that limits collected data to:
-
Basic session information
-
Packet and byte counts
-
IP address
-
Port
You can set the Metadata Collection Level to Limited Evidence, Minimum, Standard, or Maximum. This controls how many of the information fields are collected.
- 0zz0 login
- 0zz0 password
- activesync login
- aim_express contact_login
- aim_express login
- aims login
- archive login
- archive password
- badongo login
- badongo password
- badoo contact_login
- badoo login
- badoo password
- bebo login
- bebo password
- dhcp agent
- dhcp chaddr
- dhcp ciaddr
- dhcp client_fqdn
- dhcp domain_name
- dhcp dns_server
- dhcp end
- dhcp end_status
- dhcp giaddr
- dhcp host_name
- dhcp inherit_parent
- dhcp ip_lease_time
- dhcp message_type
- dhcp option
- dhcp option_type
- dhcp option_value_buffer
- dhcp request
- dhcp router
- dhcp siaddr
- dhcp sname
- dhcp subnetmask
- dhcp xid
- dhcp yiaddr
- dimp login
- dimp password
- dns dns_entry
- dns dns_query
- dns end
- dns tunneling
- dns flags
- dns host
- dns host_addr
- dns host_addr6
- dns host_type
- dns message_type
- dns name
- dns query
- dns query_type
- dns reply_code
- dns reverse_addr
- dns reverse_addr6
- dns section_type
- dns transaction_id
- dns ttl
- ebuddy contact_login
- ebuddy login
- ebuddy password
- facebook login
- facebook password
- facebook_mail login
- friendster login
- friendster password
- ftp content_type
- ftp data_port
- ftp filename
- ftp filesize
- ftp index
- ftp loadway
- ftp login
- ftp password
- ftp method
- ftp return_code
- ftp transfer_duration
- gmail_basic login
- gmail_chat login
- gmail_mobile login
- gmail_mobile password
- gmx login
- hi5 login
- hi5 password
- http auth_username
- http auth_password
- http code
- http index
- http method
- http proxy_auth
- http proxy_login
- http proxy_realm
- http referer
- http server
- http uri
- http filename
- http file_type
- http forward_addr
- http forward_addr6
- http host
- http mime_type
- http part_content_type
- http user_agent
- ica login_info
- ica login_info_utf16
- icmp code
- icmp message
- icmp rtt
- icmp type
- kakaotalk login
- krb5 error_code
- krb5 login
- krb5 server
- krb5 message_type
- krb5 service
- laposte_webmail login
- ldap hostname
- ldap name
- linkedin login
- live_groups login
- live_hotmail login
- livemail_mobile login
- mailru login
- maktoob login
- mimp login
- mimp password
- msn contact_login
- msn login
- mysql login
- mysql query
- mysql request
- mysql result_set
- mysql sqlstate_code
- mysql number_columns
- mysql number_rows
- mysql query_id
- netflix login
- netlog login
- netlog password
- nfs filename
- nfs filesize
- nfs type_string
- nfs symlink_name
- nfs uid
- niconico_douga login
- nntp login
- nntp password
- odnoklassniki login
- odnoklassniki password
- oovoo login
- orangemail login
- owa login
- paltalk contact_login
- paltalk login
- paltalk_transfer login
- pap login
- pap password
- perfspot login
- perfspot password
- pop3 password
- postgres authentification_type
- postgres error
- postgres login
- postgres password
- postgres query
- postgres query_id
- postgres sqlstate_code
- postgres number_columns
- postgres number_rows
- qq contact_login
- qq login
- qq_transfer login
- radius login_ipv6_host
- radius login
- rambler login
- rambler password
- rambler_webmail rambler_webmail
- rapidshare login
- rapidshare password
- rdp default_username
- rdp username_ascii
- rdp username_raw
- rlogin client_login
- rlogin server_password
- rsh login
- rsh remote_login
- rsync login
- rsync password
- rtmp page_url
- secondlife login
- skyblog login
- skyblog password
- slsk login
- slsk password
- smb login
- smb user_id
- smb nt_status
- smb command_string
- smpp receiver
- smpp sender
- smtp login
- smtp password
- smtp response_code
- snpp login
- snpp password
- socks5 login
- socks5 password
- spdy server_agent
- spdy user_agent
- squirrelmail login
- squirrelmail password
- ssh version
- ssl common_name
- ssl issuer
- ssl subject_alt_name
- ssl validity_not_after
- ssl version
- ssl validity_not_before
- tagged login
- tagged password
- tango login
- tchatche login
- tchatche password
- tds login
- tds password
- tds sqlstate_code
- tds query
- tds query_id
- tds number_columns
- tds number_rows
- teamspeak login
- teamspeak password
- telnet login
- telnet password
- tftp filename
- tftp filesize
- tftp query
- tftp request_filename
- tns login
- tns password
- tns query
- tns sqlstate_code
- twitter login
- twoo login
- twoo password
- ustream login
- ustream password
- viadeo login
- viadeo password
- vkontakte login
- vkontakte password
- winmx login
- yahoo_groups login
- yandex login
- yandex password
- yandex_webmail login
- ymail2 login
- ymail_classic login
- ymail_mobile_new login
- ymail_mobile_new password
- ymsg_conf login
- ymsg contact_login
- ymsg login
- ymsg_transfer login
- ymsg_video login
- ymsg_webmessenger contact_login
- ymsg_webmessenger login
- youtube login
- youtube password
- zimbra login
- zimbra password
- zimbra_standard login
- zimbra_standard password
Minimum collects everything in Limited Evidence. There is currently no difference between Minimum and Limited Evidence.
- amqp class
- amqp type
- amqp method
- amqp replyto
- amqp routing_key
- dhcp circuit_id
- dhcp remote_id
- dhcp remote_id_subtype
- dhcp remote_id_type
- dns web_application_info
- dns ancount
- dns arcount
- dns nscount
- dns opcode
- dns qdcount
- ftp return_content
- ftp offset
- ftp inherit_parent
- ftp data_port_end_offset
- ftp data_port_start_offset
- ftp_data inherit_key
- http cache_control
- http connection_header
- http content_disposition
- http content_encoding
- http content_len
- http cookie
- http date
- http end
- http etag
- http expires
- http image_type
- http is_webdav
- http location
- http ntlm_domain
- http ntlm_user
- http ntlm_workstation
- http part_filename
- http part_header_name
- http part_header_value
- http part_name
- http request
- http request_size
- http server_agent
- http set_cookie
- http smb_client
- http version
- http video_type
- http video_url
- icmp seq
- icmp typeval
- icmp wrong_crc
- krb5 err_cname_name
- krb5 err_sname_name
- krb5 realm
- ldap krb5_enc_data
- ldap krb5_enc_data_type
- ldap krb5_err_cname
- ldap krb5_err_cname_name
- ldap krb5_err_cname_type
- ldap krb5_err_crealm
- ldap krb5_err_data
- ldap krb5_error_code
- ldap krb5_err_realm
- ldap krb5_err_sname
- ldap krb5_err_sname_name
- ldap krb5_err_sname_type
- ldap krb5_err_text
- ldap krb5_kdcoptions
- ldap krb5_message
- ldap krb5_message_type
- ldap krb5_pa_data
- ldap krb5_pa_data_type
- ldap krb5_pa_data_value
- ldap krb5_realm
- ldap krb5_server
- ldap krb5_service
- ldap krb5_ticket
- ldap krb5_ticket_enc_part
- ldap krb5_ticket_name
- ldap krb5_ticket_name_type
- mysql end
- mysql bind_variable
- mysql variable_id
- mysql variable_type
- mysql variable_value
- nfs current_state
- nfs gid
- nfs mode
- nfs procedure
- nfs status
- nfs type
- nfs version
- pop3 attach_filename
- pop3 file_type
- pop3 login_server
- pop3 login
- pop3 received_by_name
- pop3 received_date
- pop3 receiver
- pop3 received_from_name
- pop3 receiver_email
- pop3 sender
- pop3 sender_email
- pop3 subject
- postgres variable_format
- postgres variable_id
- postgres variable_type
- postgres variable_value
- postgres base
- postgres proto_version
- postgres server_version
- rpc message_type
- rpc procedure
- rpc program
- rpc xid
- sip authorization_username
- smb filename
- smb filesize
- smb file_type
- smb directory
- smb domain
- smb file_id
- smb host
- smb krb5_error_code
- smb krb5_err_text
- smb krb5_ticket
- smb loadway
- smb native_os
- smb path
- smtp attach_filename
- smtp attach_size
- smtp file_type
- smtp received_by_name
- smtp received_date
- smtp received_from_name
- smtp receiver
- smtp receiver_email
- smtp sender
- smtp sender_email
- smtp server
- smtp subject
- snmp method
- snmp name
- snmp oid
- snmp value_raw
- snmp version
- spdy location
- spdy mime_type
- ssl certif_sha1
- ssl handshake_type
- ssl organization_name
- ssl parent_common_name
- ssl protocol_version
- ssl server_name
- syslog code
- tds bind_variable
- tds variable_id
- tds variable_type
- tds variable_value
- telnet term_type
- tftp mode
- tns client_hostname
- tns server_hostname
- tns bind_variable
- tns variable_id
- tns variable_type
- tns variable_value
- amqp correlation_id
- amqp exchange_type
- amqp revision
- amqp server_major_version
- amqp server_minor_version
- ica application
- ica application_utf16
- ica priority
- ica service
- mysql base
- pop3 attach_disposition
- pop3 attach_transfer_encoding
- pop3 date
- pop3 received_by_ip
- pop3 received_from_ip
- pop3 received_server_agent
- pop3 received_with
- pop3 receiver_alias
- pop3 receiver_type
- pop3 sender_alias
- pop3 user_agent
- rpc program_version
- rpc state
- rpc version
- sip inherit_key
- sip inherit_parent
- sip method
- sip reply_code
- sip request_call_id
- sip user_agent
- smb attributes
- smb ext_attributes
- smb file_attributes
- smb file_chunk_data_offset
- smb file_chunk_len
- smb krb5_enc_data
- smb krb5_enc_data_type
- smb krb5_err_cname
- smb krb5_err_cname_name
- smb krb5_err_cname_type
- smb krb5_err_crealm
- smb krb5_err_data
- smb krb5_err_realm
- smb krb5_err_sname
- smb krb5_err_sname_name
- smb krb5_err_sname_type
- smb krb5_kdcoptions
- smb krb5_message
- smb krb5_message_type
- smb krb5_pa_data
- smb krb5_pa_data_type
- smb krb5_pa_data_value
- smb krb5_realm
- smb krb5_server
- smb krb5_service
- smb krb5_ticket_enc_part
- smb krb5_ticket_name
- smb krb5_ticket_name_type
- smb search_attributes
- smb search_pattern
- smb security_blob
- smb service
- smb service_data
- smb session_key
- smb share_access
- smtp attach_disposition
- smtp attach_transfer_encoding
- smtp content_language
- smtp content_transfer_encoding
- smtp date
- smtp received_by_ip
- smtp received_from_ip
- smtp received_server_agent
- smtp received_with
- smtp receiver_alias
- smtp receiver_type
- smtp replyto
- smtp sender_alias
- smtp server_agent
- smtp start_time
- smtp stop_time
- smtp user_agent
- tns base
- tns client_os
- tns client_program_name
- tns client_program_path
- tns response_size
- tns server_os
- tns server_port
- tns version
Collection Scope allows you to filter specific metadata that is sent to the Data Processor.
-
Select All applications for no traffic filtering
-
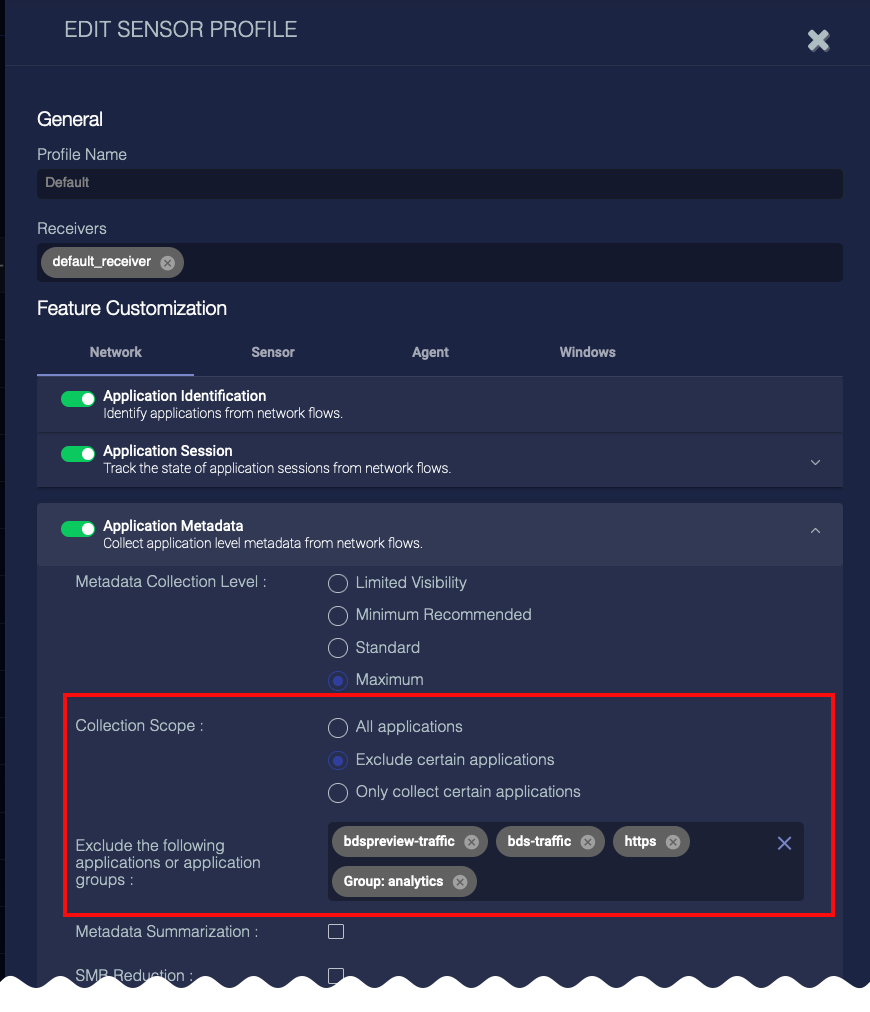
Select Exclude certain applications to collect metadata for all content except the applications and application groups you specify in the selector box. .
-
Select Only collect certain applications to exclude all metadata except that for the applications and application groups you specify in the selector box.
When you select an option other than All applications, the selector box accordingly updates for you to then Exclude or Include the following applications or application groups. Begin typing in the selector box to display a list of configured Application Groups and Applications. Applications Groups are listed first; scroll through the list to get to the set of Applications. When you select an Application Group, the label for it is has a prefix (Group: ) to distinguish it from Applications. In the above image, all the selections are applications except analytics.
In previous releases, Application Groups were referred to as Tags.
Metadata Summarization allows you to reduce traffic to the DP. If you enable this, the sensor groups similar metadata from chatty applications into a single JSON file before sending to the DP.
Finally, you can enable SMB Reduction to reduce the amount of metadata collected for SMB commands. This is especially helpful in increasing your compression ratio if your network has a great deal of SMB traffic. If you enable this, metadata is only collected for:
- session setup
- logoff
- read
- write
Process Correlation
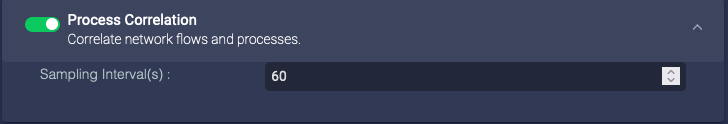
Enable this to build correlations between processes running on the sensor and host, and the IP address/port visible in traffic. The processes monitored include:
- log forwarder
- IDS
- maltrace
- aella_flow
- SSHD
- HTTP
You can set the sampling time interval.
Packet Deduplication
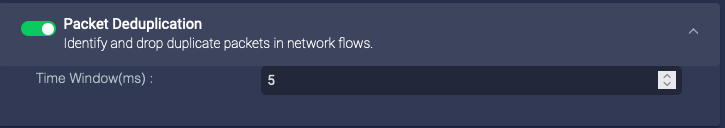
Enable this for the sensor to perform packet deduplication. This reduces storage by removing duplicate data. However, it uses processing power on the sensor to analyze the data, and can significantly slow system performance. When you enable it, you can set the deduplication window time.
Enable with caution.
If you have no need for this (for example, if you have a sensor for every network segment), disable it.
Packet Forwarding
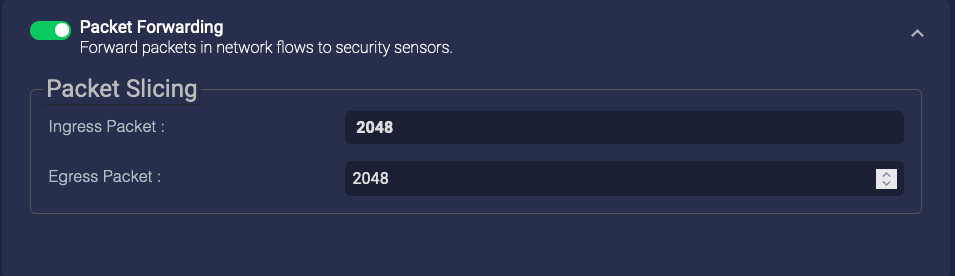
Enable this to perform packet slicing on forwarded packets, which breaks packets into the specified size. This has no effect if you use local file assembly.
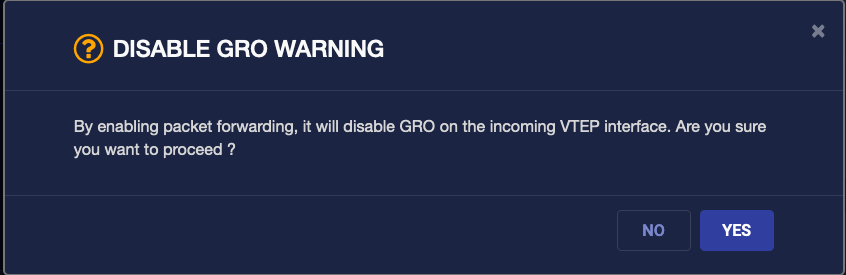
When you enable this option, the Disable GRO Warning appears. GRO is generic receiver offload. Click YES to continue. Click NO to return to the configuration screen without enabling packet forwarding.
Keep in mind the following notes when using packet forwarding:
-
Before you enable packet forwarding on a CentOS Linux Server Sensor, disable SELinux on CentOS.
-
Packet forwarding is not supported for Linux Server Sensors monitoring bonded interfaces.
-
Packet forwarding cannot be used to send packets from one Modular Sensor to another Modular Sensor. It can, however, be used for the following scenarios:
-
Send packets from a Network Sensor to a Security Sensor
-
Send packets from a Network Sensor to a Modular Sensor with security sensor features enabled.
-
-
Packet forwarding requires a receiver in the sensor profile.
-
If you disable packet forwarding, you must also remove the receiver from the profile.
Stream Slicing
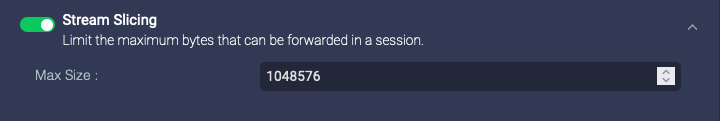
Enable this to perform stream slicing, which truncates sessions at the specified length. This can reduce the bandwidth used.
This has no effect if you use local file assembly.
Handshake Failure
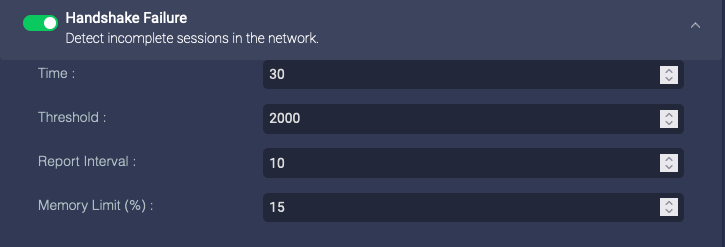
Enable this to detect handshake failures and allocate resources for that effort:
-
Time(s)—amount of time the sensor collects failures to get to the threshold
-
Threshold—the number of failures over the specified time before an alert on this is triggered
-
Report Interval(s)—interval between reports to the DP if there are multiple failures
-
Memory Limit (%)—maximum percentage of memory used by
aella_flowfor this detection
Flood Attack
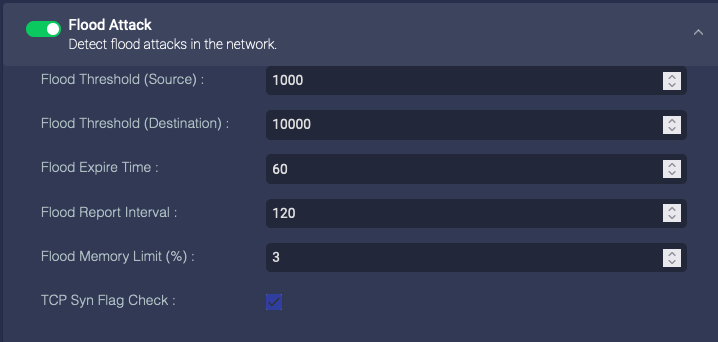
Enable this to report flood attacks:
-
Flood Threshold (Source)—the number of new session requests per second from a single source before an attack is reported
-
Flood Threshold (Destination)—the number of new session requests per second from any source before an attack is reported
-
Flood Expire Time(s)—the number of seconds without new session requests after which we stop considering it an attack, and the sensor sends a
session_endmessage to the DP -
Flood Report Interval(s)—during an attack, the interval at which the sensor reports the attack to the DP (so that the DP isn't flooded with reports of the flood attack)
-
TCP Syn Flag Check—only counts session requests if the SYN flag in the packet is set
Sensor Customizations
The security sensor settings let you configure:
-
Malware Sandbox
-
ML-IDS
-
Log Forwarder
-
Buffering
Malware Sandbox
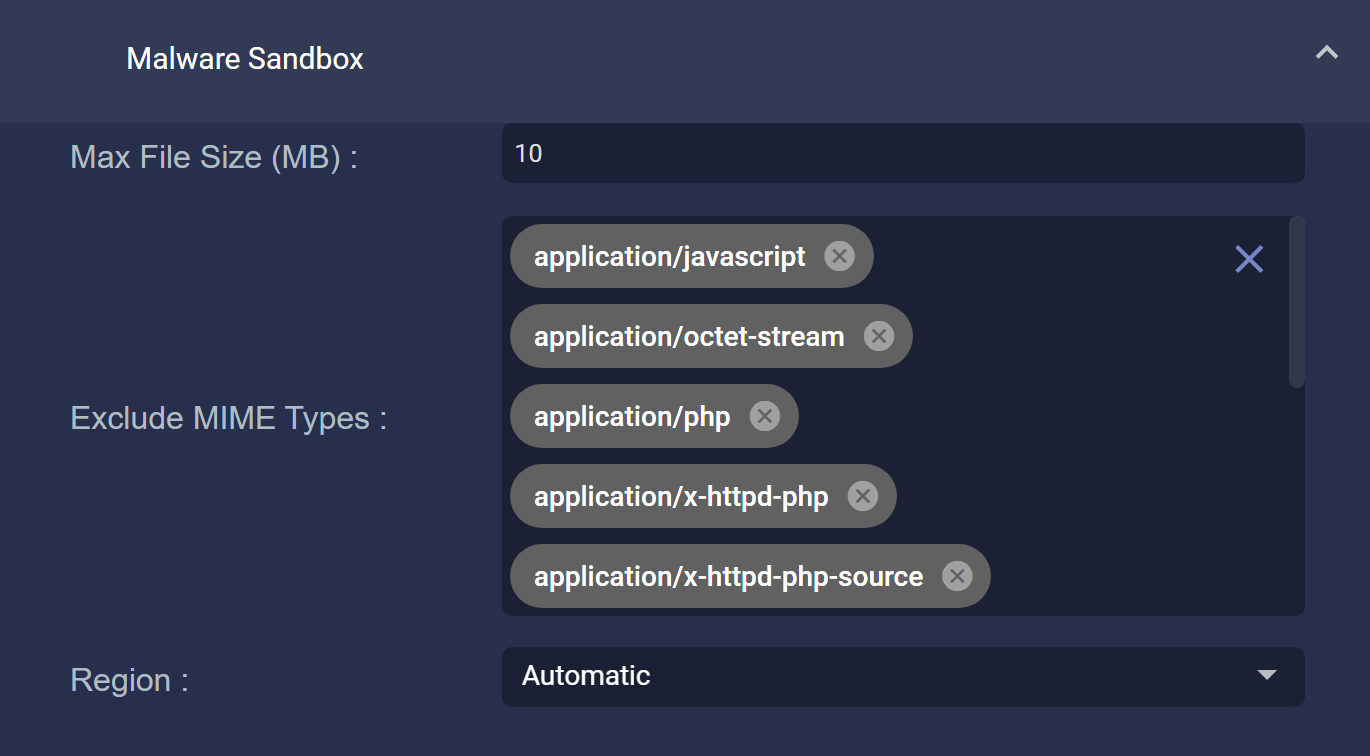
Configure the scanned files' size and type, as well as a the region for the sandbox to be used.
- Max File Size (MB) – Specifies the largest file that will be scanned. The default and maximum values are both 10 MB.
-
Exclude MIME Types – Specifies which file types are scanned.
 Click here to see the file types that are excluded from scanning by default:
- application/javascript
- application/octet-stream
- application/php
- application/x-httpd-php
- application/x-httpd-php-source
- applicaiton/x-php
- image/bmp
Click here to see the file types available for scanning inclusion/exclusion:
-
application/encodedjscript
-
application/encodedvbscript
-
application/hangul-word
-
application/java-archive
-
application/javascript
-
application/llappbundle-document
-
application/llappbundle-macos-executable
-
application/llappbundle-web-replay
-
application/llappbundle-windows-executable
-
application/msoffice-doc
-
application/msoffice-doc-encrypted
-
application/msoffice-docm
-
application/msoffice-docx
-
application/msoffice-dotm
-
application/msoffice-mime-doc
-
application/msoffice-mime-ppt
-
application/msoffice-mime-xls
-
application/msoffice-potm
-
application/msoffice-ppsm
-
application/msoffice-ppsx
-
application/msoffice-ppt
-
application/msoffice-ppt-encrypted
-
application/msoffice-pptm
-
application/msoffice-pptx
-
application/msoffice-publisher
-
application/msoffice-xls
-
application/msoffice-xls-encrypted
-
application/msoffice-xlsb
-
application/msoffice-xlsm
-
application/msoffice-xlsx
-
application/msoffice-xltm
-
application/octet-stream
-
application/oxps
-
application/pdf
-
application/php
-
application/tar
-
application/vnd.adobe.xdp+xml
-
application/vnd.android.package-archive
-
application/vnd.ms-cab-compressed
-
application/vnd.ms-xpsdocument
-
application/vnd.oasis.opendocument
-
application/vnd.tcpdump.pcap
-
application/war-archive
-
application/wordperfect
-
application/x-7z-compressed
-
application/x-7zip-sfx-pe
-
application/x-ace
-
application/x-apple-diskimage
-
application/x-bzip
-
application/x-chm
-
application/x-com
-
application/x-dosexec
-
application/x-eicar
-
application/x-gzip
-
application/x-httpd-php
-
application/x-httpd-php-source
-
application/x-hwp
-
application/x-iso9660-image
-
application/x-java-class
-
application/x-lastline-test
-
application/x-lha
-
application/x-lzma
-
application/x-mach-o-binary
-
application/x-mach-o-fat-binary
-
application/x-ms-shortcut
-
application/x-msi
-
application/x-nuget
-
application/x-pe
-
application/x-php
-
application/x-rar
-
application/x-rar-sfx-pe
-
application/x-rar5
-
application/x-shockwave-flash
-
application/x-spreadsheetml
-
application/x-udf-image
-
application/x-wordprocessingml
-
application/x-xar
-
application/x-xz
-
application/x-zip-sfx-pe
-
application/zip
-
data/email-rfc2822
-
image/bmp
-
image/gif
-
image/jpeg
-
image/png
-
image/svg
-
image/tiff
-
image/webp
-
image/x-icon
-
text/css
-
text/hta
-
text/html
-
text/javascript
-
text/php
-
text/plain
-
text/rtf
-
text/vba
-
text/vbscript
-
text/x-msdos-batch
-
text/x-perl
-
text/x-php
-
text/x-powershell
-
text/x-python
-
text/x-shellscript
-
text/x-wsf
- Region – Secifies the geographical region of the malware sandbox used by this profile. By default, this option is set to Automatic and the sensor selects the sandbox with the lowest latency relative to its own location. You can optionally override the Automatic option and choose a sandbox in a specific geographic location from the dropdown.

Note: This feature is new in the 4.3.5 release. Sensors upgraded from previous releases all use the Automatic option by default until a new profile with a different setting for the Region option is applied.
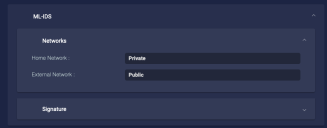
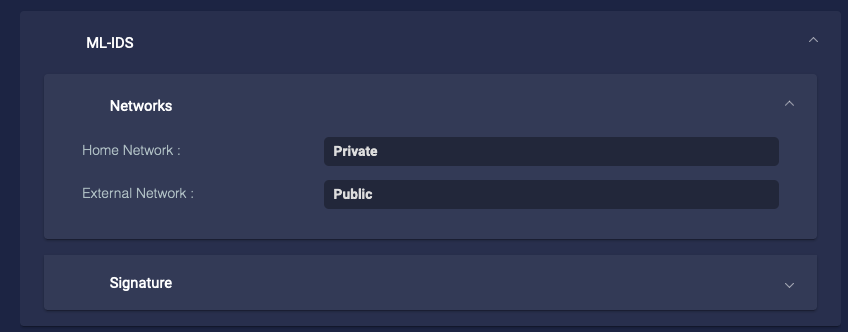
ML-IDS
Control the sensor's ML-IDS functions:
-
Network
-
Home Network—Choose the home network. If you choose Specific, you can enter the IP address range.
-
External Network—Choose the external network. If you choose Specific, you can enter the IP address range.
-
-
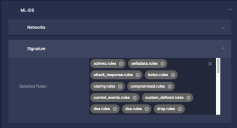
Signature—Choose the rule sets to use. These rules are integrated by Stellar Cyber from 3rd party threat intelligence. You can choose which rule sets to use, but you cannot add your own rules.

Log Forwarder
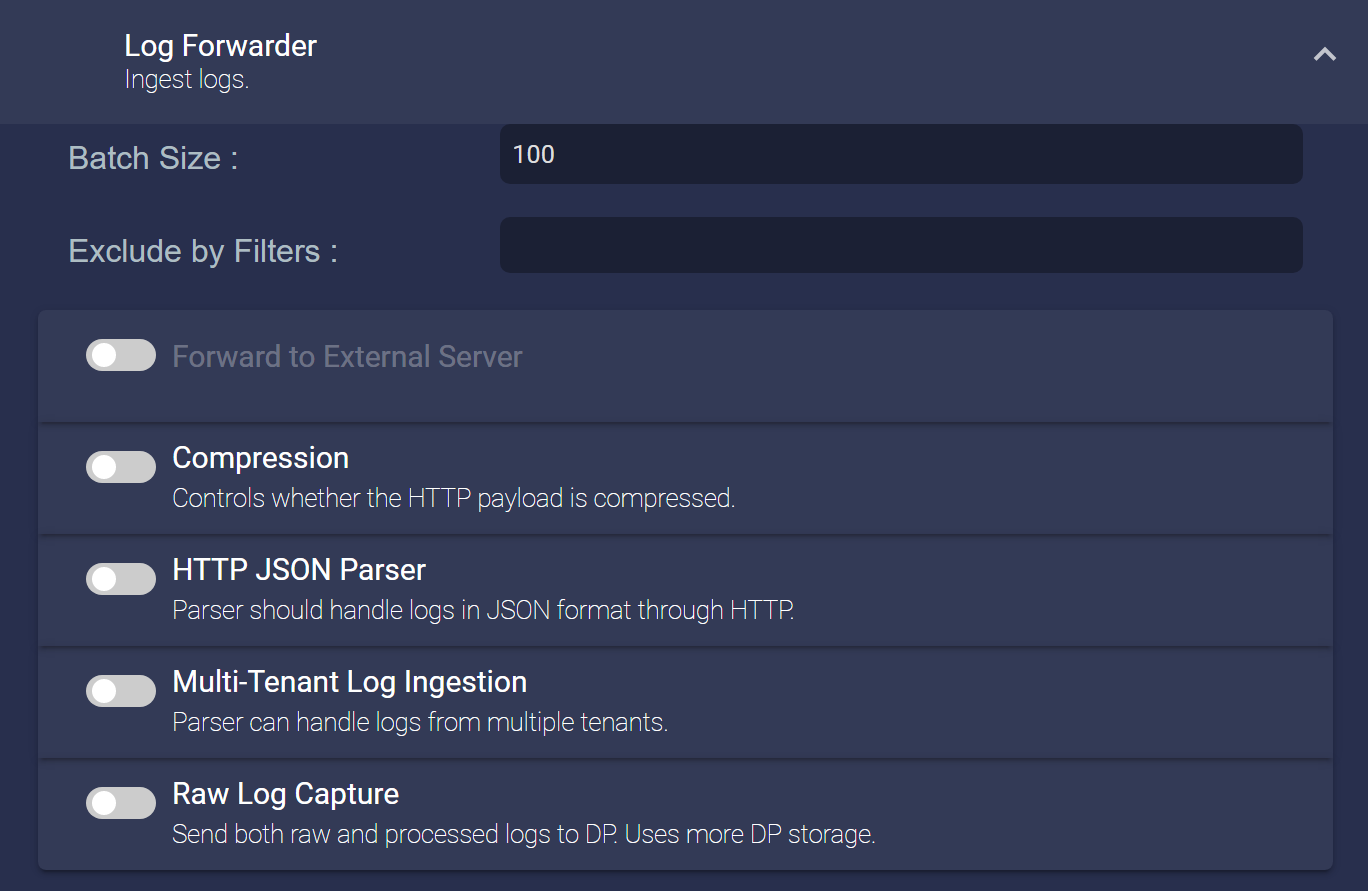
You can configure the following options for the Log Forwarder:
-
Number of Workers – Set the number of workers. (Default=4)
Adjust this setting to half the number of CPUs and memory that will be available on the sensor(s) to be associated with this profile. Ensure there is sufficient memory on the sensors for the number you set: each worker consumes 1Gb of memory. Adjust the worker number, as needed, but do not exceed the total CPUs and sensor memory.
Note: The Number of Workers option no longer appears starting with the 4.3.5 release. Instead, the system sets the number of workers automatically based on available sensor resources and the number of features enabled. You can see the number of workers assigned using the show logforwarder command in the Sensor CLI.
-
Batch Size – Set the record batch size. The default is 100 records. The range is 1-10000.
The sensor batches log records, to make transmission more efficient. If your network has high throughput, increase the Batch Size to increase that efficiency.
-
Exclude By Filters – Choose log filters to filter traffic out before sending it to the DP. You can create log filters at System | Collection | Log Filters.
Stellar Cyber recommends configuring no more than 50 Log Forwarder filters in this field for one sensor profile. Exceeding this recommended maximum can affect sensor performance. This limit is separate from the limits for Event Filters set in the Windows tab for Windows Server Sensors.
-
Forward to an External Server
To send unparsed logs to an external server (the logs are still also sent to the DP):
Logs containing non-printing characters, such as Netflow and IPFIX, cannot be forwarded to an external server.
All log lines are truncated to 1024 characters, per RFC 3164.
-
Click Forward to External Server.
-
Enter the IP address or domain name of that server.
-
Enter the port.
-
Uncheck Send Metadata if you don't want the sensor to add metadata to the logs forwarded to your external server. If you leave it checked, the sensor adds the log source IP address, ingestion port number, and log source type to the original log, in JSON format.
-
-
Compression can be enabled to direct the sensor to compress the parsed logs before sending to the DP. This uses the CPU on the sensor to compress the logs, and the CPU on the DP to decompress. Enable compression to save bandwidth at the expense of CPU on the sensor and DP.
-
HTTP JSON Parser can be enabled if you are sending logs via HTTP.
-
Multi-Tenant Log Ingestion can be enabled to allow CEF (Infocyte), Cylance, and selected Stellar JSON parsers to receive logs from multiple tenants. In addition to this setting, the incoming data file must follow specific guidelines described in: Single Sensor Multi-tenant Log Ingestion . Supported parsers are also described in this topic.

-
Raw Log Capture can be enabled if you want the sensor to store both raw and processed logs on the DP for built-in parsers. This can be useful in troubleshooting situations when you may want to compare a processed log to its corresponding raw log. Note that the feature only applies to built-in parsers. Custom parsers have their own settings within the parsers themselves.
You can search for raw logs by looking for the
parser_raw_msgfield in InterFlow records.Keep in mind that when this feature is enabled, built-in parsers store both raw and processed logs, requiring more storage resources on the DP.

Buffering
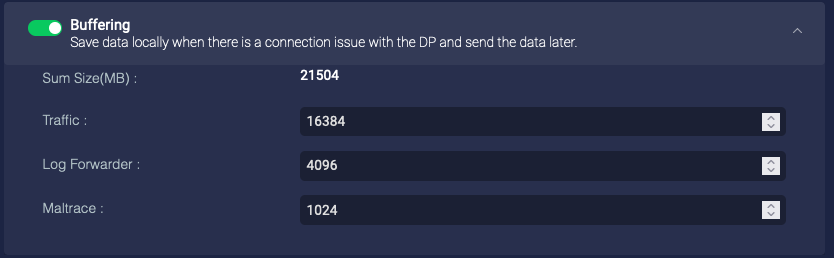
If you enable buffering, the sensor buffers the logs sent to Stellar Cyber. If the logs are received successfully, the sensor deletes the buffered logs. If the buffer is full, the sensor stops buffering logs. The following parameters allow you to configure that buffering:
-
Sum Size (MB)—The total of all Traffic, Log Forwarder, and Maltrace logs buffered
-
Traffic—The amount, in MB, of traffic logs buffered
-
Log Forwarder—The amount, in MB, of log forwarder logs buffered
-
Maltrace—The amount, in MB, of maltrace logs buffered
When you disable buffering, any data in the buffer is immediately deleted. Ensure that the sensor has had a stable connection to the DP for long enough to transmit all data in the buffer.
Agent Customizations
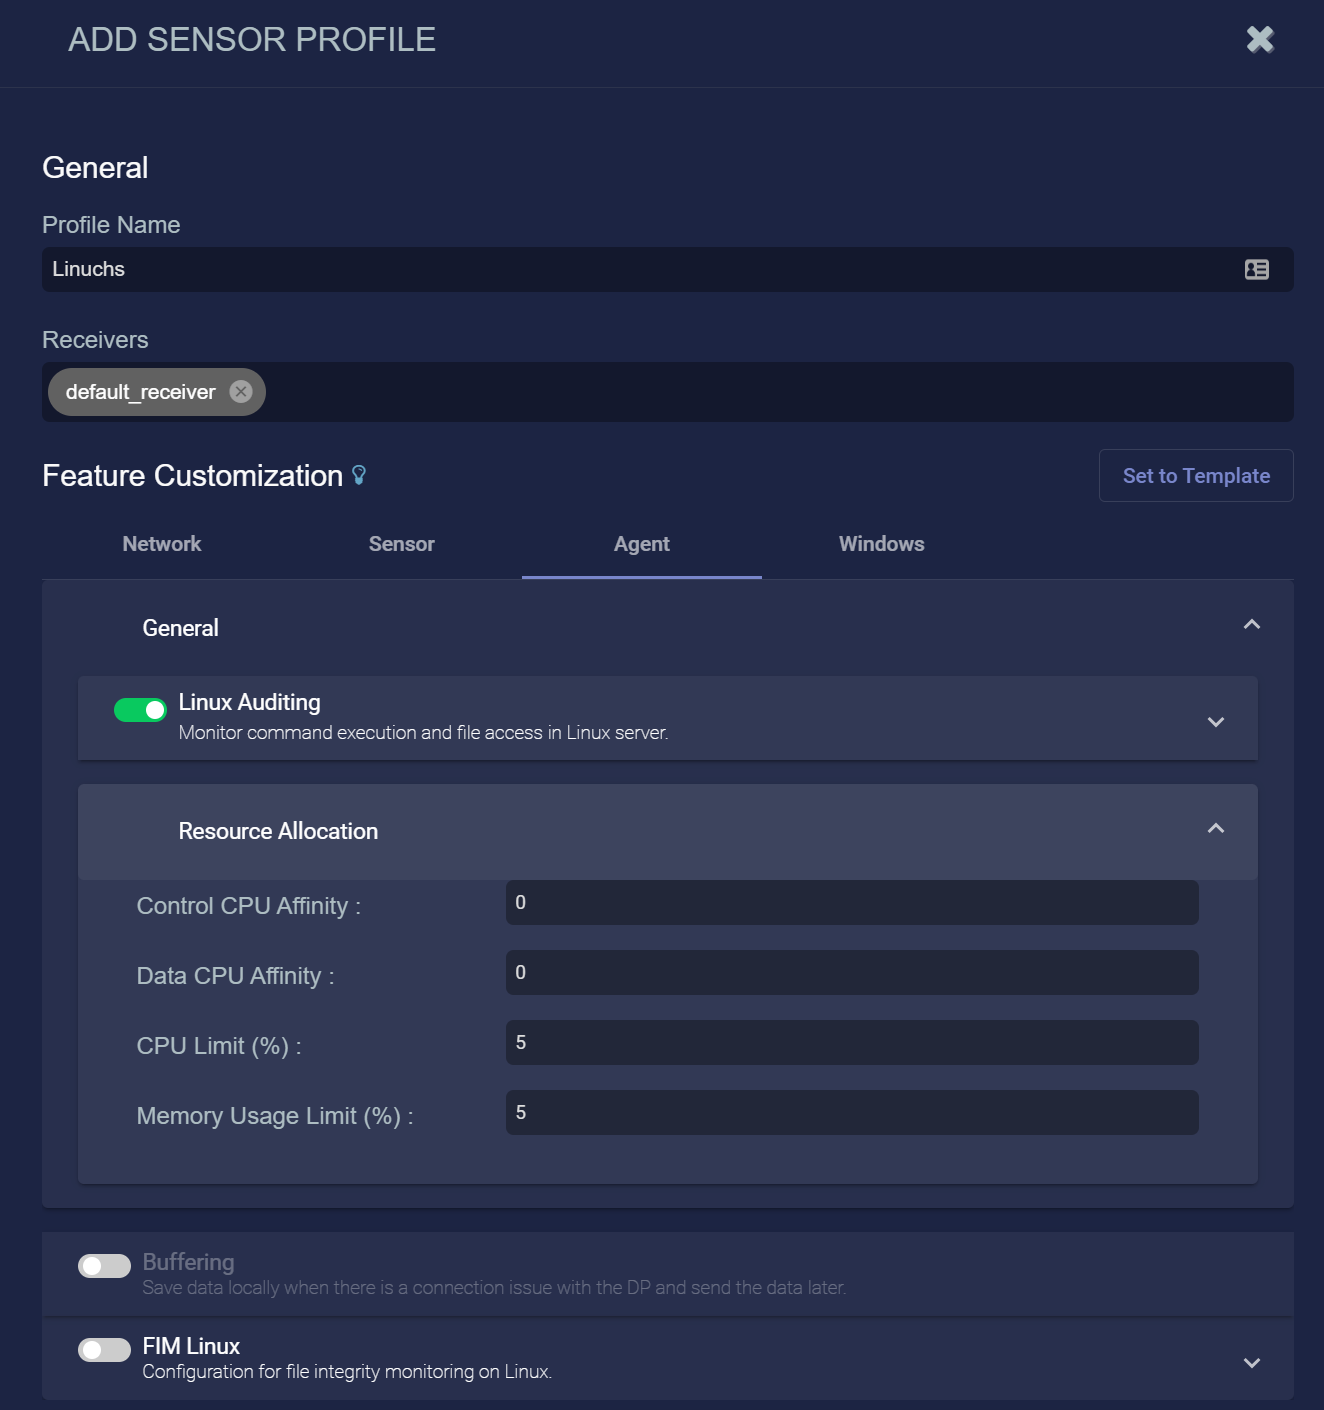
The settings in the Agent tab let you specify settings for Linux Server Sensors:
-
Linux Auditing—When selected the sensor checks its files for signs of alteration and monitors command executions.
This option is separate from the dedicated FIM Linux options for file integrity monitoring below.
-
Force Linux Auditd to Stop—Stellar Cyber uses the
aella_auditprocess to collect audit logs. Linux uses theauditdprocess. In most scenarios, the two processes coexist with each collecting data successfully. However, on older systems with pre-3.16 kernels, the processes can conflict, causingaella_auditto stop. Ifaella_auditis enabled, but you see no data on the DP, use this to stop theauditdprocess on older Linux systems.In some situations, the
auditdconfiguration may be locked by the Linux kernel (audit configuration is locked in the kernel (enabled=2)), preventing this option from working. In these situations, if you are running 4.3.7 sensor software, you must remove immutable flag (-e 2) from theauditdconfig, followed by a reboot of the host system.
-
-
Control CPU Affinity—Choose which CPU in a multi-core system the sensor uses for the control thread.
-
Data CPU Affinity—Choose which CPU in a multi-core system the sensor uses for the data processing thread.
-
CPU Limit (%)—Specify the amount of CPU per core that the sensor can use. To get the total for the sensor, multiply this percent by the number of cores. For example, if you set this at 5% and you have 8 cores, the sensor could use up to 40% of the CPU, as reported by the
topandhtoputility (distributed). If you have 32 cores, the sensor could use up to 160%. A total above 100% might seem impossible, but it’s the sum of the usage percent on all the cores, each of which can have a maximum limit up to 100%.Note that the
aella_flowprocess uses multiple threads. When using thetopor htop utility with thread-mode enabled (top Horhtop H), the output will show the percent that both theaella_flowprocess and its children threads use. At first, this might look like the CPU is processing twice as much as is configured because the individual threads add up to the same amount as their parent process and they’re all shown. To see the output displayed hierarchically so you can visually distinguish data for the parent process from data for its children threads, enable tree view mode (top Vorhtop F5).The commands to use:
-
In
top, press H to show threads and V to enable tree view. -
In
htop, press H to show threads and F5 to enable tree view.
By enabling the thread display along with tree view, you can clearly see which threads are associated with which parent processes, providing a detailed and organized view of CPU usage.
The Server Sensor uses a minimum of 300 MHz, even if the value specified for CPU Limit (%) results in a smaller value based on the host's CPUs. For example, if the Server Sensor is installed in a host with 2 CPUs running at 2.2 GHz and you specify a value of 5% for CPU Limit (%), the arithmetic of 5% * 2 CPUs * 2.2 GHz would indicate an assignment of 220 MHz for the Server Sensor. However, in a situation such as this, the Server Sensor uses its minimum assignment of 300 MHz, even though it is greater than the specified value.
-
-
Memory Usage Limit (%)—Specify the amount of memory the sensor can use.
-
Buffering—Enabling this allows you to set the size of the Traffic, Linux Event, and Windows Event buffers.
This option is deprecated and appears to provide backwards compatibility with legacy Server Sensors that have it enabled in their profiles. It can no longer be enabled. However, legacy profiles that still have this feature enabled can use this option to disable it.
-
FIM Linux–Enable this feature to monitor specified files and directories for changes, creations, and deletions. See the next section for details.
Configuring File Integrity Monitoring (FIM Linux) 
Enabling the FIM Linuxfeature in a Sensor Profile lets you keep track of changes to specified files and directories, including file changes, file creations, and file deletions.
When you enable the FIM Linuxfeature, a new table appears in the Sensor Profile dialog box that lets you specify both the files and directories you want to monitor for changes, as well as the types of changes for which you want to monitor. As you can see in the image below, the table is preconfigured with a set of paths recommended for monitoring.
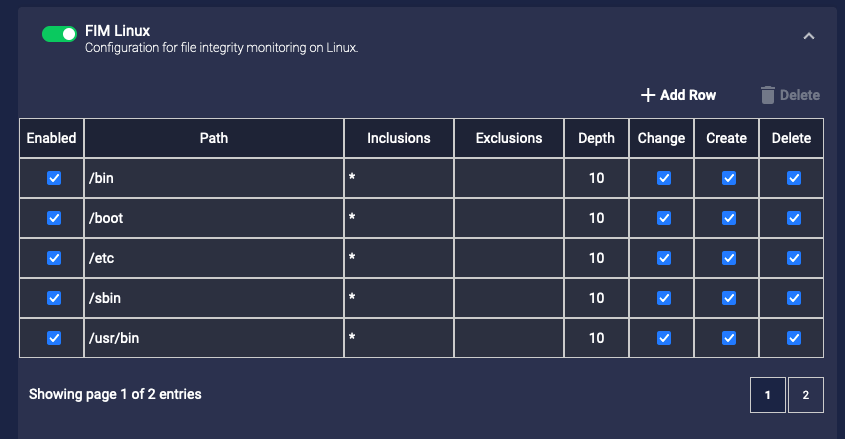
Click the + Add Row button to add new files/directories to the FIM feature. For each entry in the table, you can configure the following:
-
Enabled – Specifies whether the indicated files/directories are enabled for monitoring. This lets you toggle a given file/directory on or off for monitoring without needing to delete it from the profile entirely.
-
Path – Specifies the directory to monitor.
-
Inclusions – Specifies the files within the directory to monitor. You can use the asterisk (*) character for standard wildcarding. For example, *.sh. If you leave this field blank, it is implicitly set to *, meaning that all files in the specified path are included for monitoring.
-
Exclusions – Specifies the files within the directory to exclude from monitoring. You may want to use this feature to exclude certain file types that are trusted and change often. Standard wildcarding is supported here, too. By default, this field is set empty and no files are excluded from monitoring.
-
Depth – Specifies how many directories below the specified directory to monitor.
A depth of 0 means that you are monitoring only the specified directory and nothing below it.
-
Change/Create/Delete – Use these checkboxes to specify the types of changes to track in the specified path.
In general, it's a good idea to optimize performance by focusing your FIM settings on specific files rather than large directories with many files and subdirectories. Refer to Best Practices for File Integrity Monitoring (FIM) for performance guidelines and a set of system files recommended for integrity monitoring.
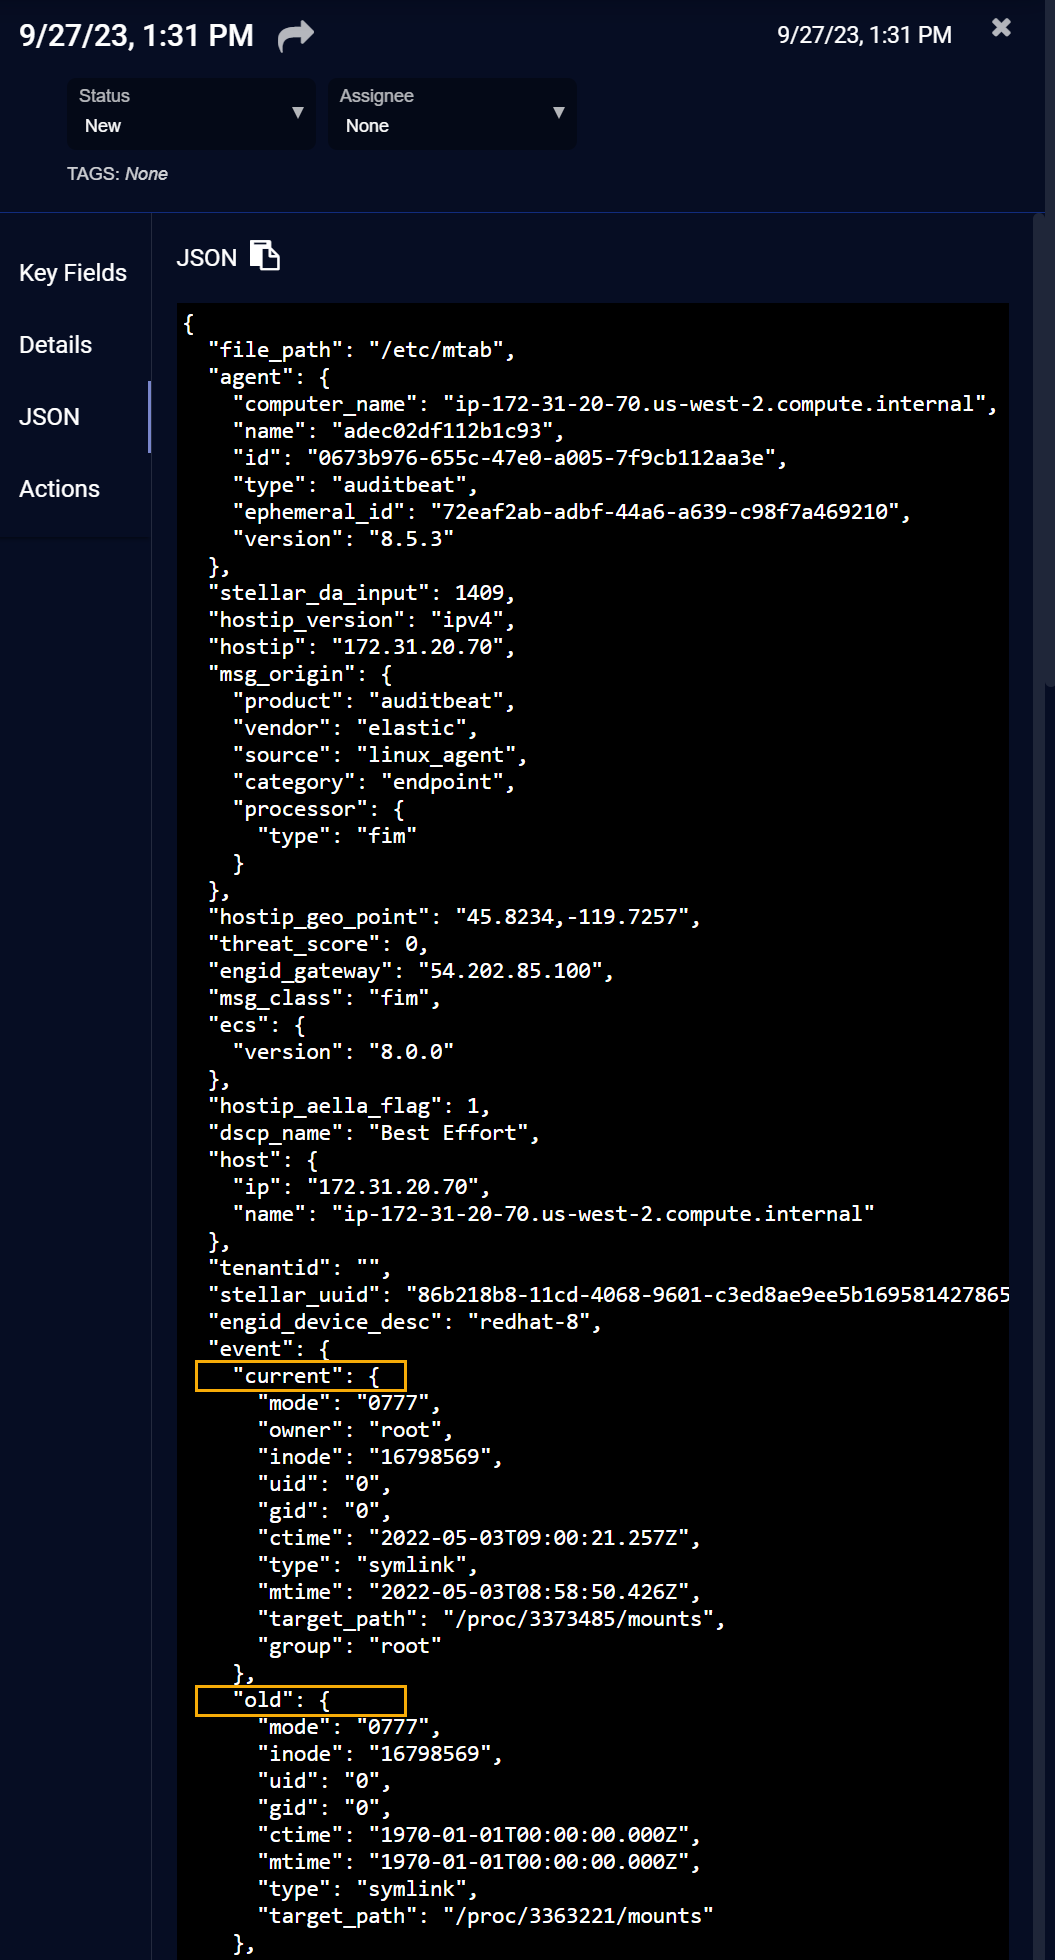
The FIM feature works by recording a file hash for all files configured for monitoring in the Sensor Profile. Once the initial hash is recorded, the FIM feature regularly monitors for changes to the file hash and sends events to the DP if changes are seen.
You can keep track of events generated by the FIM feature in the following ways:
-
Use the predefined Visualize | File Integrity Monitoring dashboard.
-
Use the Threat Hunting feature to search the Linux Events index for events with
msg_origin.sourceset tolinux_agentandmsg_origin.processor.typeset toFIM(oragent.typeset toauditbeat). Once you find such an event, you can add it to the Threat Hunting Documents table by using the Toggle add column to table button adjacent to its entry and sort to see all such events. -
Similarly, you can create ATH rules with queries based on the
msg_origin.processor.typefield set toFIM.
The JSON for a FIM event indicates the type of change that took place. If the event indicates either a change or a deletion, the JSON includes both old and current values. For example, the illustration below shows a change in a file's hash between the old and current sections, indicating that its contents changed. If the event indicates a file creation, only the current section appears in the JSON.
Linux Server Sensor Installation Directories Excluded from FIM
Note that the following installation directories for the Linux Server Sensor are automatically excluded from FIM monitoring. The user interface does not prevent you from adding these directories; however, they are still automatically excluded from FIM monitoring:
-
/var/aella/ -
/var/log/aella -
/opt/aella -
/opt/aelladata
Keep in mind that the FIM Linux feature can only monitor folders that exist when the aella_audit service restarts. If you add a non-existent folder for monitoring in the Sensor Profile and then create the folder later, it won't be monitored until aella_audit restarts.
Windows Customizations
You can configure Windows Server Sensors to collect specific logs. Logs are organized into different predefined channels in the Windows tab, each with its own maximum log size. You can toggle collection of the available logs and event types in each of the different individual channels, or opt for the simple route and use one of the predefined templates for Windows Server Sensors provided by Stellar Cyber. You can also apply filters configured in the System | Collection | Log Filters page as Event Filters, excluding or including matching events.
Start with a Windows Server Sensor Template!
Stellar Cyber recommends that you start configuration of a Windows Server Sensor's profile by using one of the predefined templates included with the system. These templates have been carefully configured to match common deployment scenarios. Once you have reviewed the settings in a template and seen how it operates in your environment, you can tailor the settings in individual channels to fit your needs.
The following templates are available for options in the Windows tab:
-
Windows Detect Profile (Low Volume). The selection covers the minimal events required for native detections in Stellar Cyber.
-
Windows Context Profile (Medium Volume). Adds events commonly used by third-party detection rules.
-
Windows Compliance Profile (High Volume). Covers all Windows events.
Each of these profiles collects a different set of logs/events and results in a progressively higher volume of data from Low to Medium to High.
|
Channel |
|
|
Notes |
Windows Detect Profile |
Windows Context Profile |
Windows Compliance Profile |
|---|---|---|---|---|---|---|
|
Security Collect Windows advanced security audit policy settings events.
|
|
|
|
|||
| Account Logon Events
|
|
|
||||
|
Credential Validation |
For UEBA alerts. |
|||||
|
Kerberos Authentication Service |
For UEBA alerts |
|||||
|
Kerberos Service Ticket Operations |
|
|||||
|
Other Account Logon Events |
|
|||||
| Account Management Events
|
|
|
||||
|
Application Group Management |
|
|
|
|||
|
Computer Account Management |
|
|
|
|||
|
Distribution Group Management |
|
|
|
|||
|
Security Group Management |
|
|
|
|||
|
User Account Management |
|
|
|
|||
|
Other Account Management Events |
|
|
|
|||
| Detailed Tracking Events
|
|
|
|
|
|
|
|
DPAPI Activity |
|
|
|
|||
|
PNP Activity |
|
|
|
|||
|
Process Creation |
For alerts related to process creation anomalies. |
|
|
|||
|
Process Termination |
|
|
|
|||
|
RPC Events |
|
|
|
|||
|
Token Right Adjustment Events |
|
|
|
|||
| DS Access Events
|
|
|
|
|
|
|
|
Detailed Directory Service Replication |
|
|
|
|||
|
Directory Service Access |
|
|
|
|||
|
Directory Service Changes |
|
|||||
|
Directory Service Replication |
|
|
|
|||
| Logon/Logoff Events
|
|
|
|
|
|
|
|
Account Lockout |
|
|
|
|||
|
User/Device Claims |
|
|
|
|||
|
Group Membership |
|
|
|
|||
|
IPsec Extended Mode |
|
|
|
|||
|
IPsec Main Mode |
|
|
|
|||
|
IPSec Quick Mode |
|
|
|
|||
|
Logoff |
|
|
|
|||
|
Logon |
For UEBA alerts |
|
|
|||
|
Network Policy Server |
|
|
|
|||
|
Special Logon |
|
|
|
|||
|
Other Logon/Logoff Events |
|
|
|
|||
| Object Access Events
|
|
|
|
|
|
|
|
Application Generated |
|
|
|
|||
|
Certification Services |
|
|
|
|||
|
Detailed File Share |
|
|
|
|||
|
File Share |
|
|
|
|||
|
File System |
|
|
|
|||
|
Filtering Platform Connection |
|
|
|
|||
|
Filtering Platform Packet Drop |
|
|
|
|||
|
Handle Manipulation |
|
|
|
|||
|
Kernel Object |
|
|
|
|||
|
Registry |
|
|
|
|||
|
Removable Storage |
|
|
|
|||
|
SAM |
|
|
|
|||
|
Central Access Policy Staging |
|
|
|
|||
|
Other Object Access Events |
|
|
|
|||
| Policy Change Events
|
|
|
|
|
|
|
|
Audit Policy Change |
|
|
|
|||
|
Authentication Policy Change |
|
|
|
|||
|
Authorization Policy Change |
|
|
|
|||
|
Filtering Platform Policy Change |
|
|
|
|||
|
MPSSVC Rule-Level Policy Change |
|
|
|
|||
|
Other Policy Change Events |
|
|
|
|||
| Privilege Use Events
|
|
|
|
|
|
|
|
Non-Sensitive Privilege Use |
|
|
|
|||
|
Sensitive Privilege Use |
|
|
|
|||
|
Other Privilege Use Events |
|
|
|
|||
| System Events
|
|
|
|
|
|
|
|
IPsec Driver |
|
|
|
|||
|
Security State Change |
|
|
|
|||
|
Security System Extension |
|
|
|
|||
|
System Integrity |
|
|
|
|||
|
Log Clear |
|
|
|
|||
|
Other System Events |
|
|
|
|||
|
Specify Event IDs |
|
Include Only:
|
Include Only:
|
|
||
|
System Collect Windows system events. |
|
|
|
|
|
|
|
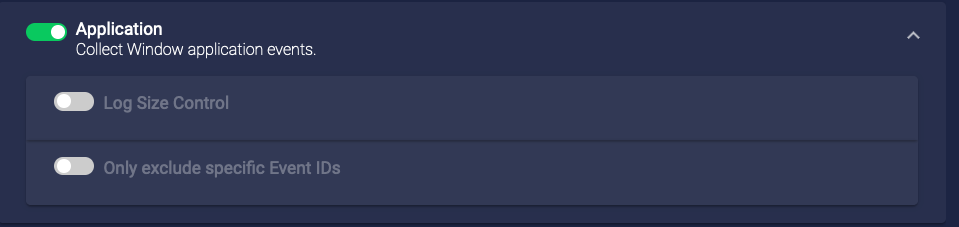
Application Collext Windows aplication events. |
|
|
|
|
|
|
|
Forwarded Events Collect Windows events forwarded fro other Windows machines. |
|
|
|
|
|
|
|
Microsoft Windows DHCP Client Collect Windows DHCP client events |
|
|
|
|
|
|
|
Microsoft Windows Firewall with Advanced Security Firewall Collect Windows advanced security firewall events. |
|
|
|
|
|
|
|
Microsoft Windows Defender Collect Windows Defender events.
|
|
|
|
|
|
|
| Specify Event IDs |
|
|
Include Only:
|
Include Only:
|
|
|
|
Microsoft Windows Sysmon Collect Windows sysmon events for process anomaly detections.
|
|
|
|
|
|
|
|
Specify Event IDs |
|
|
Include Only:
|
Include Only:
|
|
|
|
Microsoft Windows PowerShell Operational Collect Windows PowerShell operational logs.
|
|
|
|
|
|
|
|
Specify Event IDs |
|
|
Include Only:
|
Include Only:
|
|
|
|
FIM Configure and enable file integrity monitoring. |
Not enabled by default in any template. |
|
|
|
|
|
How to Apply a Windows Server Sensor Template
You apply a profile for settings in the Windows tab as follows:
-
Navigate to System | Sensor Profiles, click the Create button, and select the Add Standard Sensor Profile option.
-
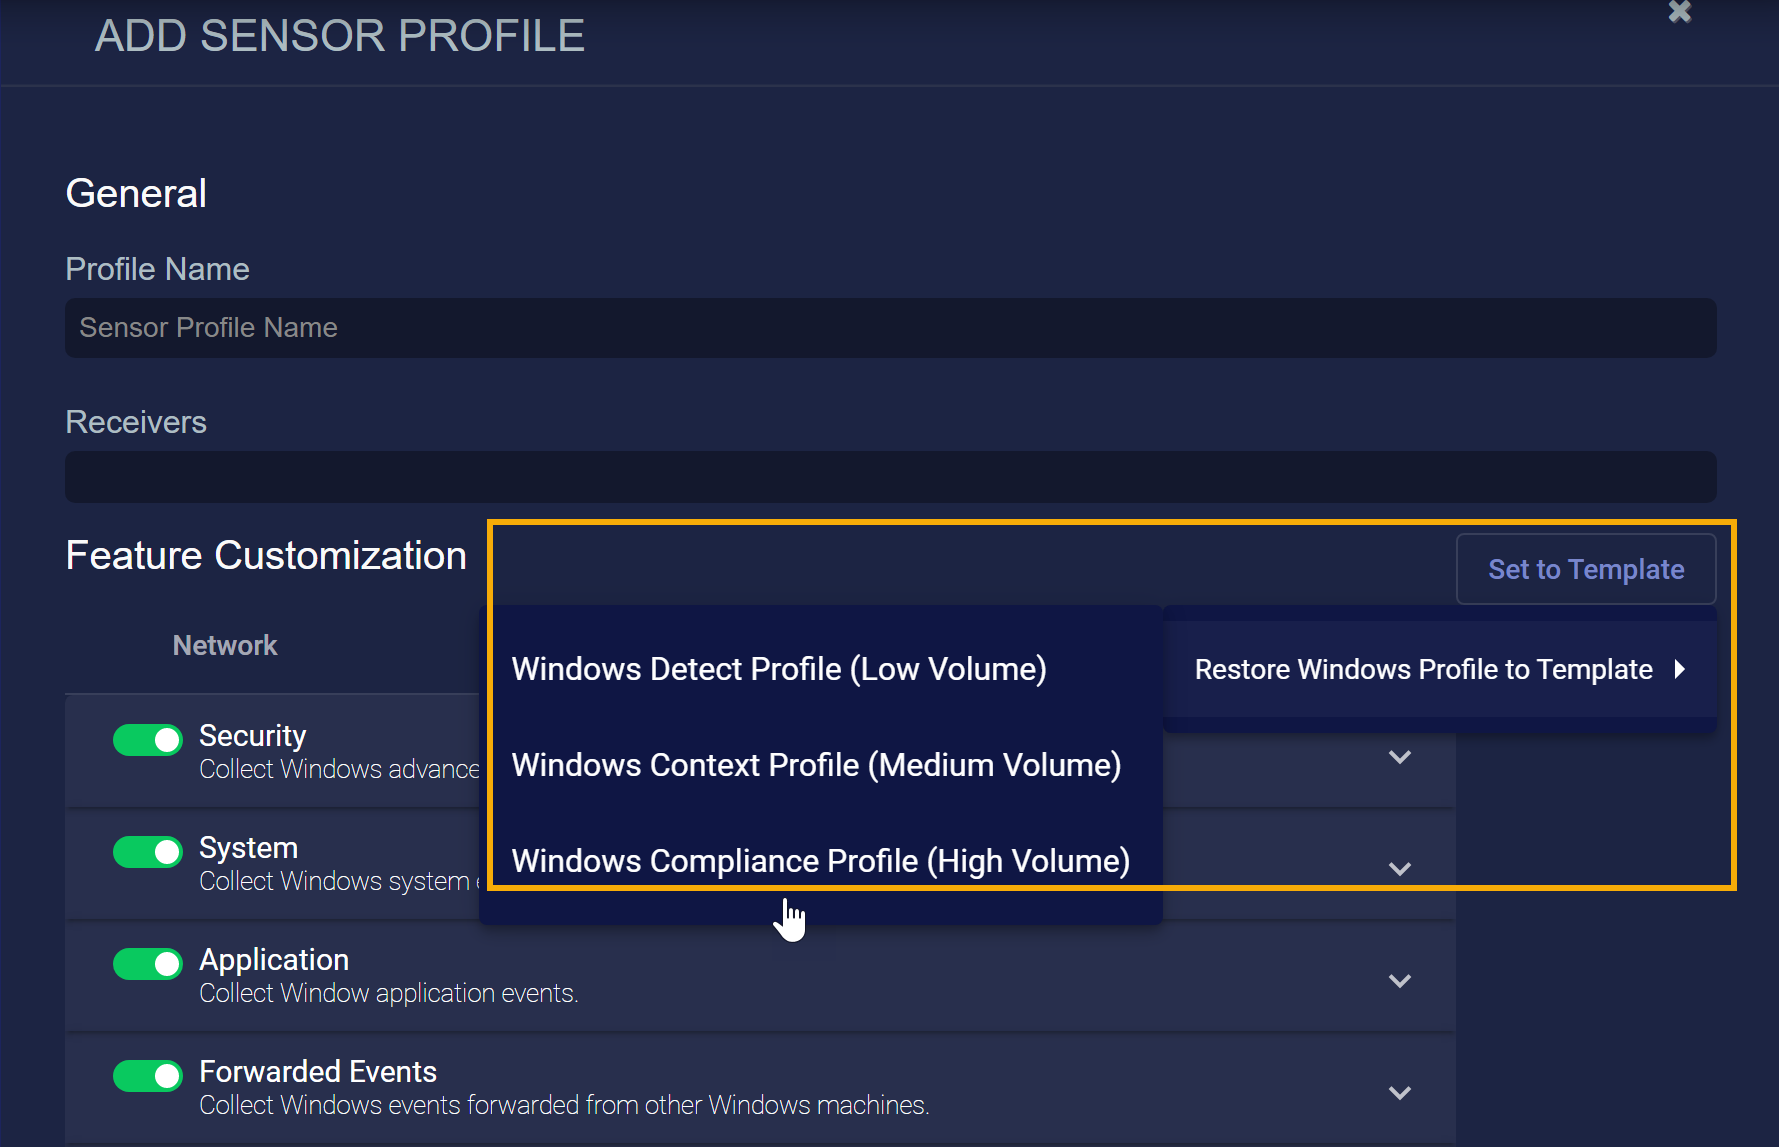
Click the Set to Template button and use the context menu that appears to select one of the available Windows Server Sensor profiles from the Restore Windows Profile to Template menu, as illustrated below:
Note the following:
-
The Set to Template button is available regardless of which tab is displayed in the Add/Edit Sensor Profile window.
-
The only templates available in this release are for the options in the Windows tab and are organized under Set to Template | Restore Windows Profile to Template.
-
When you select one of the templates in the Restore Windows Profile to Template menu, all options in the Windows tab are reset according to the selected template. All other profile options are left unchanged. For example, if you have made customizations to the options in the Network tab, those options remain at their current settings after applying a Windows template to reset the options in the Windows tab.
-
You can reset the options in the Windows tab using a template as often as you like, keeping in mind that all the options in the tab are reset to match the template each time you do so. You can also start with a template and then tweak individual settings as you see fit.
-
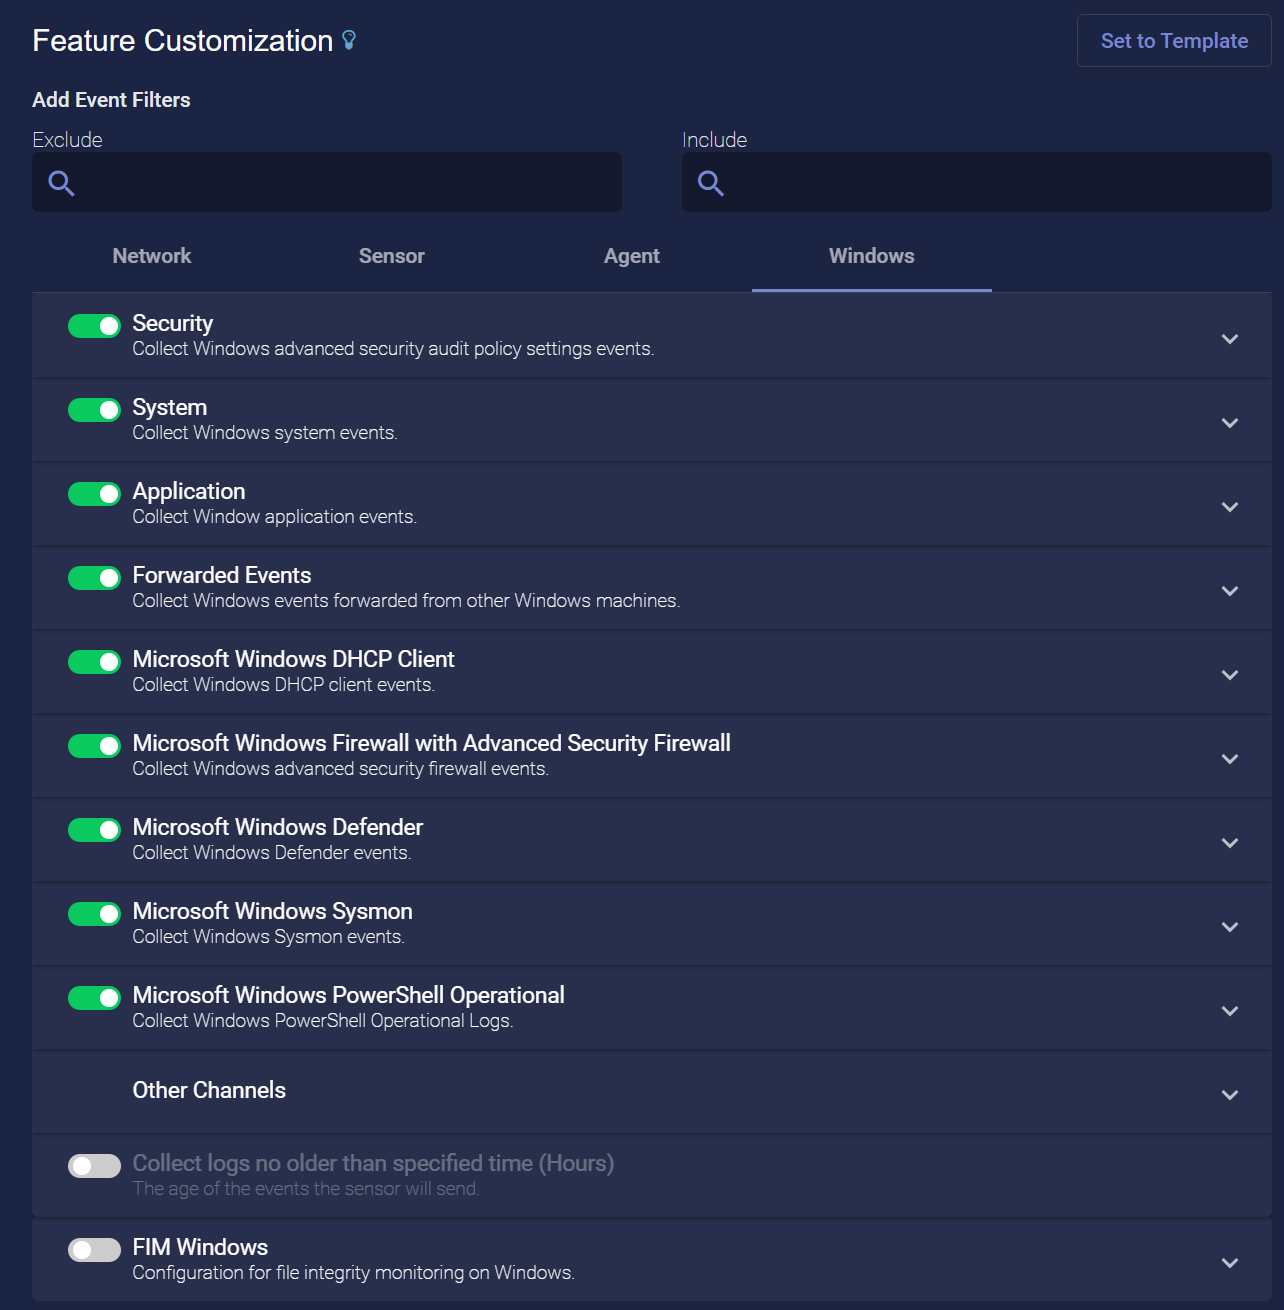
Applying Event Filters
You can use the Add Event Filters fields to Exclude or Include events matching the listed filters, giving you fine-grained control on which events are processed. You can apply any of the filters configured in the System | Collection | Log Filters page as Event Filters; when you click in the panels, a list of the available filters appears. Check the boxes of any filters you want to apply as Exclude or Include filters.
Keep in mind the following notes when using filters configured in the System | Collection | Log Filters page as Event Filters for a Windows Sensor Profile.:
-
Event Filters apply to events in all of the other channels, except FIM (Security, System, Application, Forwarded Events, Microsoft Windows DHCP Client, Microsoft Windows Firewall with Advanced Security Firewall, Microsoft Windows Defender, Microsoft Windows Sysmon, Microsoft Windows PowerShell Operational, and Other Channels).
-
Event Filters are joined with the Specify Event IDs entries in the other channels using a logical
AND. This means that a given event must match both the Event Filters and the Specify Event IDs entries to pass the filter.For example, consider the following configuration:
-
Event Filter is set to
Exclude field process-id=100 -
Specify Event IDs is set to
Include ID 1
In this situation the overall filter will ingest logs with an
ID of 1that do not havefield process-id=100. -
-
Exclude filters are always applied before Include filters, in the order they are specified.
-
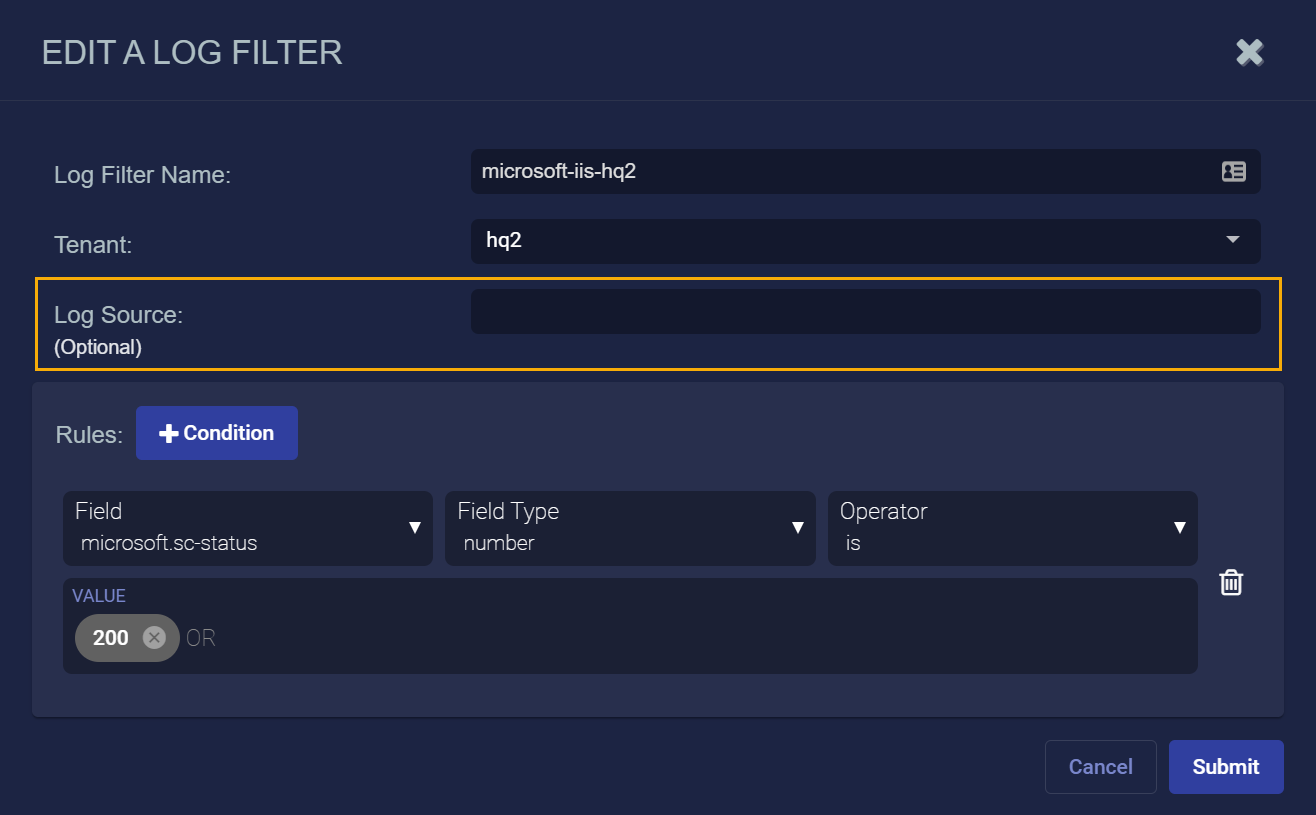
Only use Log Filters configured without the optional Log Source specified, as demonstrated in the figure below. Log Filters with a Log Source configured won't match any event logs on the Windows Server Sensor when used as Event Filters.

Refer to Managing Log Filters for detailed instructions on configuring Log Filters.
-
You can apply a maximum of 100 Event Filters each in the Exclude and Include panels.
-
The Windows Server Sensor templates do not set any Event Filters.
Keeping Tabs on Log Filter Statistics
You can keep tabs on statistics related to log filters using the show logfilter and show logfilter < filter-id> commands in the sensor CLI. The show logfilter-id command shows the details of the last matching event during filtering and can be useful when evaluating filter performance.
In addition, log filter statistics are sent to the Sensor Monitoring index (aella-ade-*) on the DP using msgtype:41 and can be viewed in the Threat Hunting page with Indices set to Sensor Monitoring. See below for the schema.
{
    "msgtype": 41,
    "msg_origin": {
        "processor": {
            "type": "log_forwarder", "winlog", "fim", "log_collector", or, "aella_flow"
            "name": # Optional. It is <connector_name> when type is "connector".
            "id": # Optional. NG-SaaS, connector has id.
        }
    }
    "engid": # For connector running on DP, it is <connector type>_<connector name>
    "engid_name": # For connector running on DP, it is <connector type>_<connector name>
    "tenantid":
    "filter_id":
    "filter_name":
    "timestamp": # epoch ms
    "exclude_hits_delta": # Optional. The number of exclude hits of the filter by the processor since last report
    "exclude_bytes_delta": # Optional. The size of excluded logs matched the filter by the processor since last report
    "include_hits_delta": # Optional. The number of include hits of the filter by the processor since last report
    "include_bytes_delta": # Optional. The size of included logs matched the filter by the processor since last report
    "last_log": # Optional. The string of the latest log which was matched the filter
}
About the Predefined Channels in the Windows Tab
The predefined channels allow you to collect events in the following categories:
-
Security
-
System
-
Application
-
Forwarded Events
-
Microsoft Windows DHCP Client
-
Microsoft Windows Firewall with Advanced Security Firewall
-
Microsoft Windows Defender
-
Microsoft Windows Sysmon
-
Microsoft Windows PowerShell
-
FIM (File Integrity Monitoring)
All of the channels are enabled by default
Including or Excluding Specific Event IDs 
Each of the preset channels in the Windows tab includes a Specify Event IDs option that lets you either Exclude or Include specific Event IDs. Use the following procedure:
-
Navigate to the channel from which you want to include or exclude specific Event IDs and cascade its entry open.
-
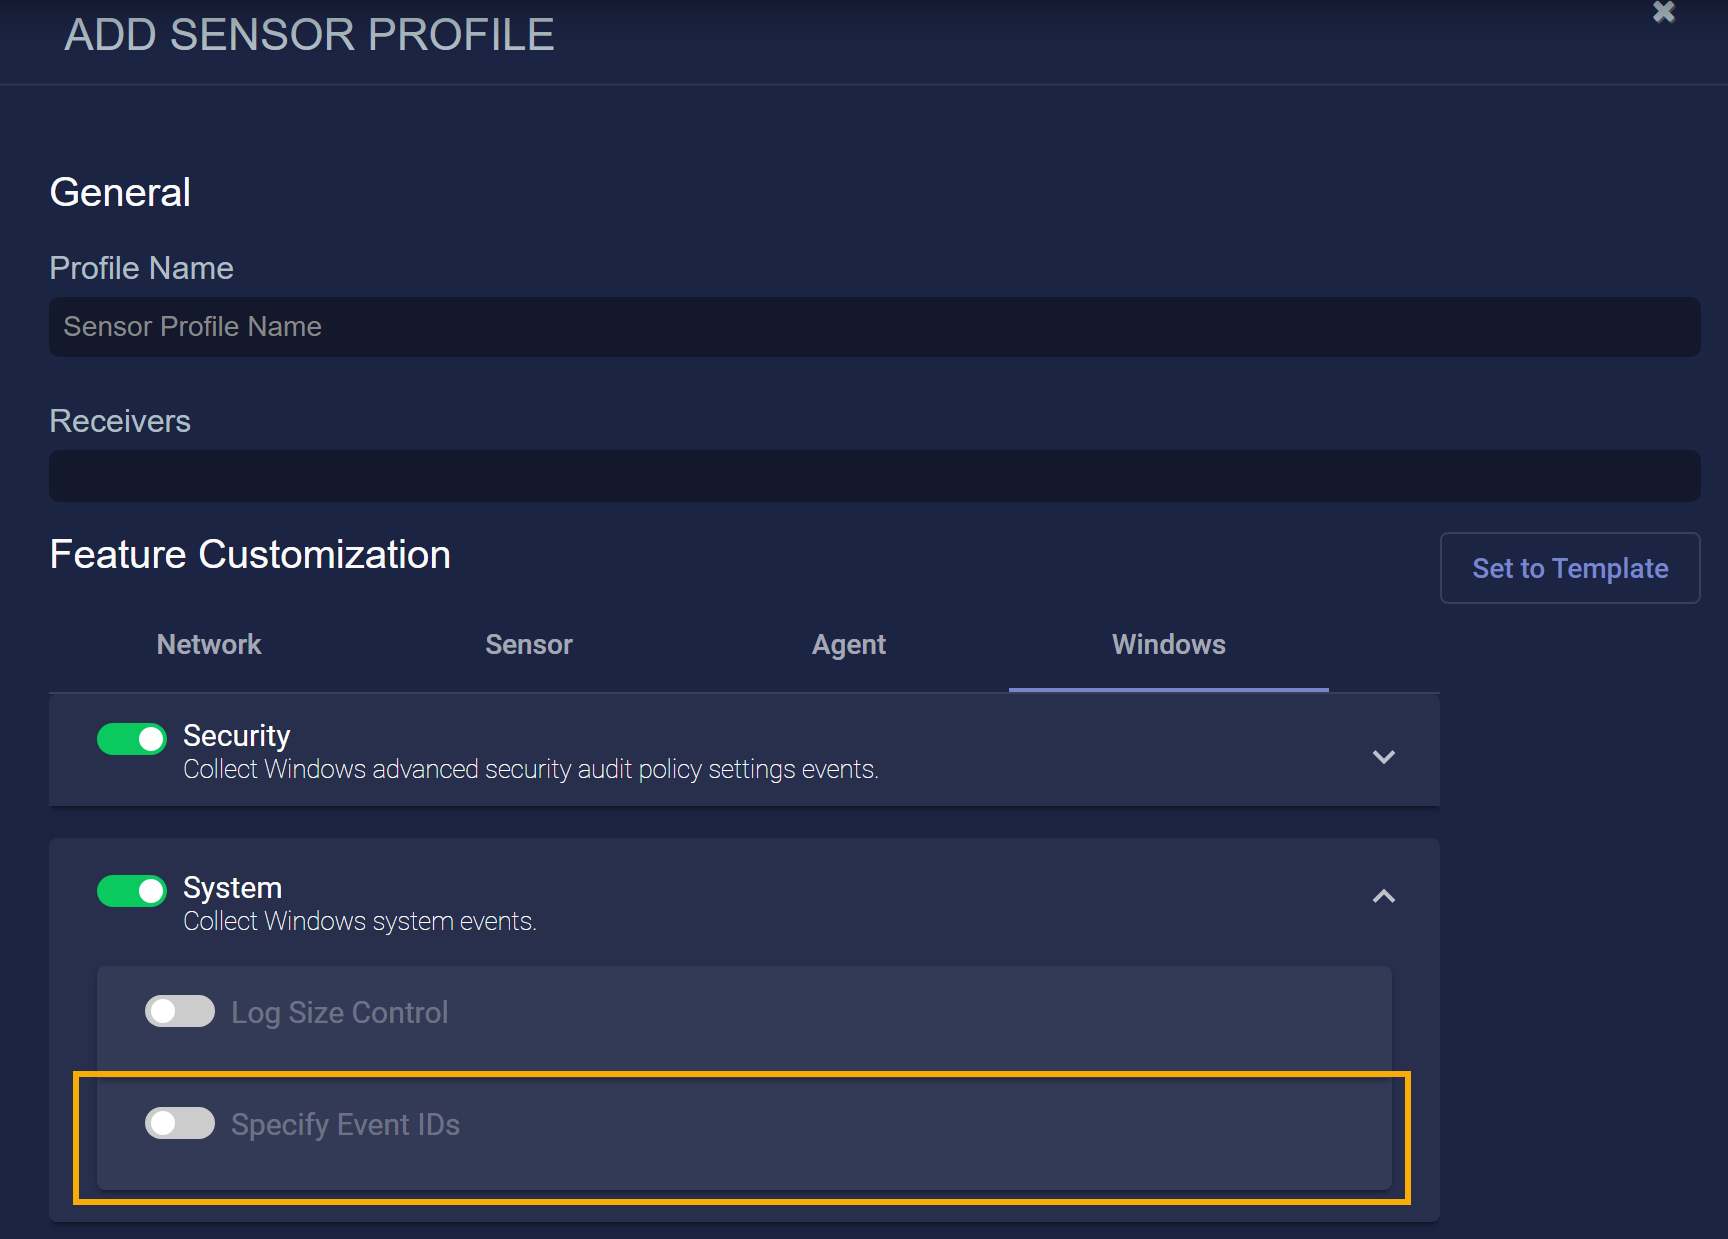
Scroll to the bottom of the channel's available options until you locate its Specify Event IDs entry. For example, the illustration below shows the Specify Event IDs entry for the System channel.
Some of the channels have the Specify Event IDs option enabled automatically with IDs supplied for you if you have selected one of the available templates for the Windows tab options. Refer to Templates for Windows Server Sensors for a list of the options and Event IDs included in each of the available profiles.
-
Toggle the Specify Event IDs option on and choose whether you want to Exclude or Include specific IDs.
-
Supply the IDs you want to Exclude or Include by typing them into the Event IDs field, as illustrated below.

Note that the IDs you enter here are not validated. You can use the Event table in the Threat Hunting display (enable the column for Event IDs) to identify noisy/low value IDs, or refer to external resources, such as https://docs.microsoft.com/en-us/windows/security/threat-protection/windows-defender-application-control/event-id-explanations .
-
Click Submit when you are finished with all settings for the Sensor Profile.

Configuring the Log Size for a Channel
To configure the log size for a channel:
-
Click on the name of the channel for which you want to customize log size.

-
Click on the Log Size Control toggle to enable it and to display size information.
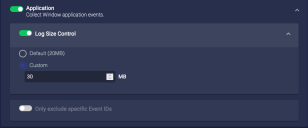
-
Click Custom to enable a custom log size.
-
Enter the custom size.
-
Click Submit after you finish all configurations.

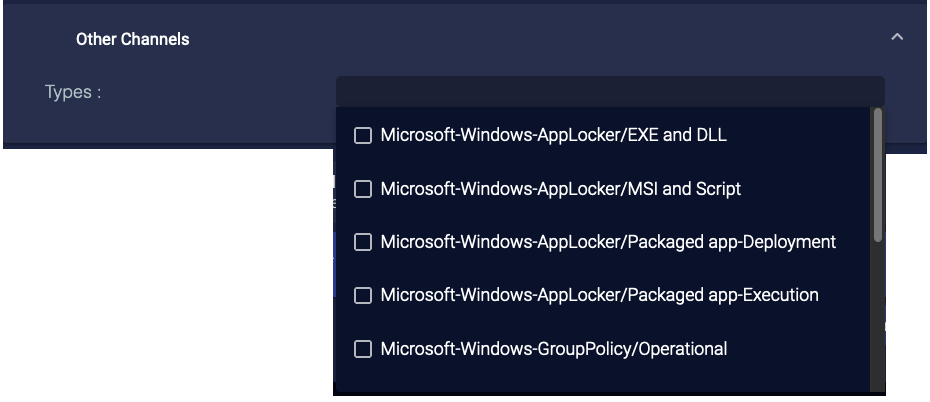
Adding Other Channels
To add other channels:
-
Click Other Channels. The section expands.
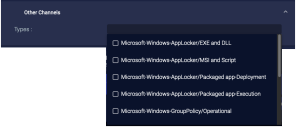
You can either select from the available preset channels or type in your own.
-
To select from the preset channels, you choose one or more channels from the Types drop-down and click Add. The channel appears in the Added box.

The available preset channels are extensive and are best reviewed in the user interface. In addition to many others, they include the following:
-
Microsoft-Windows-AppLocker/EXE and DLL
-
Microsoft-Windows-AppLocker/MSI and Script
-
Microsoft-Windows-AppLocker/Packaged app-Deployment
-
Microsoft-Windows-AppLocker/Packaged app-Execution
-
Microsoft-Windows-DNS-Server/Analytical

-
Microsoft-Windows-GroupPolicy/Operational
-
Microsoft-Windows-Kernel-Boot/Operational
-
Microsoft-Windows-NetworkProvider/Operational
-
Microsoft-Windows-PowerShell/Admin
-
Microsoft-Windows-TCPIP/Operational
-
OpenSSH/Admin
-
OpenSSH/Operational
-
Windows Networking VPN Plugin Platform/Operational
-
-
You can also type in your own Windows event channel. The user interface checks to make sure the channel exists and reports an error message if it does not.
-
Click Submit after you finish all settings for the profile.

Limiting the Age of Collected Logs
To limit the age of the logs collected when you first enable:
-
Click Collect logs no older than specified time (Hours). The section expands.
-
Enter the number of hours.
-
Click Submit after you finish all settings for the profile.
Configuring File Integrity Monitoring (FIM Windows)
Enabling the FIM Windowsfeature in a Sensor Profile lets you keep track of changes to specified files and directories, including file changes, file creations, and file deletions.
When you enable the FIM Windows feature, a new table appears in the Sensor Profile dialog box that lets you specify both the files and directories you want to monitor for changes, as well as the types of changes for which you want to monitor.
As you can see in the image below, the table is preconfigured with a set of files and directories recommended for monitoring by industry-standard best practices.
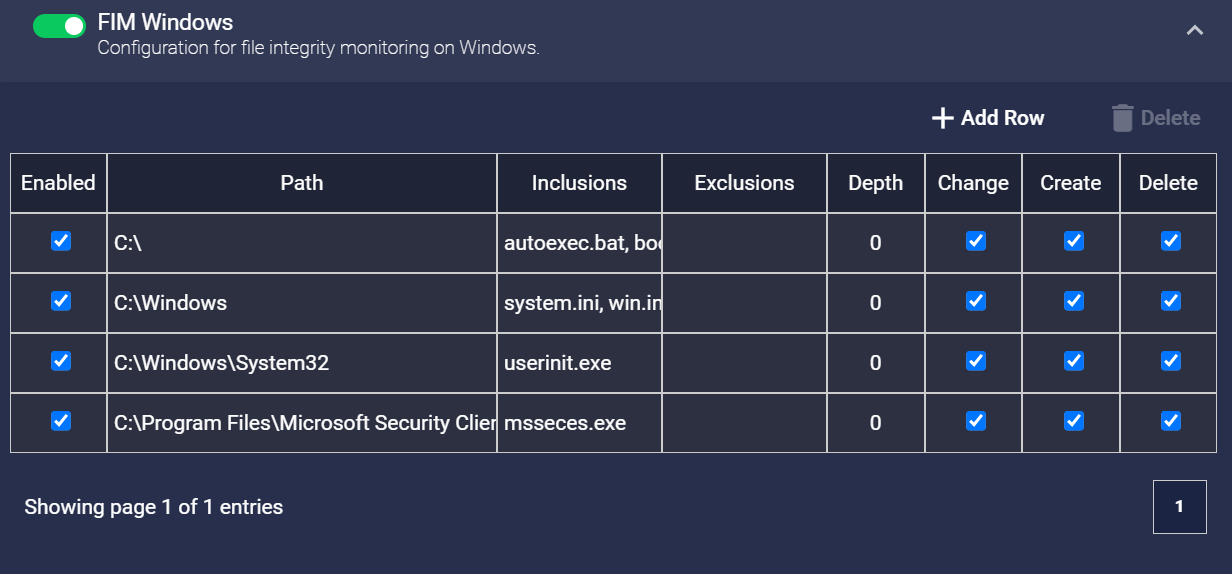
Click the + Add Row button to add new files/directories to the FIM feature. For each entry in the table, you can configure the following:
-
Enabled – Specifies whether the indicated files/directories are enabled for monitoring. This lets you toggle a given file/directory on or off for monitoring without needing to delete it from the profile entirely.
-
Path – Specifies the directory to monitor.
A given path can only have one entry in the table. In addition, keep in mind that Windows paths are case-insensitive. Because of this, Stellar Cyber prevents you from adding, for example, both C:\Program Files and C:\program files. Because paths are not case-sensitive, these two paths are treated as the same by Stellar Cyber.
-
Inclusions – Specifies the files within the directory to monitor. You can use the asterisk (*) character for standard wildcarding. For example, *.bat, *.cfg, and so on. If you leave this field blank, it is implicitly set to *, meaning that all files in the specified path are included for monitoring.
-
Exclusions – Specifies the files within the directory to exclude from monitoring. You may want to use this feature to exclude certain file types that are trusted and change often. Standard wildcarding is supported here, too. By default, this field is set empty and no files are excluded from monitoring.
-
Depth – Specifies how many directories below the specified directory to monitor.
A depth of 0 means that you are monitoring only the specified directory and nothing below it.
-
Change/Create/Delete – Use these checkboxes to specify the types of changes to track in the specified path.
In general, it's a good idea to optimize performance by focusing your FIM settings on specific files rather than large directories with many files and subdirectories (C:\, for example). Refer to Best Practices for File Integrity Monitoring (FIM) for performance guidelines and a set of system files recommended for integrity monitoring by Microsoft.
The FIM feature works by recording a file hash for all files configured for monitoring in the Sensor Profile. Once the initial hash is recorded, the FIM feature regularly monitors for changes to the file hash and sends events to the DP if changes are seen.
You can keep track of events generated by the FIM Windows feature in the following ways:
-
Use the predefined Visualize | File Integrity Monitoring dashboard.
-
Use the Threat Hunting feature to search the Windows Events index for events with
msg_origin.sourceset towindows_agentandmsg_origin.processor.typeset toFIM. Once you find such an event, you can add it to the Threat Hunting Documents table by using the Toggle add column to table button adjacent to its entry and sort to see all such events. -
Similarly, you can create ATH rules with queries based on the
msg_origin.processor.typefield set toFIM.
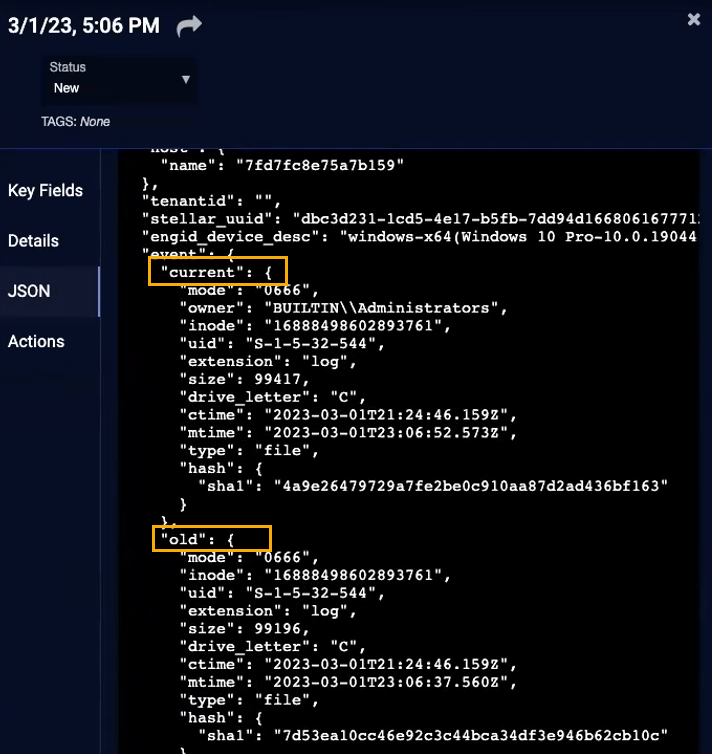
The JSON for a FIM event indicates the type of change that took place. If the event indicates either a change or a deletion, the JSON includes both old and current values. For example, the illustration below shows a change in a file's hash between the old and current sections, indicating that its contents changed. If the event indicates a file creation, only the current section appears in the JSON.
Note that when the FIM Windows feature is enabled on a Windows Server Sensor, a new windows agent sensor fim process is spawned on the host machine and can be viewed with other running processes.
Windows Server Sensor Installation Directories Excluded from FIM
Note that the following installation directories for the Windows Server Sensor are automatically excluded from FIM monitoring. The user interface does not prevent you from adding these directories; however, they are still automatically excluded from FIM monitoring:
-
C:\ProgramData\StellarCyber\Windows Agent Sensor\config -
C:\ProgramData\StellarCyber\Windows Agent Sensor\log -
C:\ProgramData\StellarCyber\Windows Agent Sensor\run
Memory Usage and Windows Server Sensor Profiles
When applying a sensor profile to a Windows Server Sensor, the system compares the amount of memory required by the profile to the amount of memory available on the target system and reports success or failure in the Sensors list as follows:
-
Systems with ≥ 100 GB Total Memory: Profile is applied successfully if the amount of free memory on the target system minus the memory required by the profile is ≥ 25 GB. If less, the failure is reported in the Sensors list.
-
Systems with < 100 GB Total Memory: Profile is applied successfully if the amount of free memory on the target system minus the memory required by the profile is ≥ 25% of the total memory. If less, the failure is reported in the Sensors list.
If you receive a memory warning in the Sensors list, you can either reduce the memory footprint of the sensor profile (for example, by reducing the size of the Log Size Control options) or provision additional memory for the Windows Server Sensor host.
