Threat Hunting
Use this screen to examine network events of interest with an emphasis on security anomalies. There are 4 tabs:
-
Interflow Search: The default tab, an overview of all events. From here, you can use the following query tools:
-
Main Search Field: Use keywords to search the data lake
-
Visual Dictionary: Select keywords from a list, then filter values from chart legends
-
Table Search Field: Use keywords to search within the displayed results
-
-
Correlation Search: Visualize alert type correlations
-
ZOOM: Do a deep analysis of relationships
-
Threat Hunting Library: Use an alert type to narrow your hunt
Each of these tabs is described in a following section.
As with other Stellar Cyber pages that display event information, the data shown is subject to the filter controls at the top of the screen. See the Queries page for more details.
Interflow Search
The Investigate | Threat Hunting interface uses the Interflow Search tab as its default display, as shown in the figure below.
All results in this screen are additionally filtered according to the parameters at the top of the screen, such as Time Interval. If you select multiple indices, the interval may be automatically adjusted to a smaller duration for efficiency.
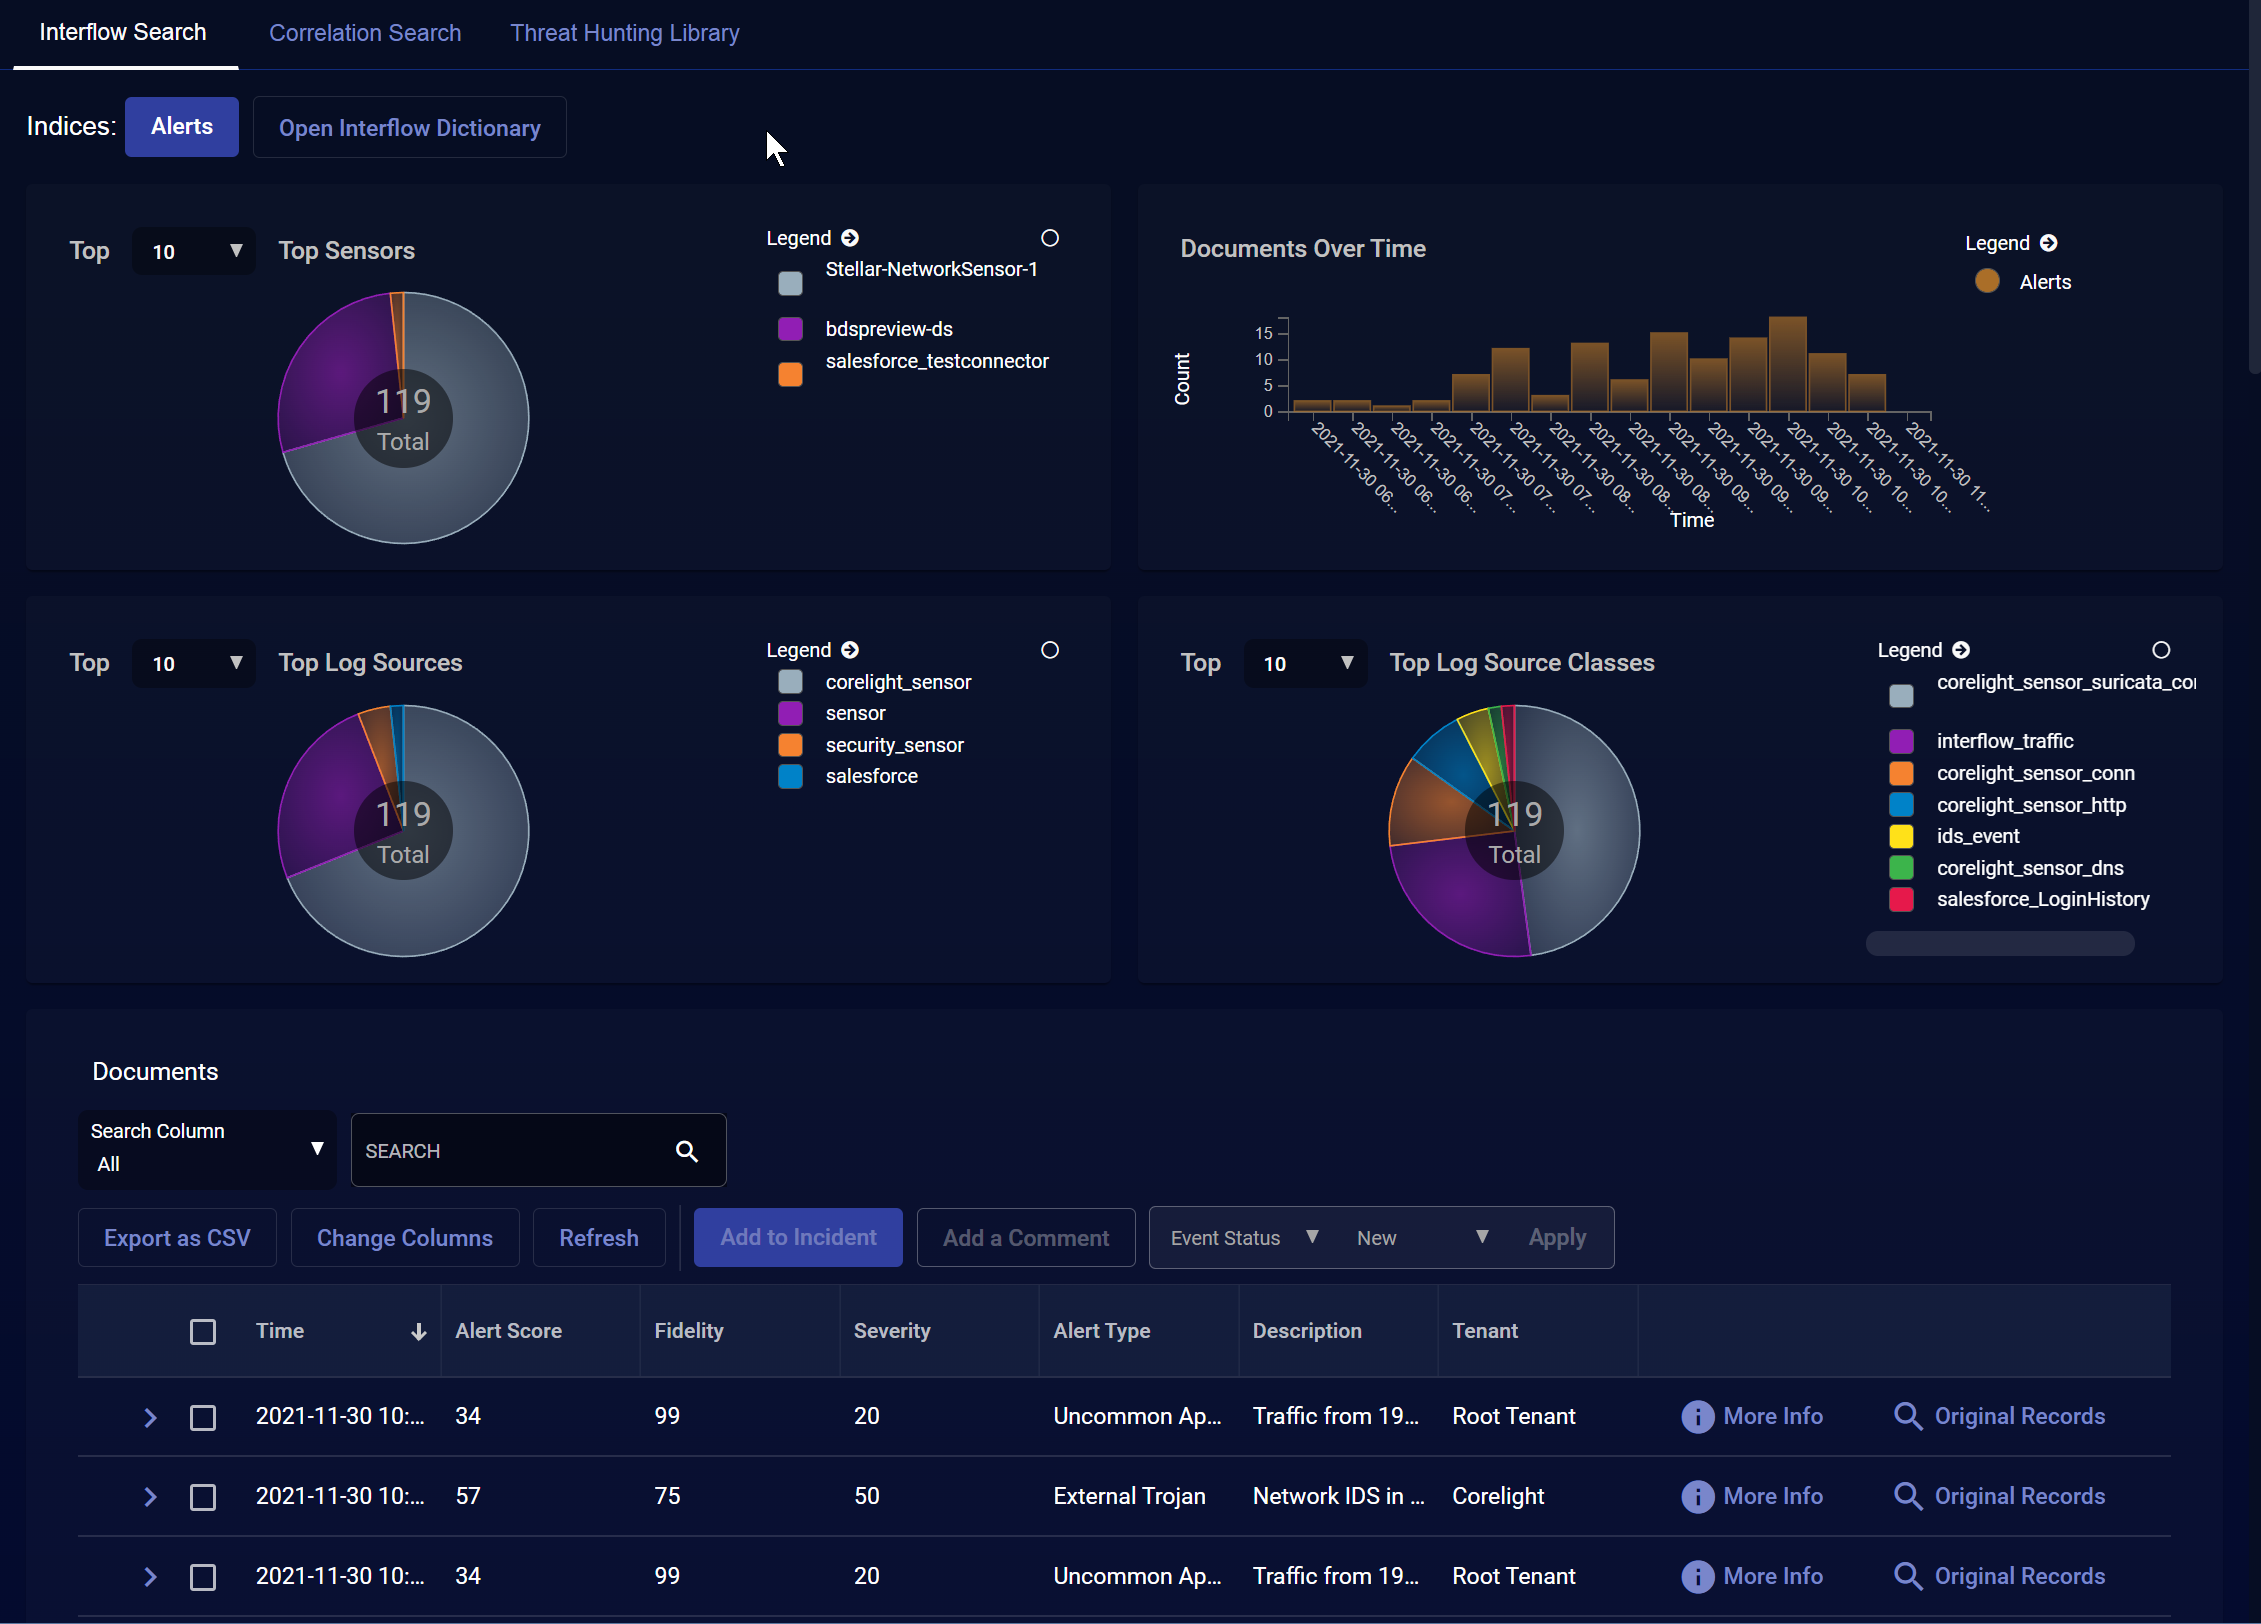
The most important control on this screen is the Indices selector. The Stellar Cyber data lake supports the following indices:
- Alerts (default)
- Assets
- AWS Events
- DP Monitoring
- Linux Events
- ML-IDS/Malware Sandbox Events
- Scans
- Sensor Monitoring
- Signals
- Syslog
- Traffic
- Users
- Windows Events
You can choose a single index, multiple indices, or even all indices.
Searches through multiple indices can be resource intensive, so Stellar Cyber will restrict the time interval to reduce the performance impact.
Interflow Search Using the Search Field
Use the same search syntax in this field as you use elsewhere in the Stellar Cyber UI to isolate specific records. Ideally, you set the index first and then search for a specific pattern, such as srcip:10.20.25.119. (You can start with the Visual Dictionary to learn more about the fields to query, if needed.)
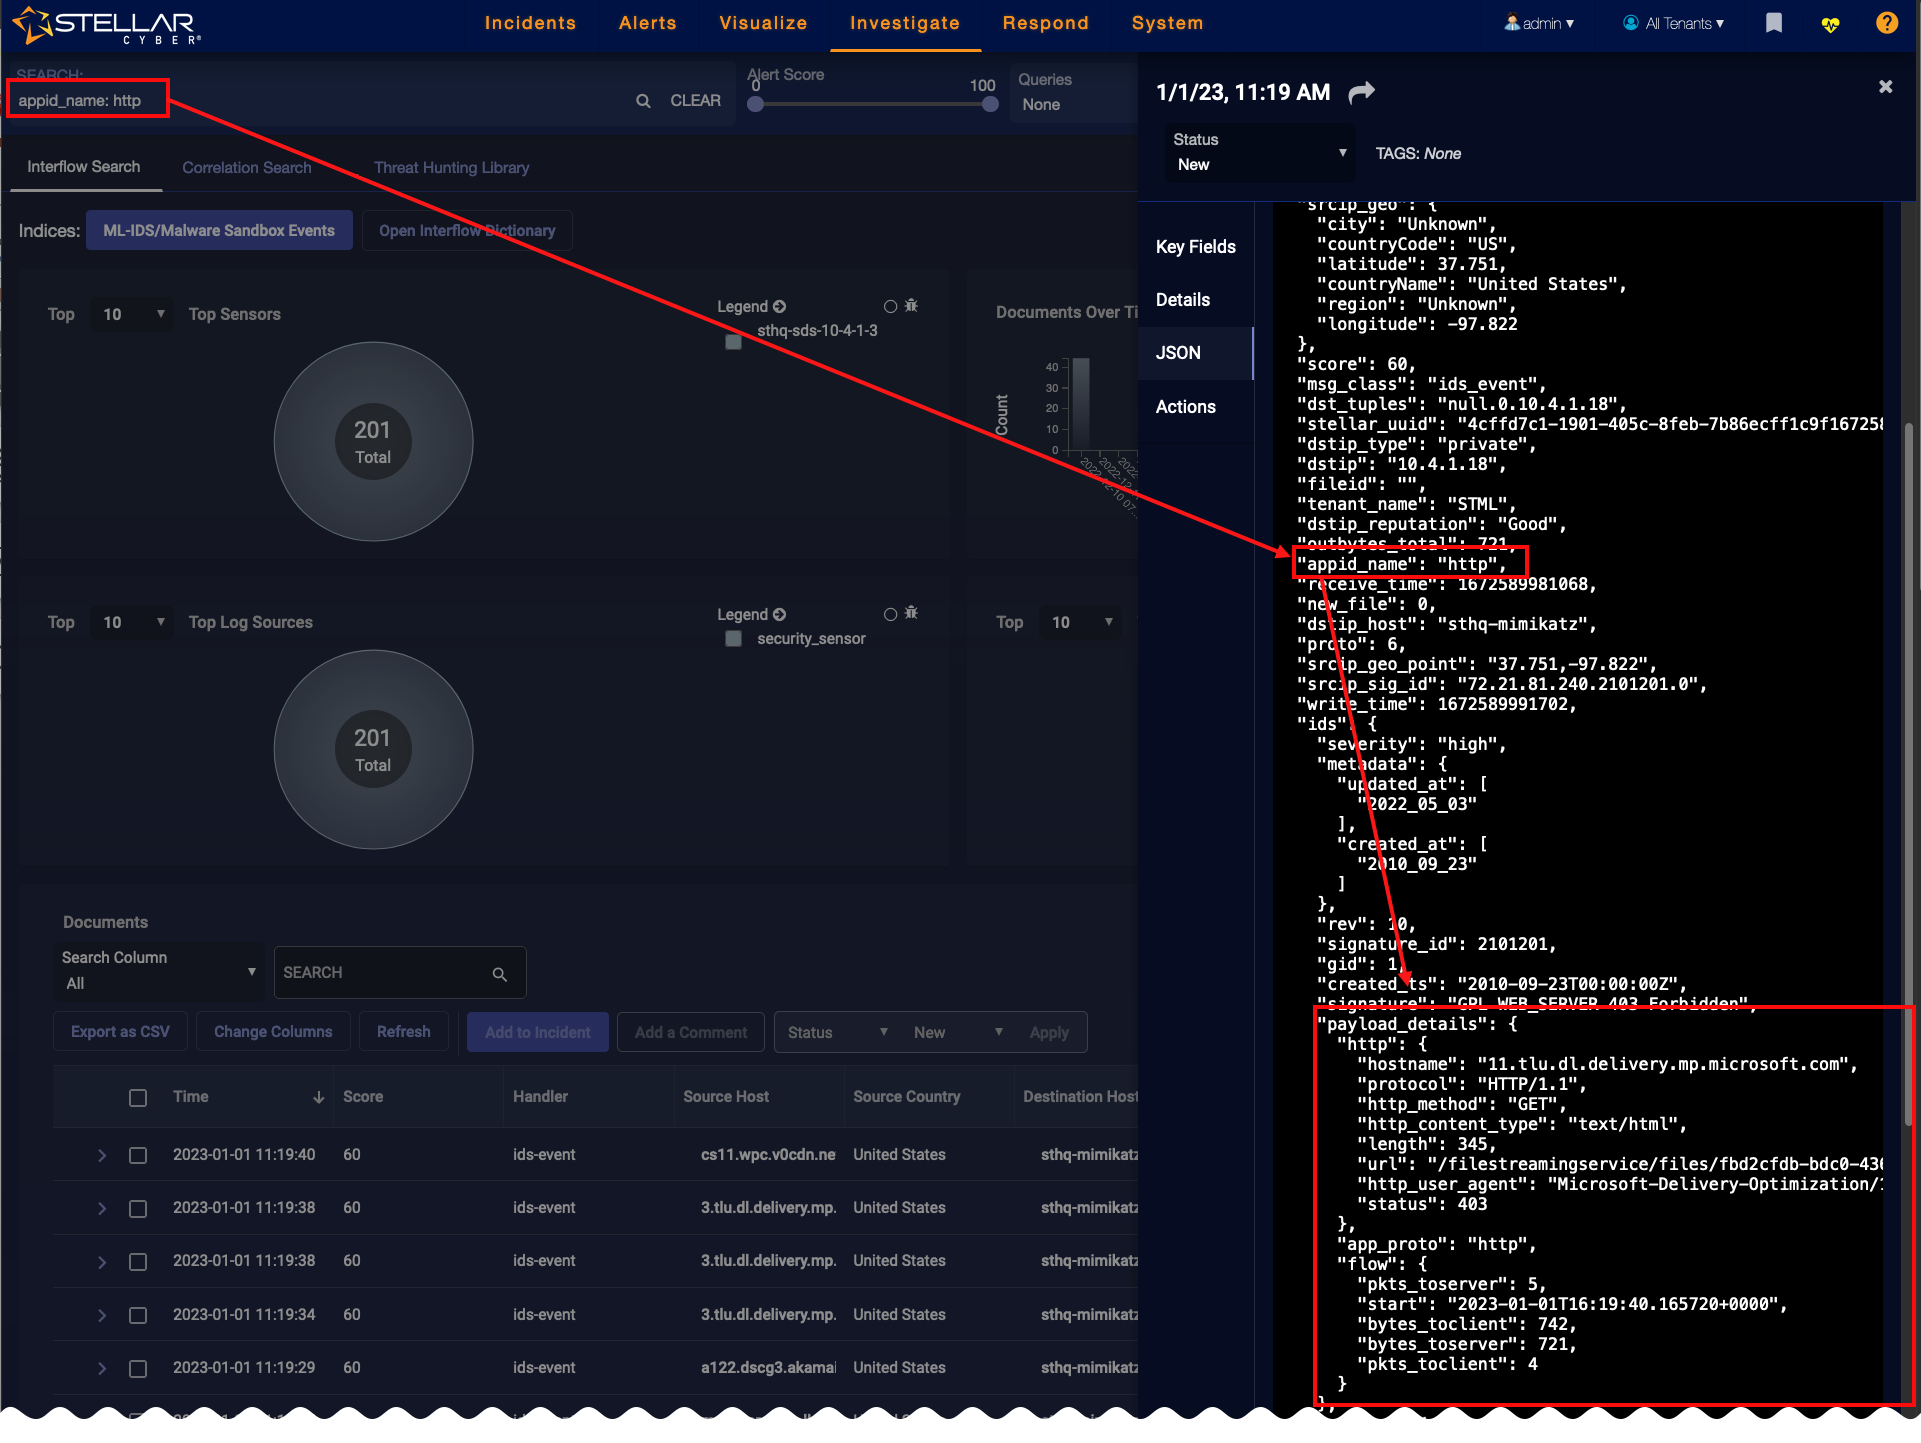
Following is an example search for IDS records with payload data. The payload feature is supported with dns and http, so let's create a query that searches for just this feature for just that app type.![]()
-
Access Investigate | Threat Hunting.
-
Set the index to ML-IDS / Malware Sandbox Events.
-
In the Search field above the index, enter the following string, which is only present in those records (substitute
dns, as needed):ids.payload_details.app_proto:http
-
Click the search icon at the right of the field. The Documents table updates with all matching records.
-
You can now click More Info from a specific row in the Documents table to display the event details.
-
From there you can open the JSON tab and view the payload information.
Note that encrypted payload data is not parsed with this feature.
Interflow Search Using the Visual Dictionary
Click the Open Interflow Dictionary button to display Interflow data.
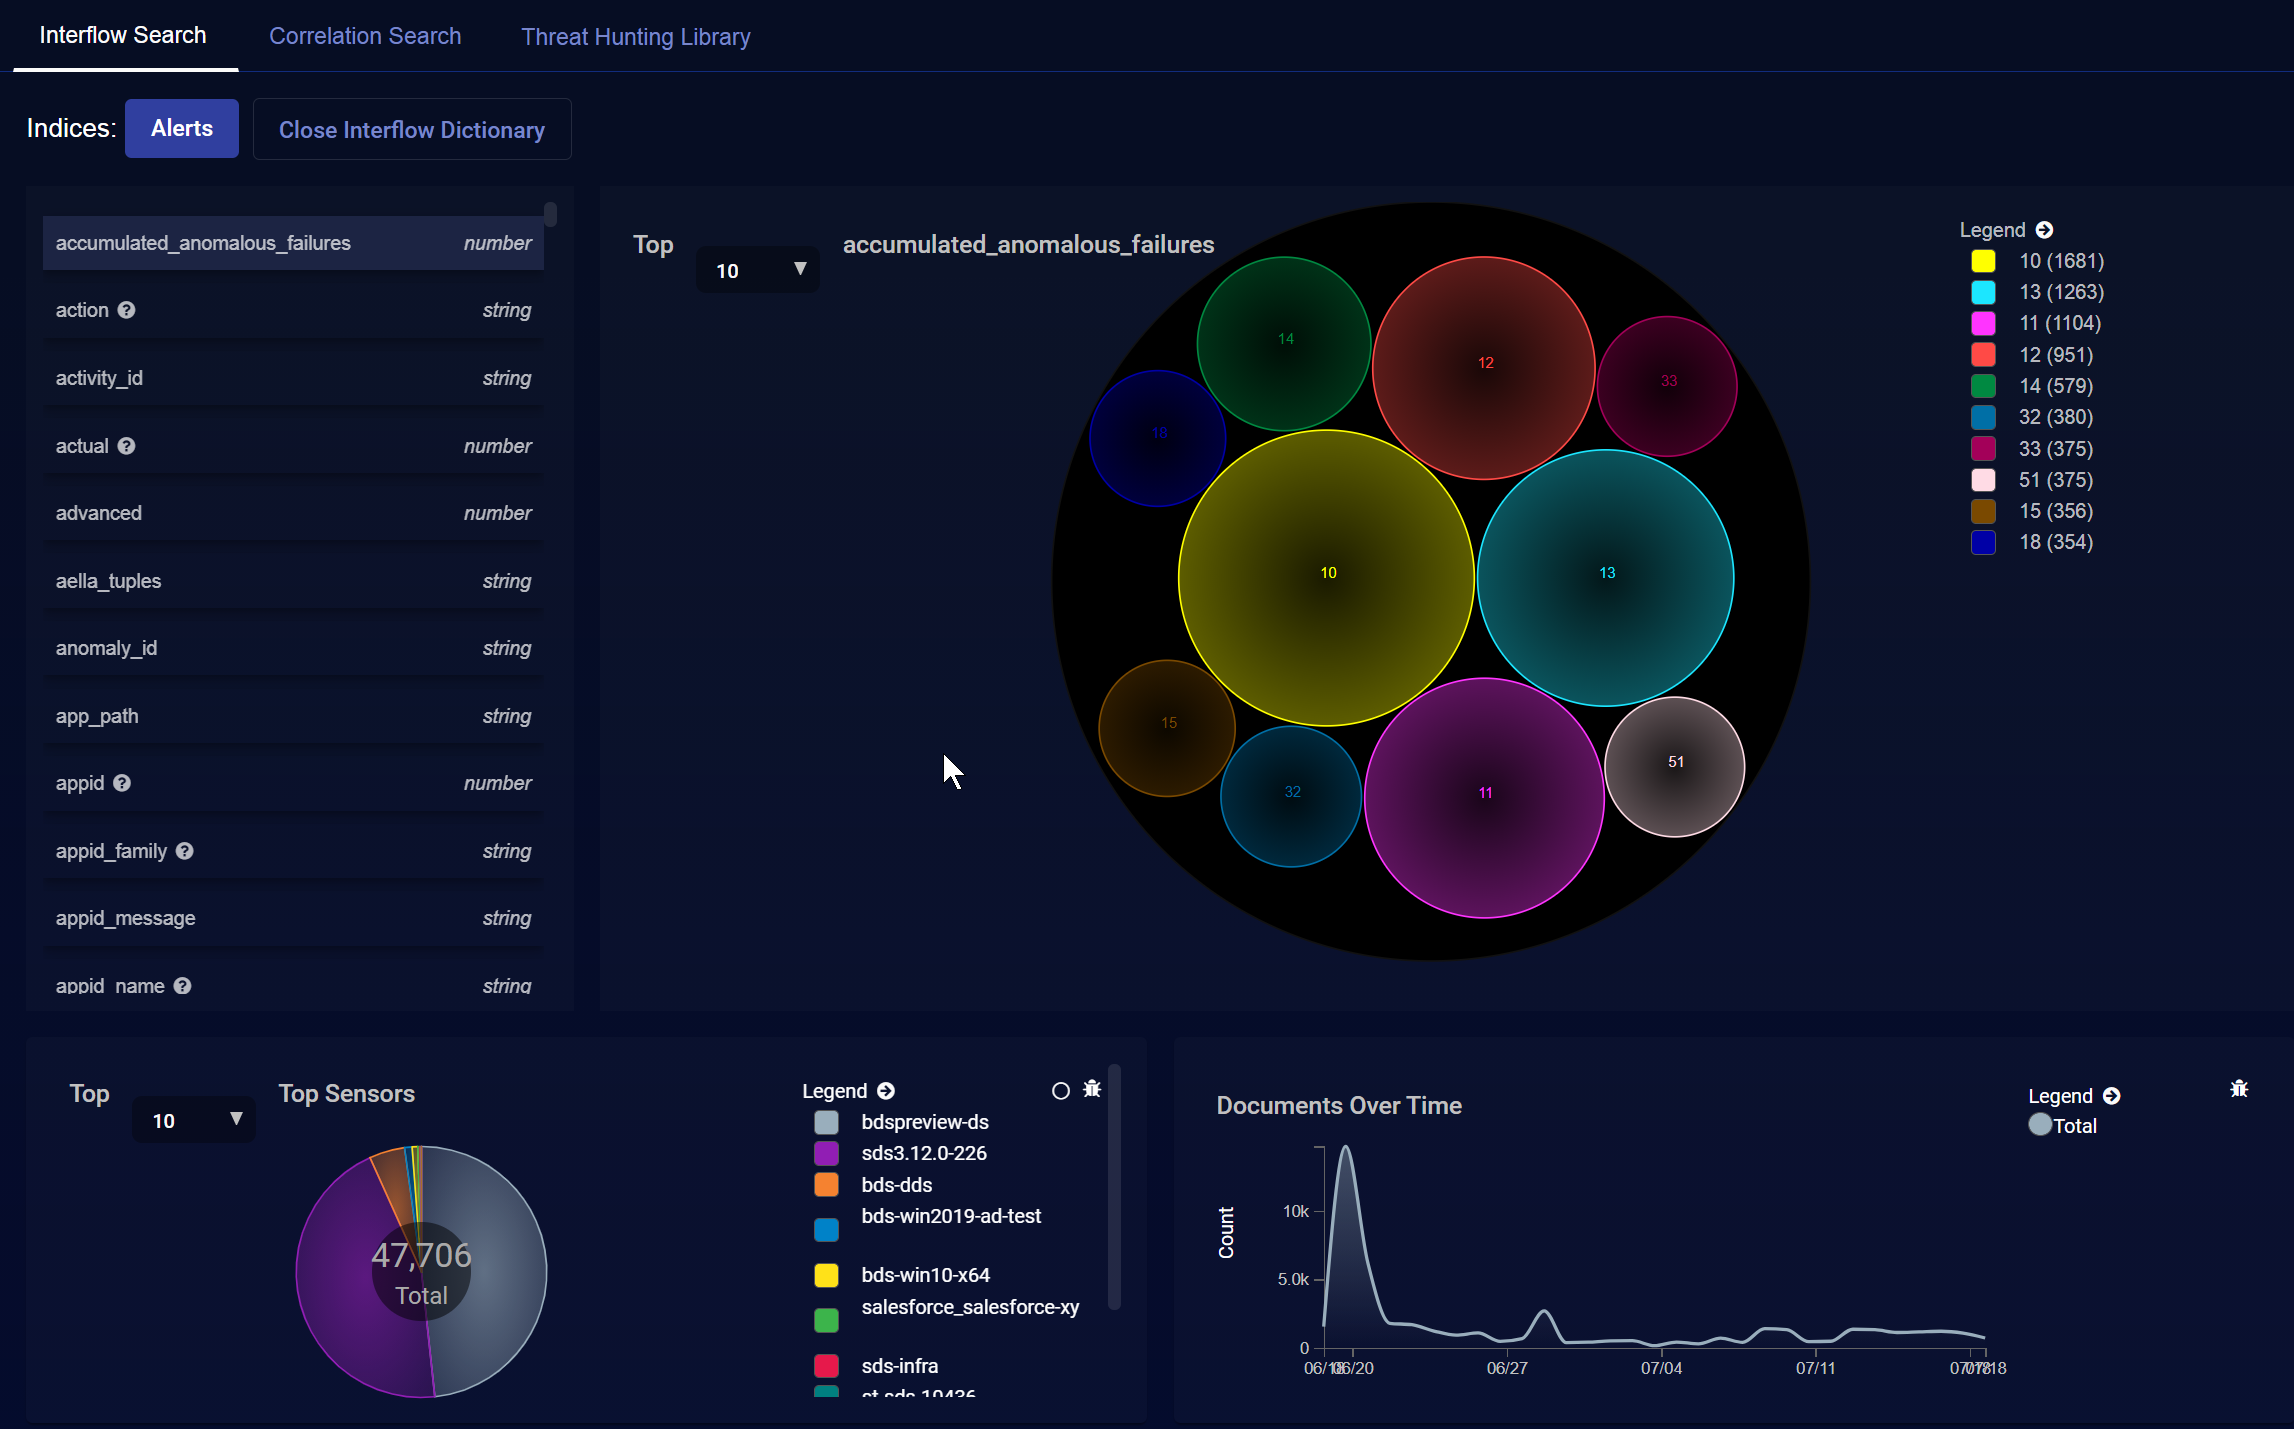
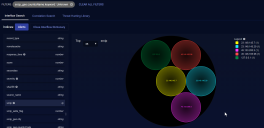
The keywords are displayed next to the visual dictionary. The visual dictionary provides a simple, visual way to hunt for threats. To begin threat hunting visually:
- Find a keyword to use as the beginning of your hunt.
- Click on that keyword. The visual dictionary immediately changes to reflect your choice. We chose srcip_geo.countryName.

- There are five source IP addresses from an unknown country in our example. If we hover over Unknown (5) in the legend, the and buttons appear.
- If we click , Unknown is added to the filter and the results are immediately filtered. Now we only see results with a source IP address from an unknown country.
- We will find and click on another keyword to further narrow our hunt. We chose event_type. The display again immediately changes to reflect our choice.
- In our example, there have been four exploits from source IP addresses from an unknown country.
- We found and clicked on srcip. We can now see the IP addresses from which the exploits originated.


When you leave this page, any filters remain selected. So you can continue your threat hunting on other parts of Stellar Cyber.
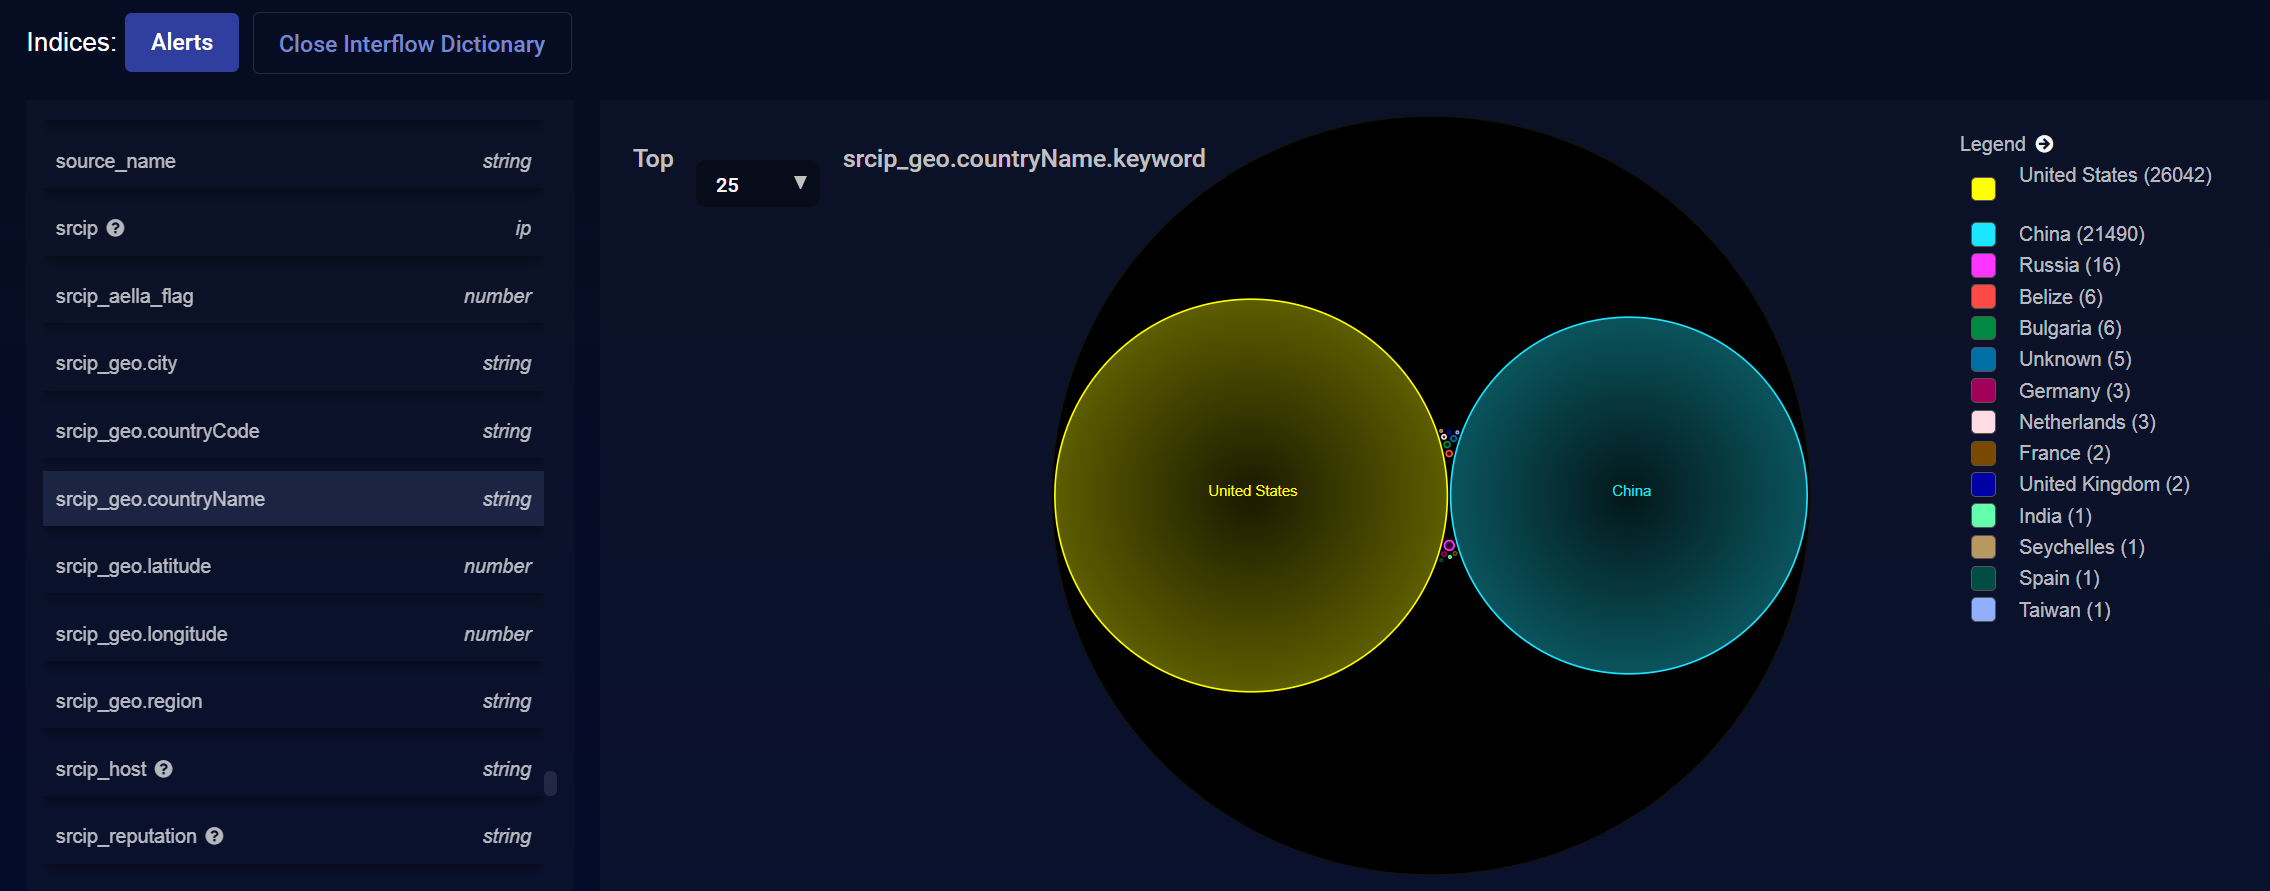
Interflow Search Using the Table
The Interflow records table is at the bottom of the screen.
The Interflow records table is a very powerful threat hunting tool. Following are the things you can do to help you hunt down threats:
-
Hover over a field and click the
 icon that appears. The and buttons appear. Click to filter the results to include only that value. Click to filter the results to exclude that value.
 -
Click More Info to see the event details.
-
When searching the Alerts index, you can also use the Original Records button to view the records that were used to generate the corresponding alert.
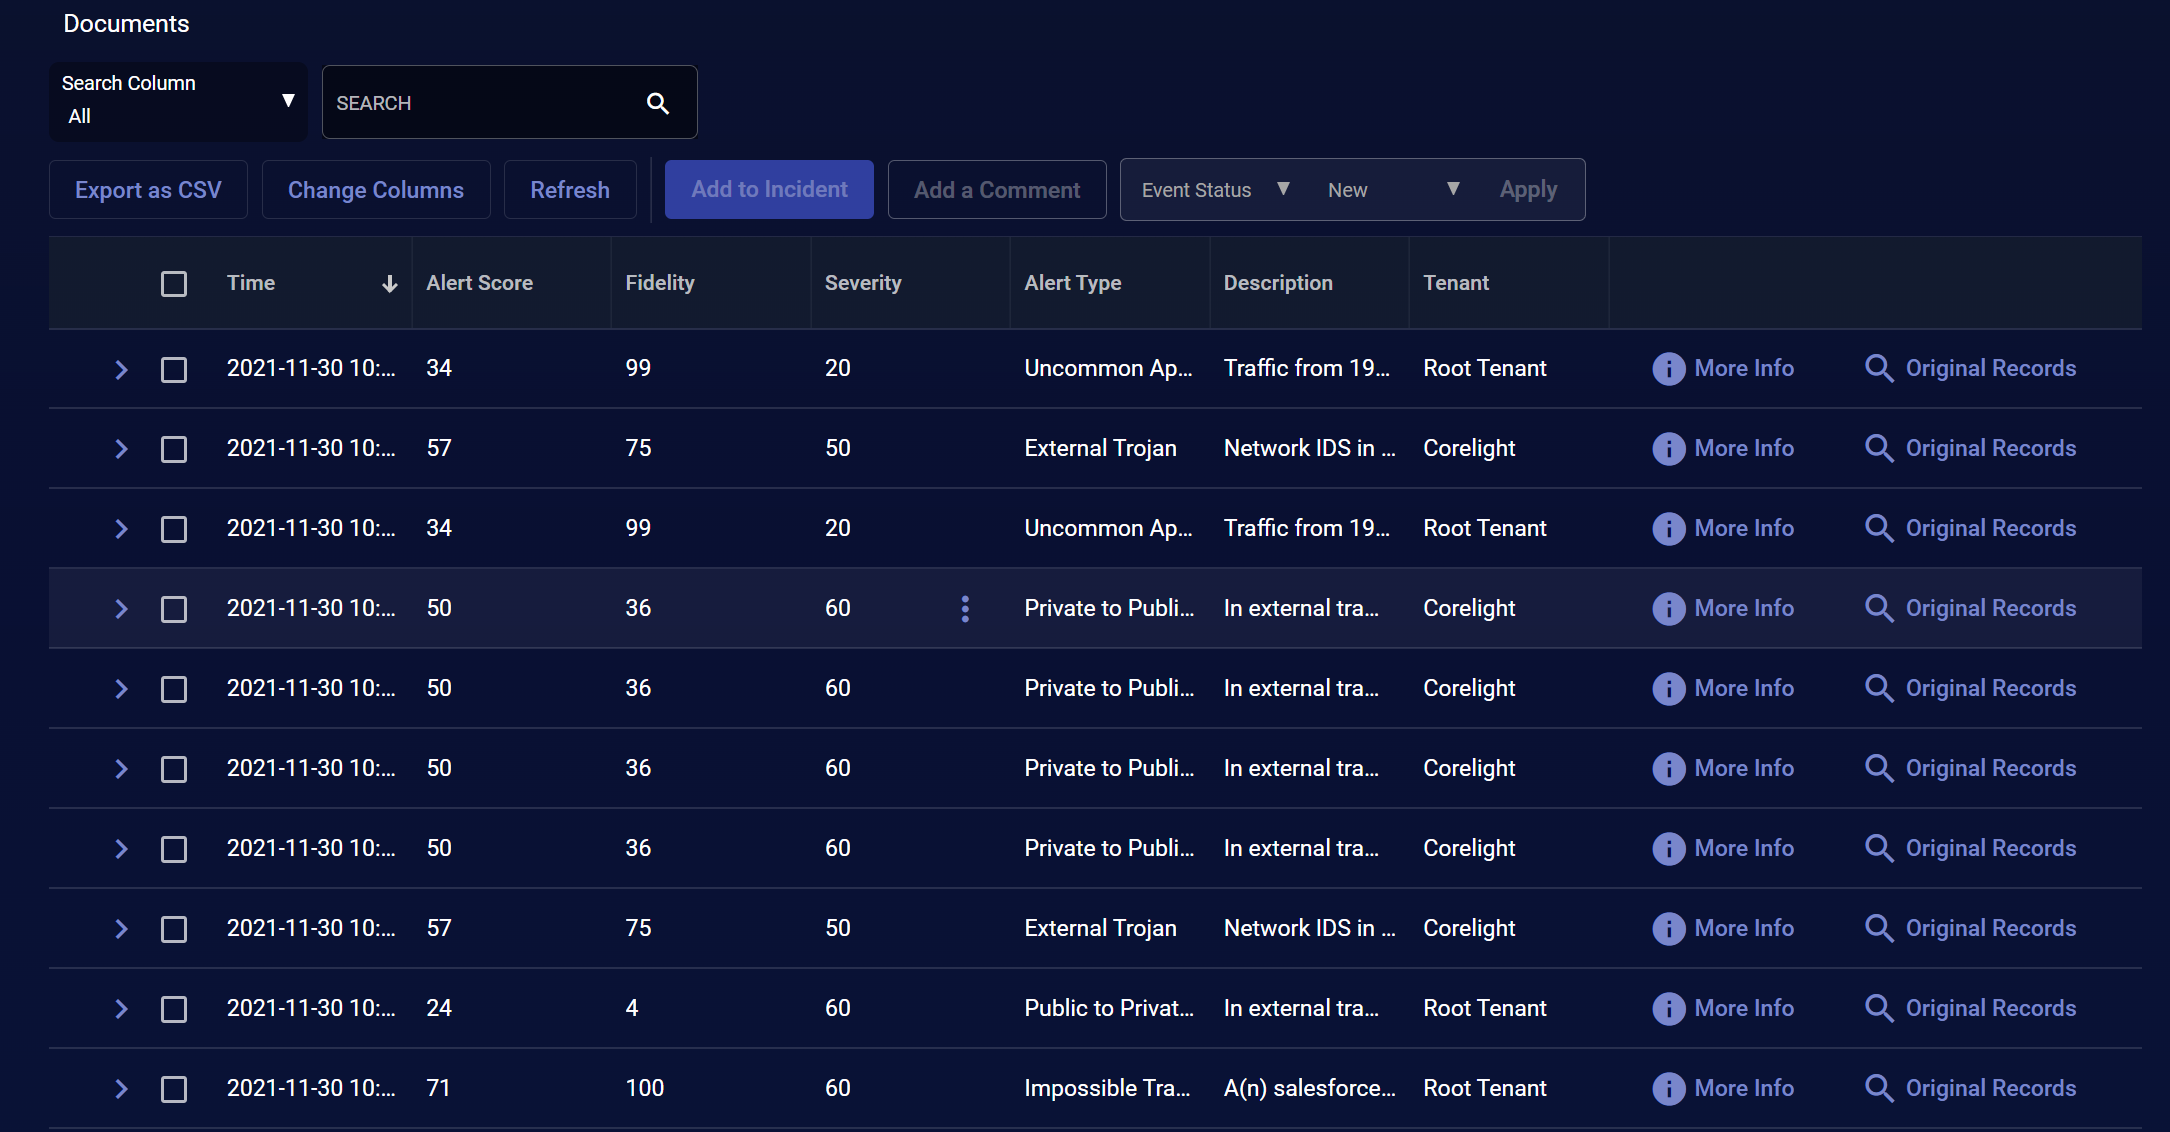
-
Click
 to cascade an entry in the Interflow table open and see the Interflow table for that event.
- Click Change Columns to display a drop-down menu that lets you change the fields displayed in the table. Keep in mind that the default columns in the Interflow table change depending on the selected Indices at the top of the page.
- Click Add to Case to add an alert to an existing Case or create a new Case based on the alert.
- Click the icon to display a context menu that lets you:
- Click to filter the results to include only that value.
- Click to filter the results to exclude that value.
- Click to copy the field's value to your clipboard.
When you leave this page, any filters remain selected. So you can continue your threat hunting on other parts of Stellar Cyber.
Correlation Search
You can use the Correlation Search page to hunt for correlations between events.
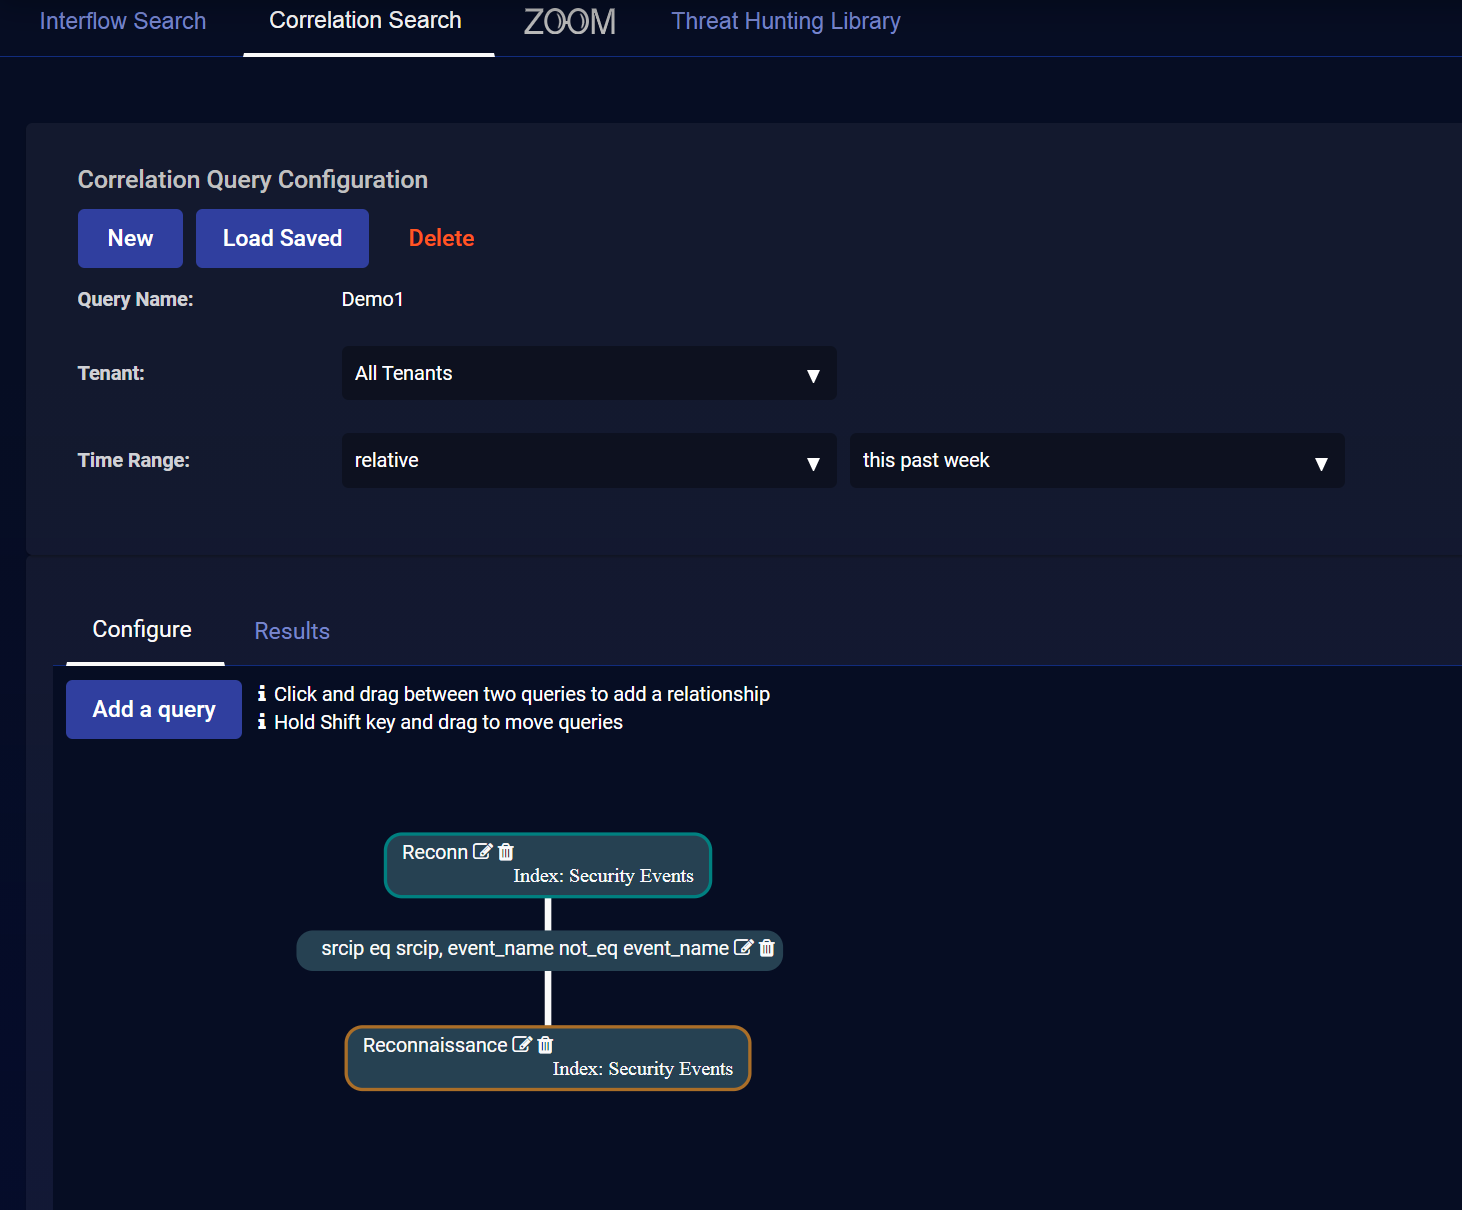
To visualize alert correlations:
-
Select your tenants.
-
Select your time range.
-
Define a query or choose a saved query. For this example we chose Reconn, which finds reconnaissance events.
-
Define a second query or choose another saved query. For this example we chose Reconnaissance, which finds any security event.
-
Drag a line between the queries to define a relationship. In this example we selected both Same Source IP and Query 2 happened after query 1.
-
Continue adding queries by clicking the Add a query button until your correlation is complete.
-
Click Run.
A screen similar to the following visualizes the correlation between the alerts from each query.
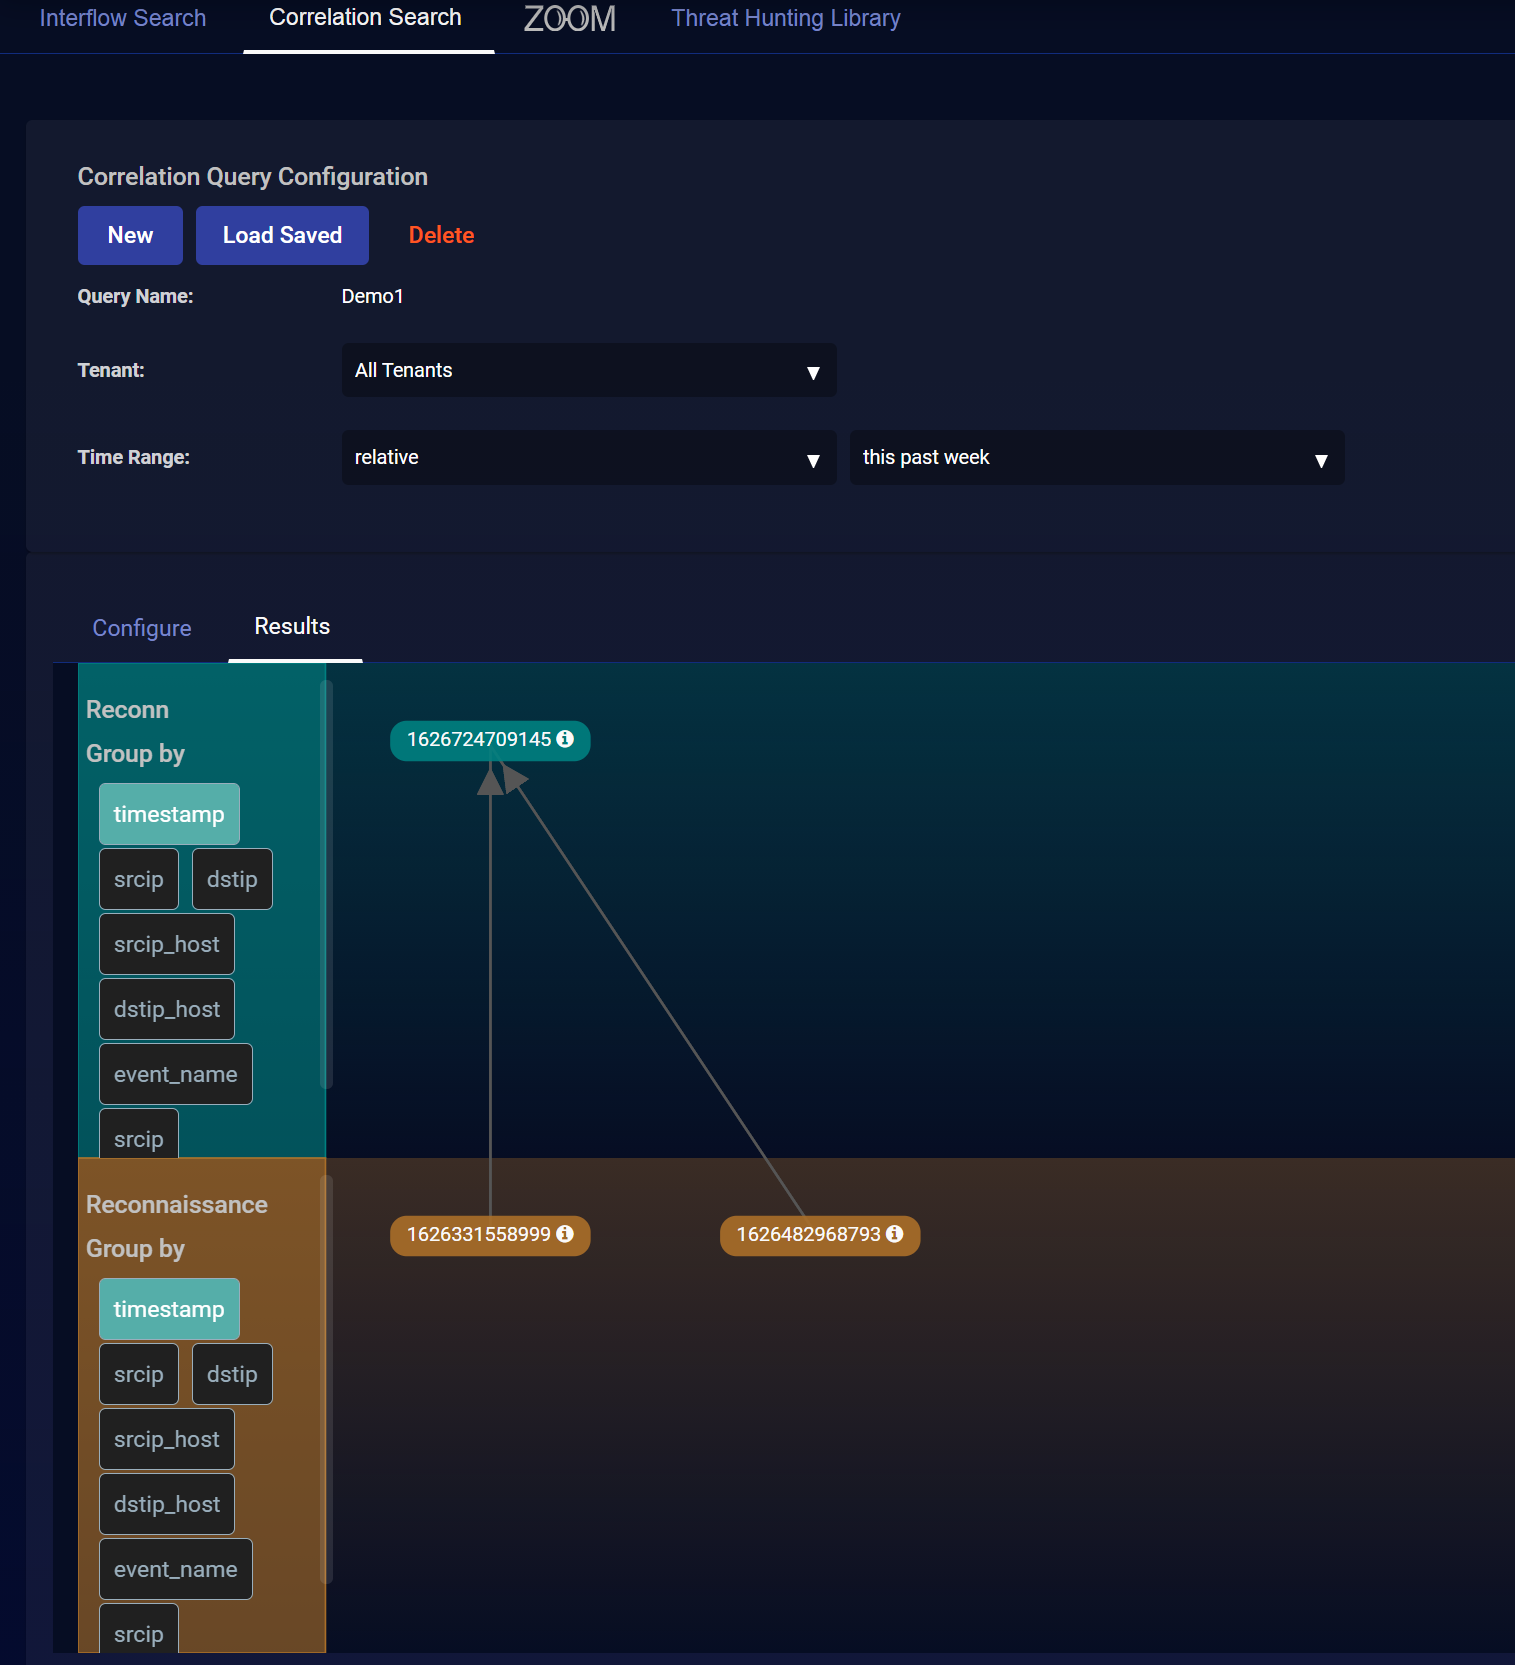
If your correlation times out, you might be trying to retrieve too many records. Edit your queries and reduce the number in the Get xx records field.
You can save your visualization at any time.
ZOOM
The ZOOM tab allows you to focus in narrowly on a single entity in a security event and see its relationship to other entities. The lateral view, which is the default, lays out the relationships laterally, in branches. The chronicle view lays out the relationships based on time. You can start to focus directly in the ZOOM tab, or you can start from an event. However you start, you can analyze relationships in the same way.
The ZOOM feature is deprecated in 4.3.7 and will be removed in a future release.
Focusing in the ZOOM Tab
If you already know what you want to focus on:
-
Click Investigate | Threat Hunting. The Threat Hunting page appears.
-
Click ZOOM. The ZOOM tab appears with a blank screen.
-
Click in the FIELD option. The selections drop down.
-
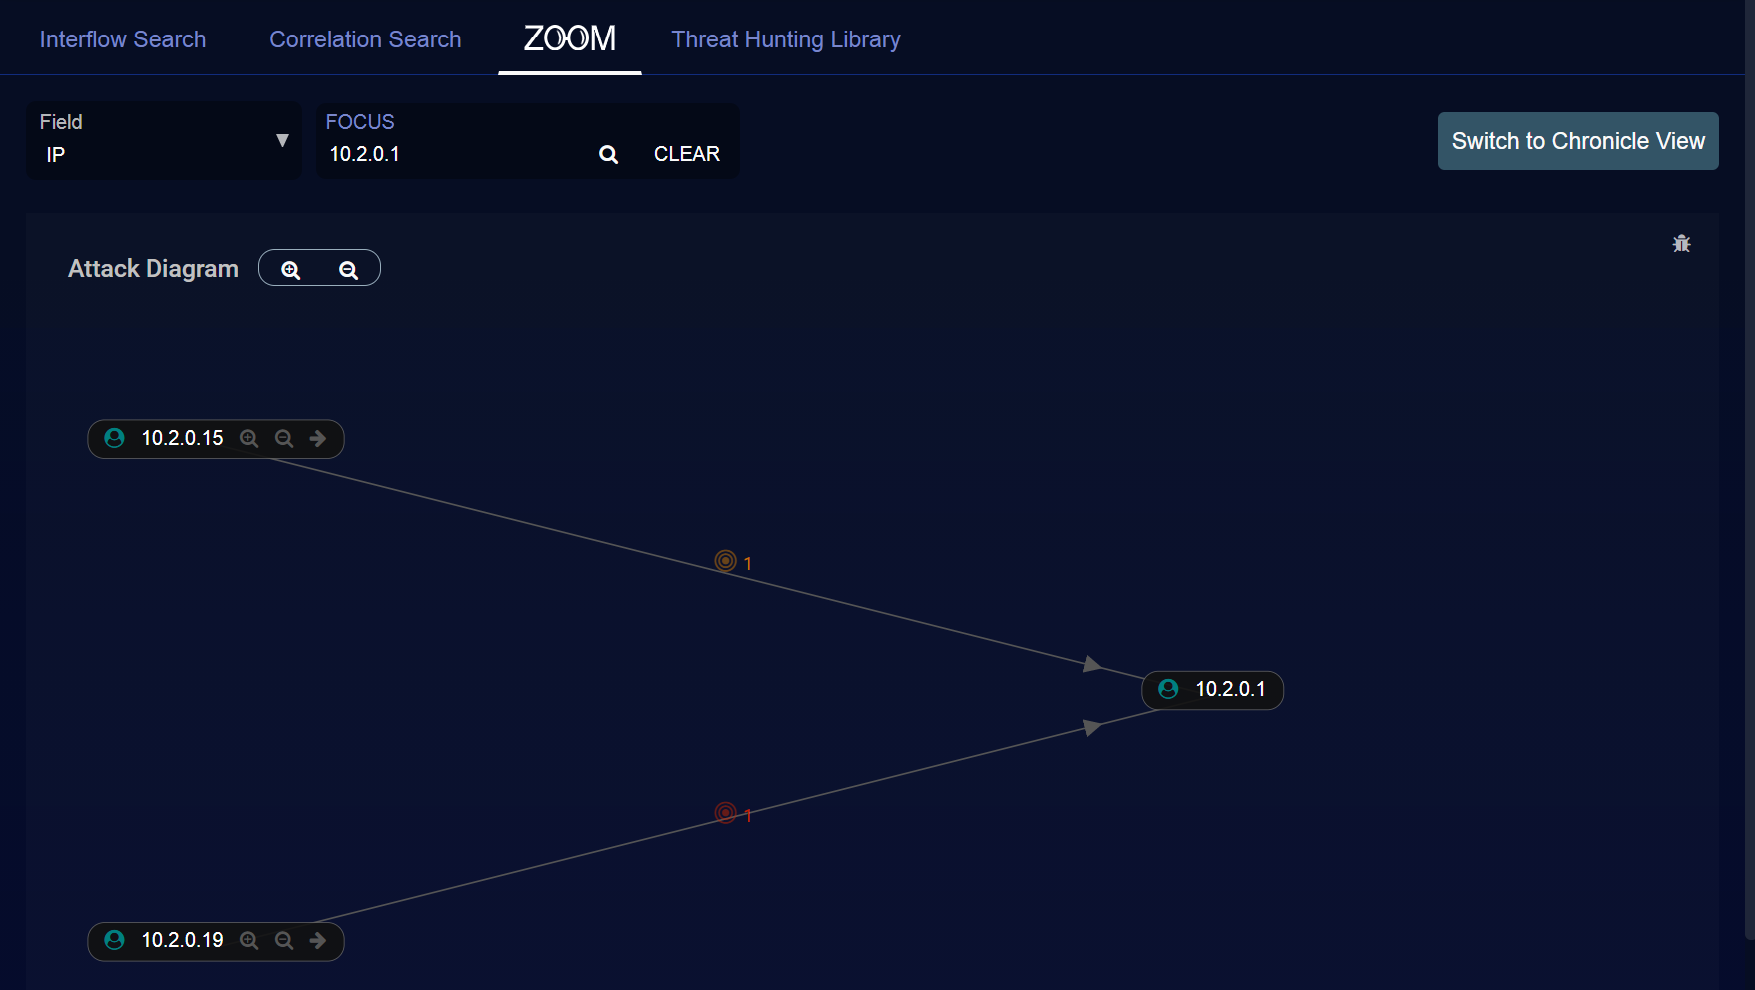
Choose the field you want to focus on, which can be Host, IP, URL, or User. We chose IP.
-
Enter the entity you want to focus on. In this case, we entered the IP address of 10.2.0.1. The ZOOM diagram is displayed.
Now you can analyze the relationships.
Focusing to the Lateral View from an Event
If you're looking at an event and want to investigate entities related to that event in the ZOOM Lateral View:
-
Click More Info next to the title of the event you're interested in.
-
Click
next to the field you're interested in. We chose Src IP. -
Click ZOOM Lateral View. The Investigate | Threat Hunting | ZOOM page appears with the diagram of the relationships, as shown in the figure below.
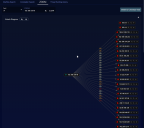
Now you can analyze the relationships.
Focusing to the Chronicle View from an Event
If you're looking at an event and want to investigate entities related to that event in the ZOOM Chronicle View:
-
Click More Info next to the title of the event you're interested in.
-
Click
next to the field you're interested in. We chose Src IP. -
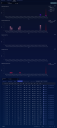
Click ZOOM Chronicle View. The Investigate | Threat Hunting | ZOOM page is displayed with the diagram of the relationships. The time of the event is highlighted in the charts.
Now you can analyze the relationships.
Analyzing Relationships
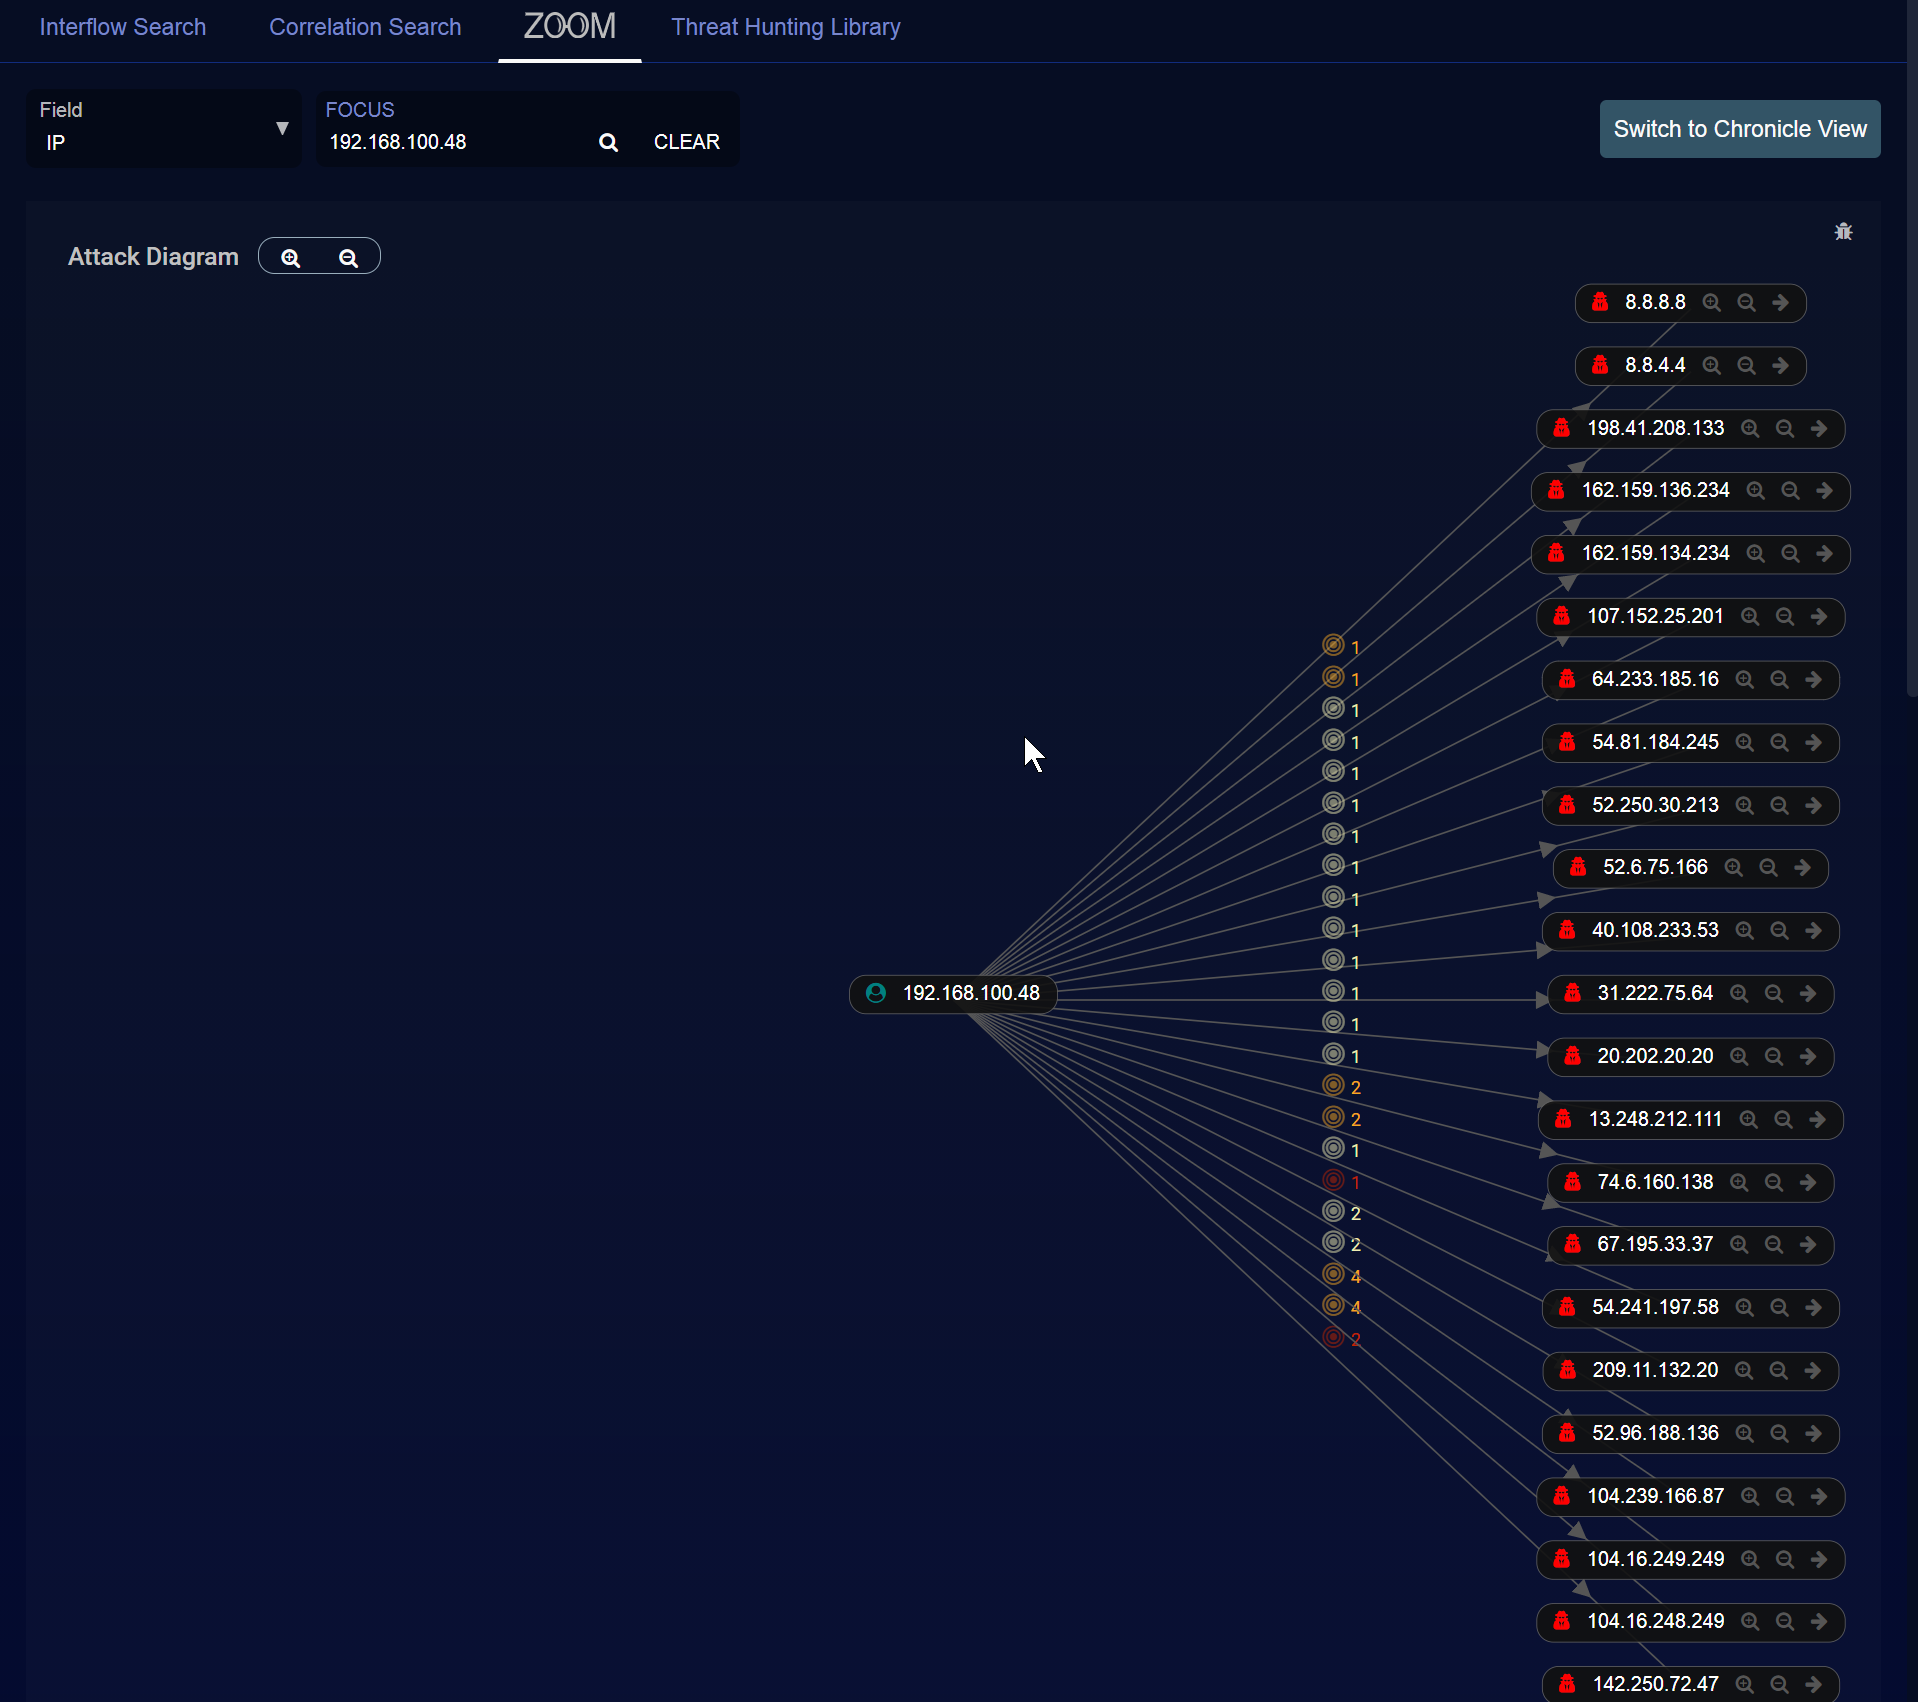
The ZOOM Lateral View is the default display, and is dense with information and options. If the view is too dense or sparse, use the and in the upper left by Attack Diagram to zoom out and in.
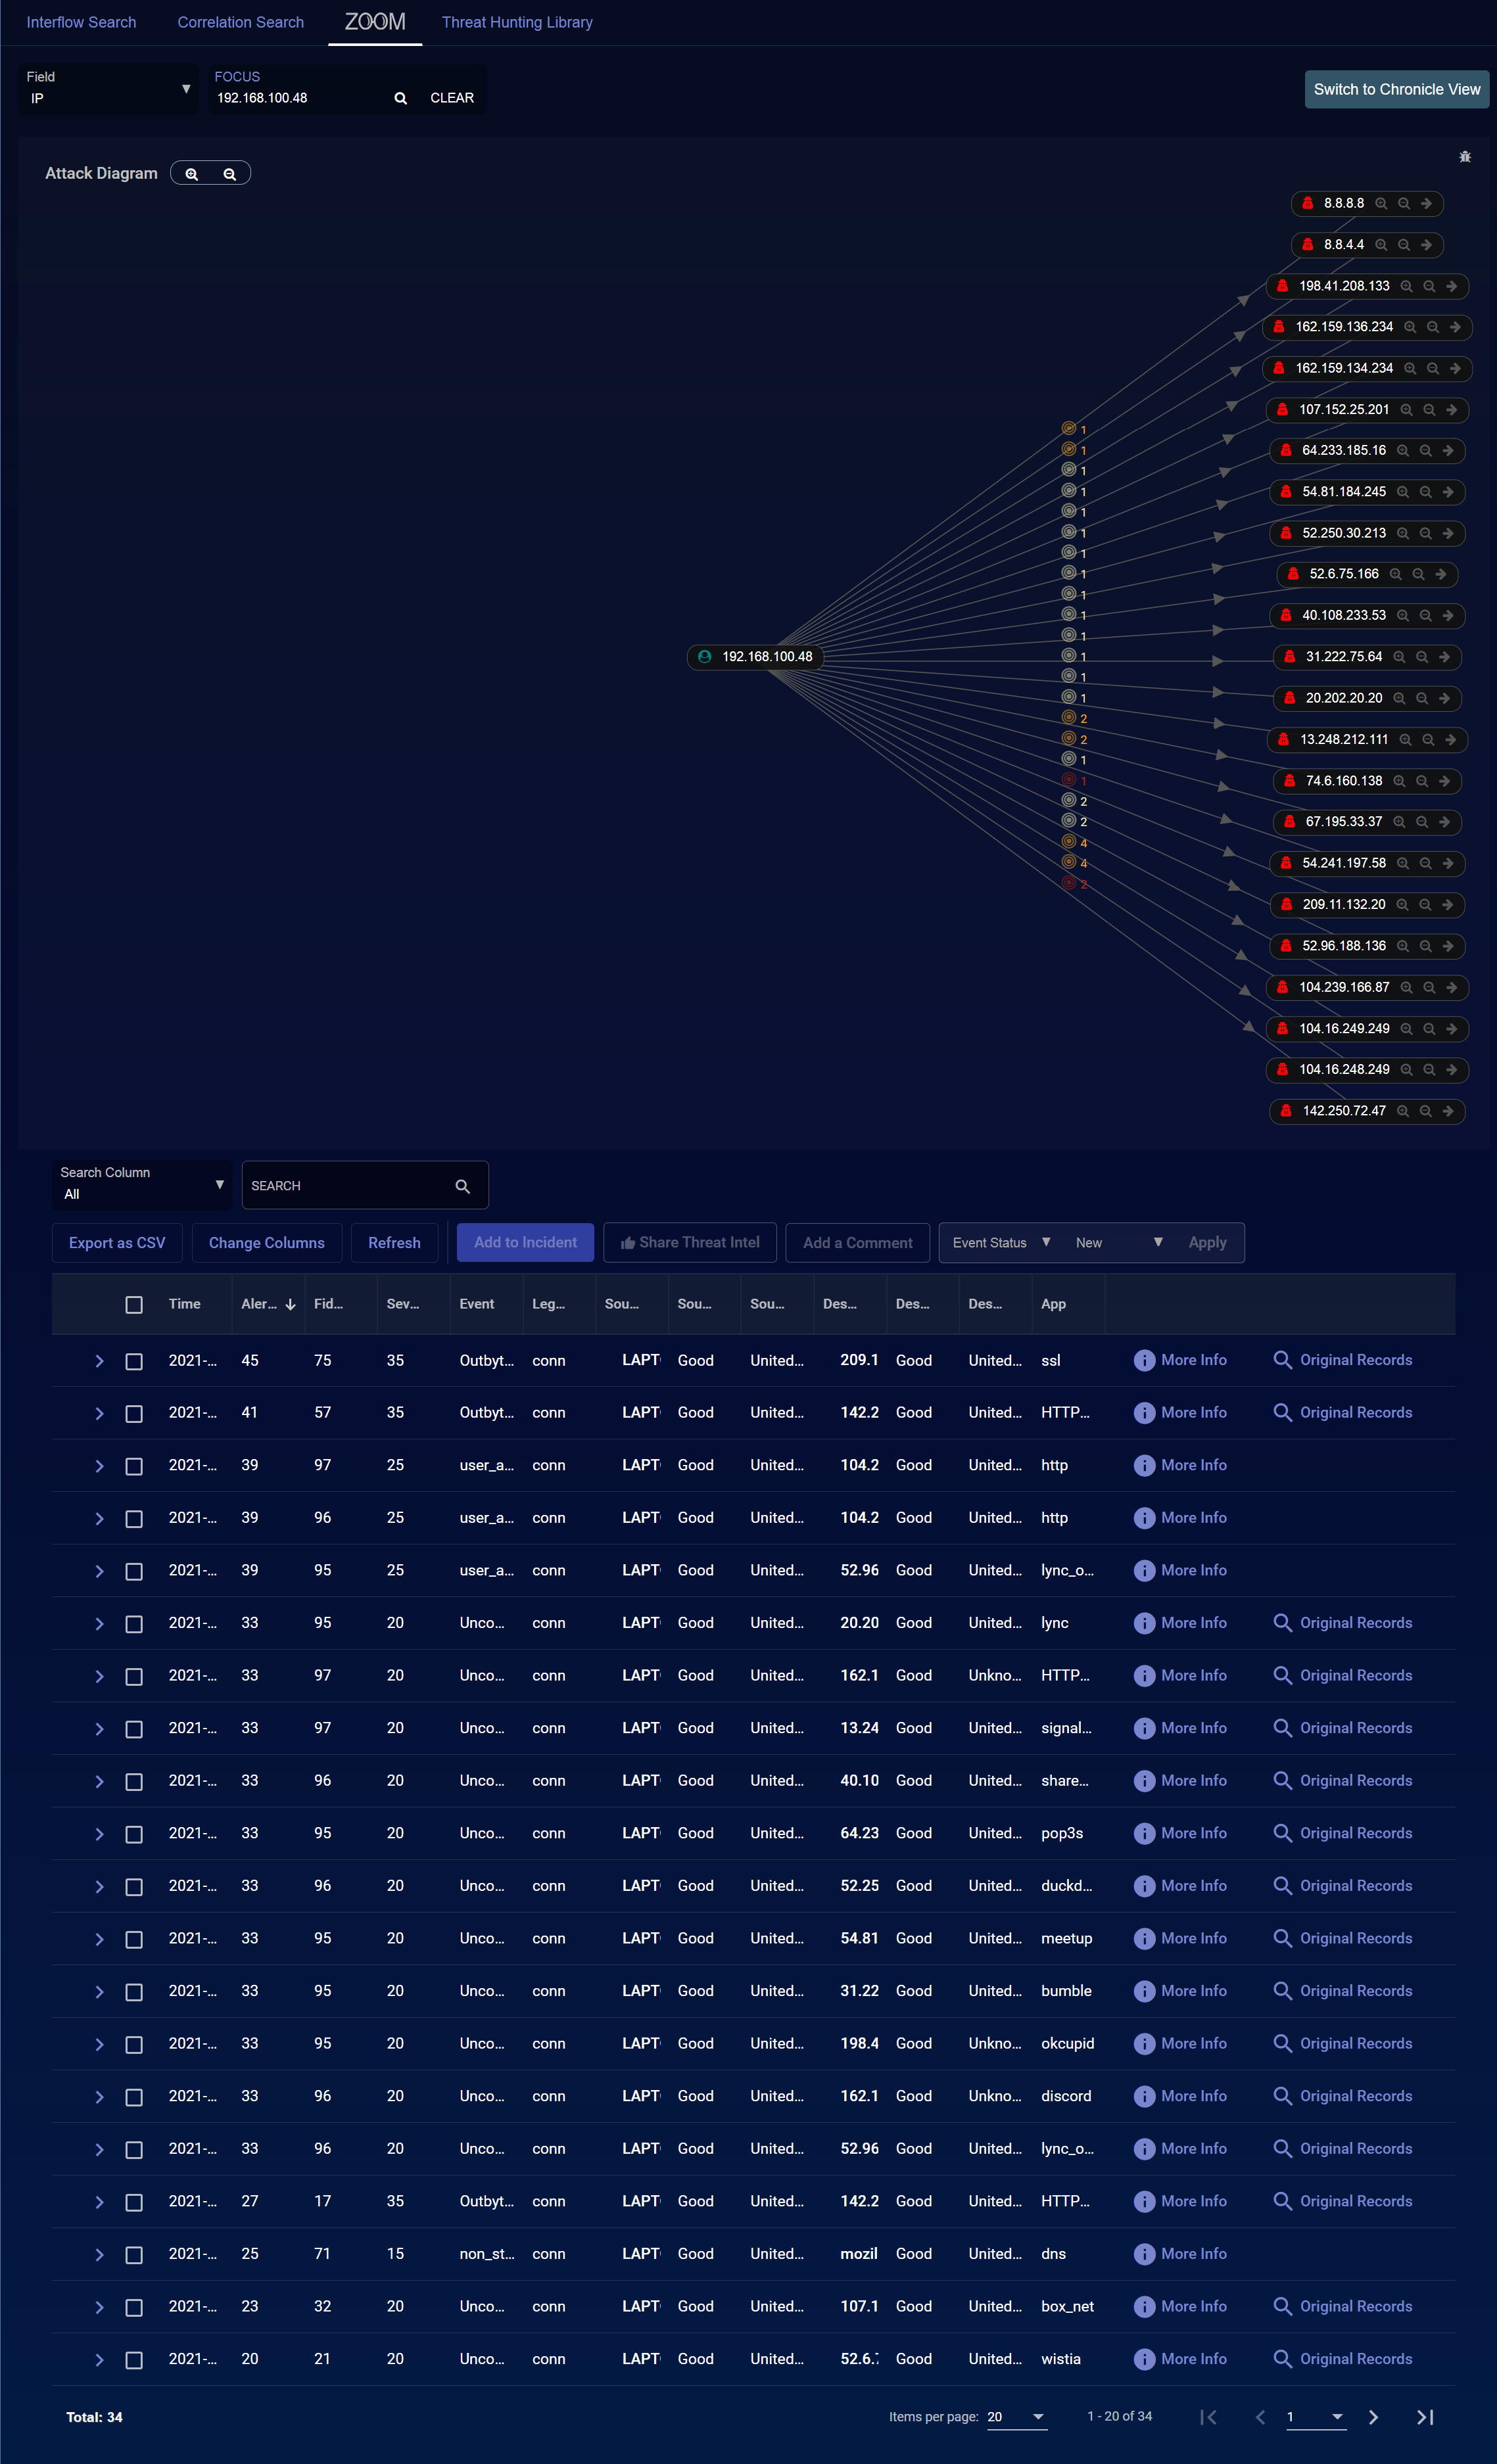
The entity that is the focus is in the center of the diagram. Lines radiating from the focus indicate relationships, with arrows marking the direction of flow. A in the middle of each line represents the event creating the relationship, and is color coded according to its place in the kill chain.
You can:
-
Click and drag to move the screen
-
Hover over any entity to see details
-
Click to filter for those events
-
Click to filter on an entity
-
Click to filter an entity out
-
Click to shift focus to that entity
-
Click Switch to Chronicle View to see the events organized by category
Threat Hunting Library
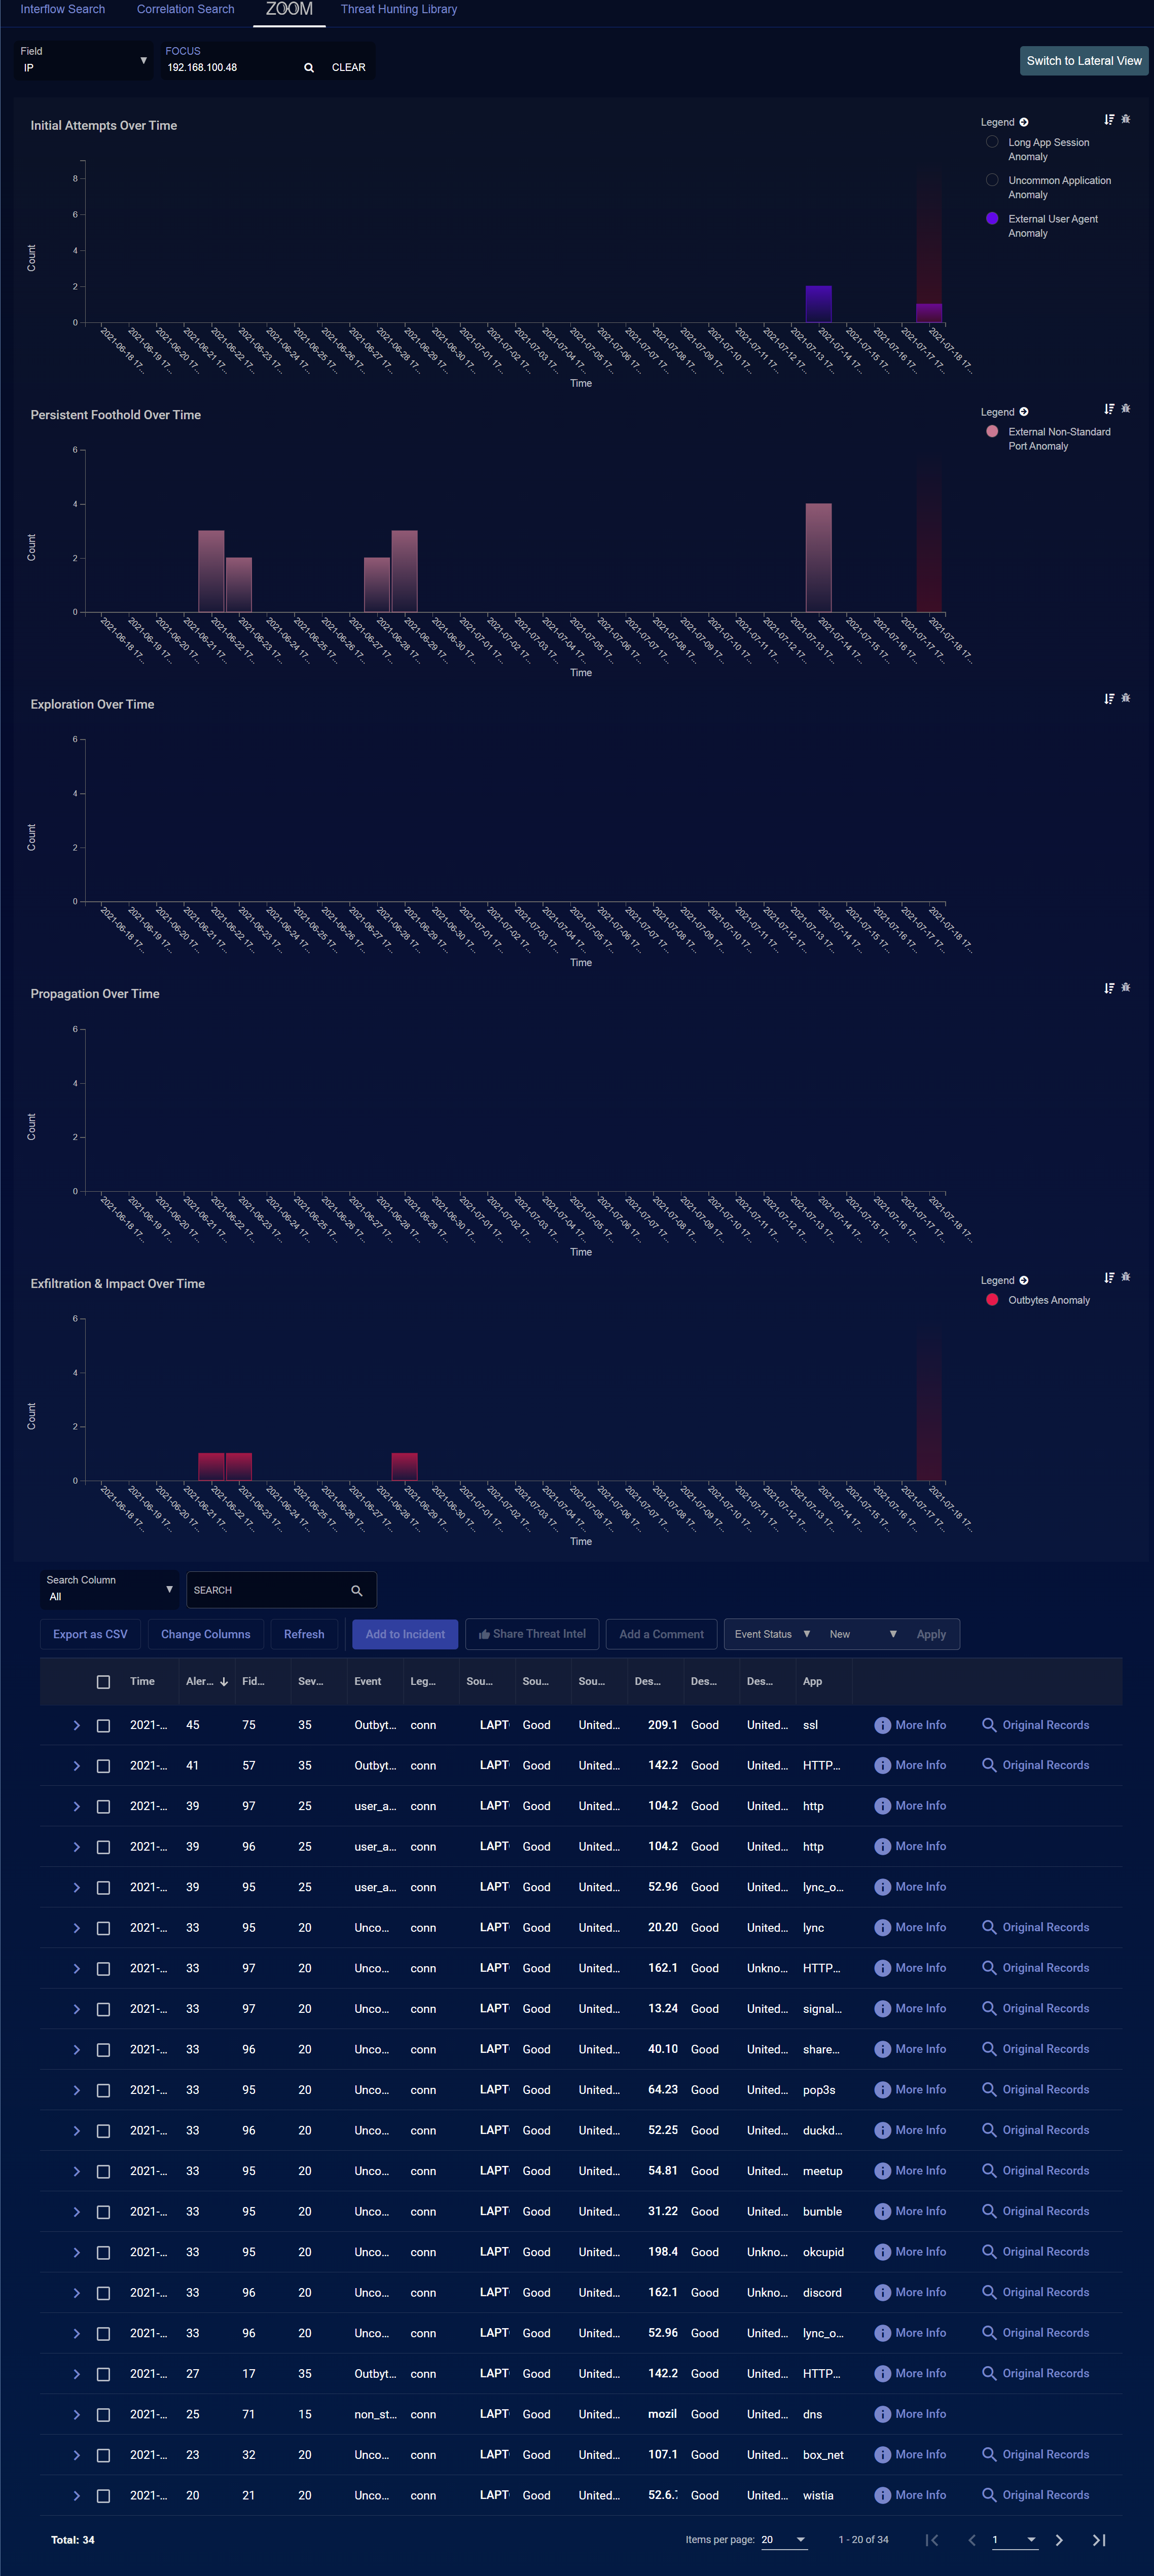
When you choose the Threat Hunting Library, you must then choose an alert type. The screen appears similar to the image below. Each box represents one alert type, with the number in the box showing the total count of alerts of the corresponding type that were detected. Clicking on a box selects that alert type and displays the data.
To choose a different alert type, click the Threat Hunting Library tab again.
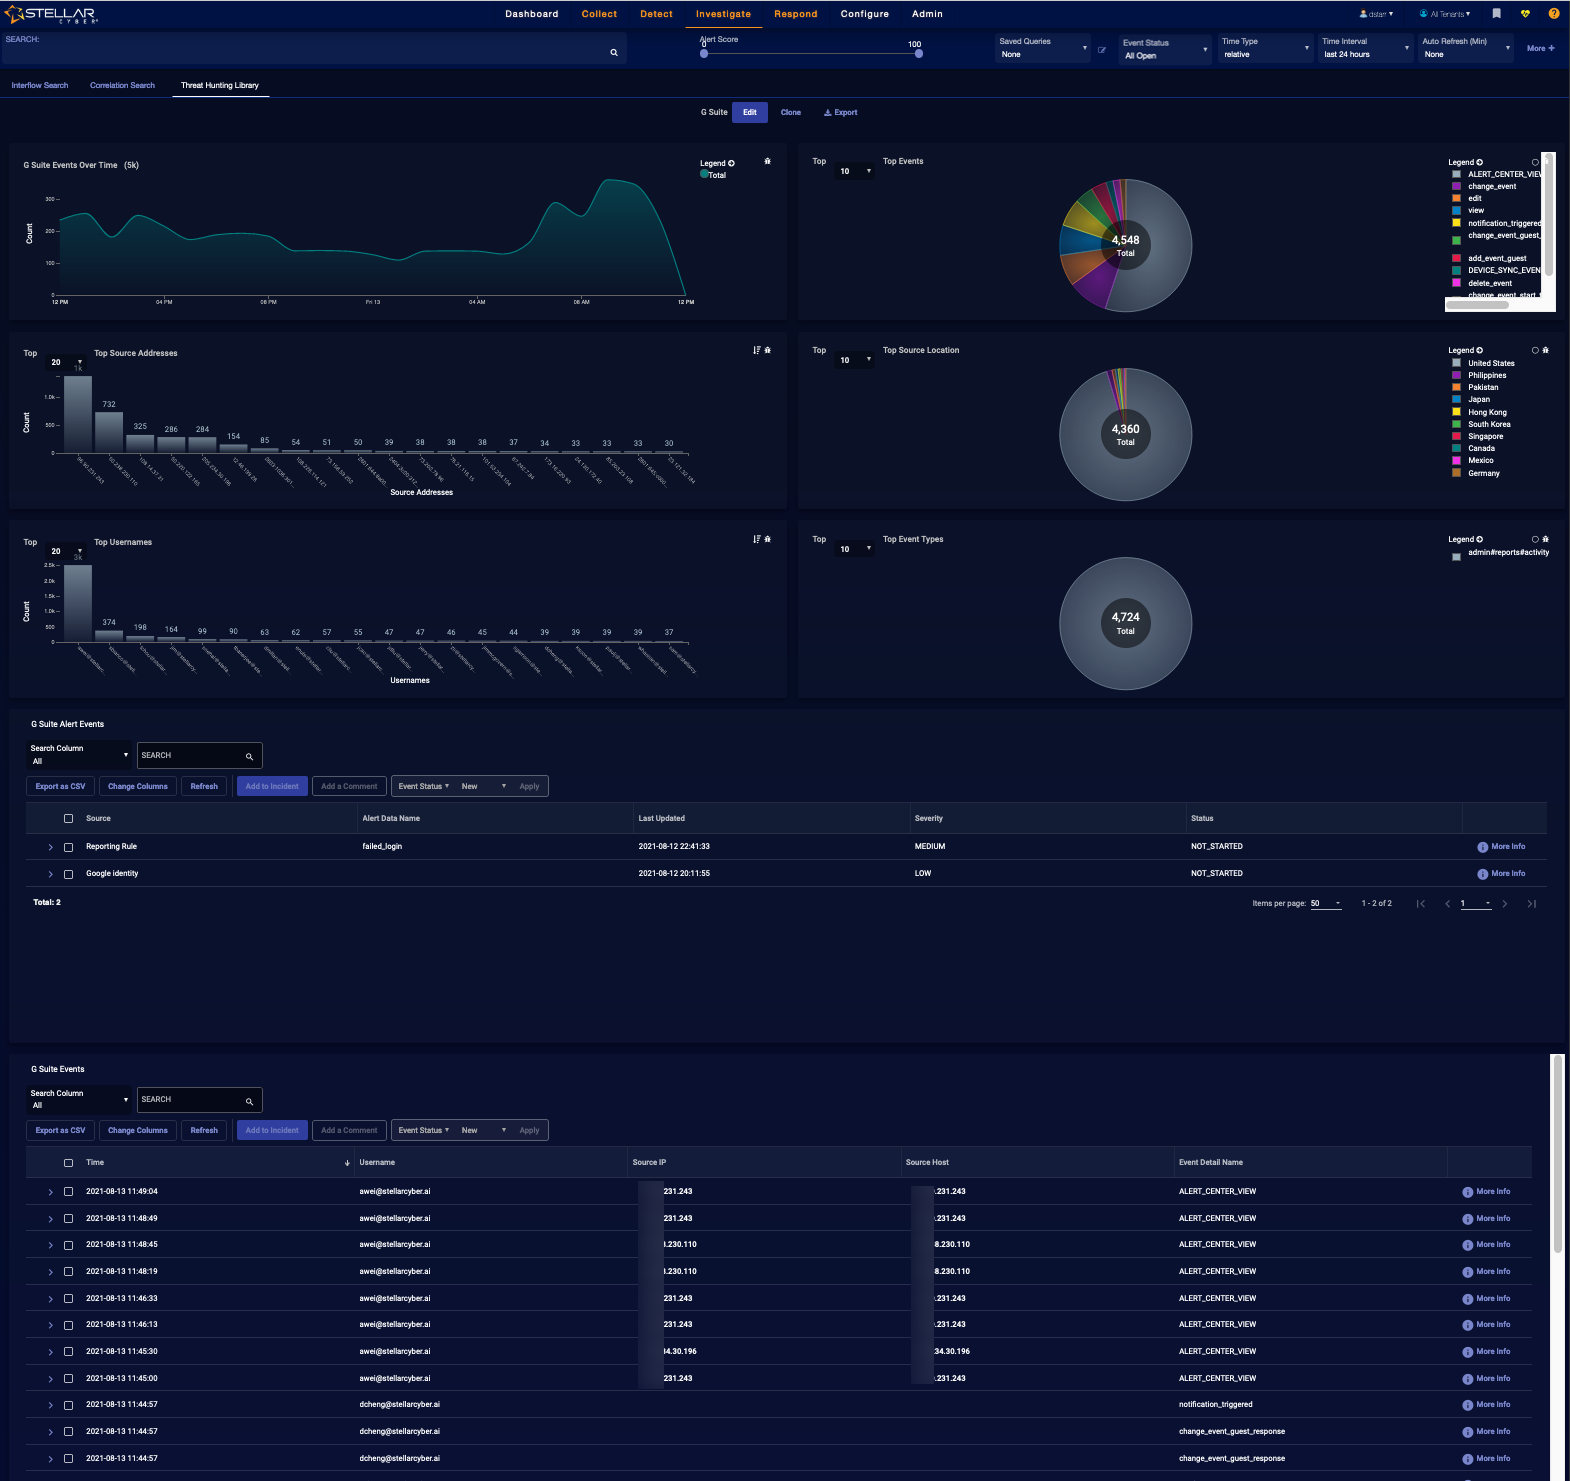
The top half of the Threat Hunting Library page starts with a description of the alert type selected and several actions you can perform on this dashboard:
-
Edit
-
Clone
-
Export
See the Dashboard Actions page for details on each action. The number and composition of each graphic and its associated table is dependent on the alert type. The following image has an example.
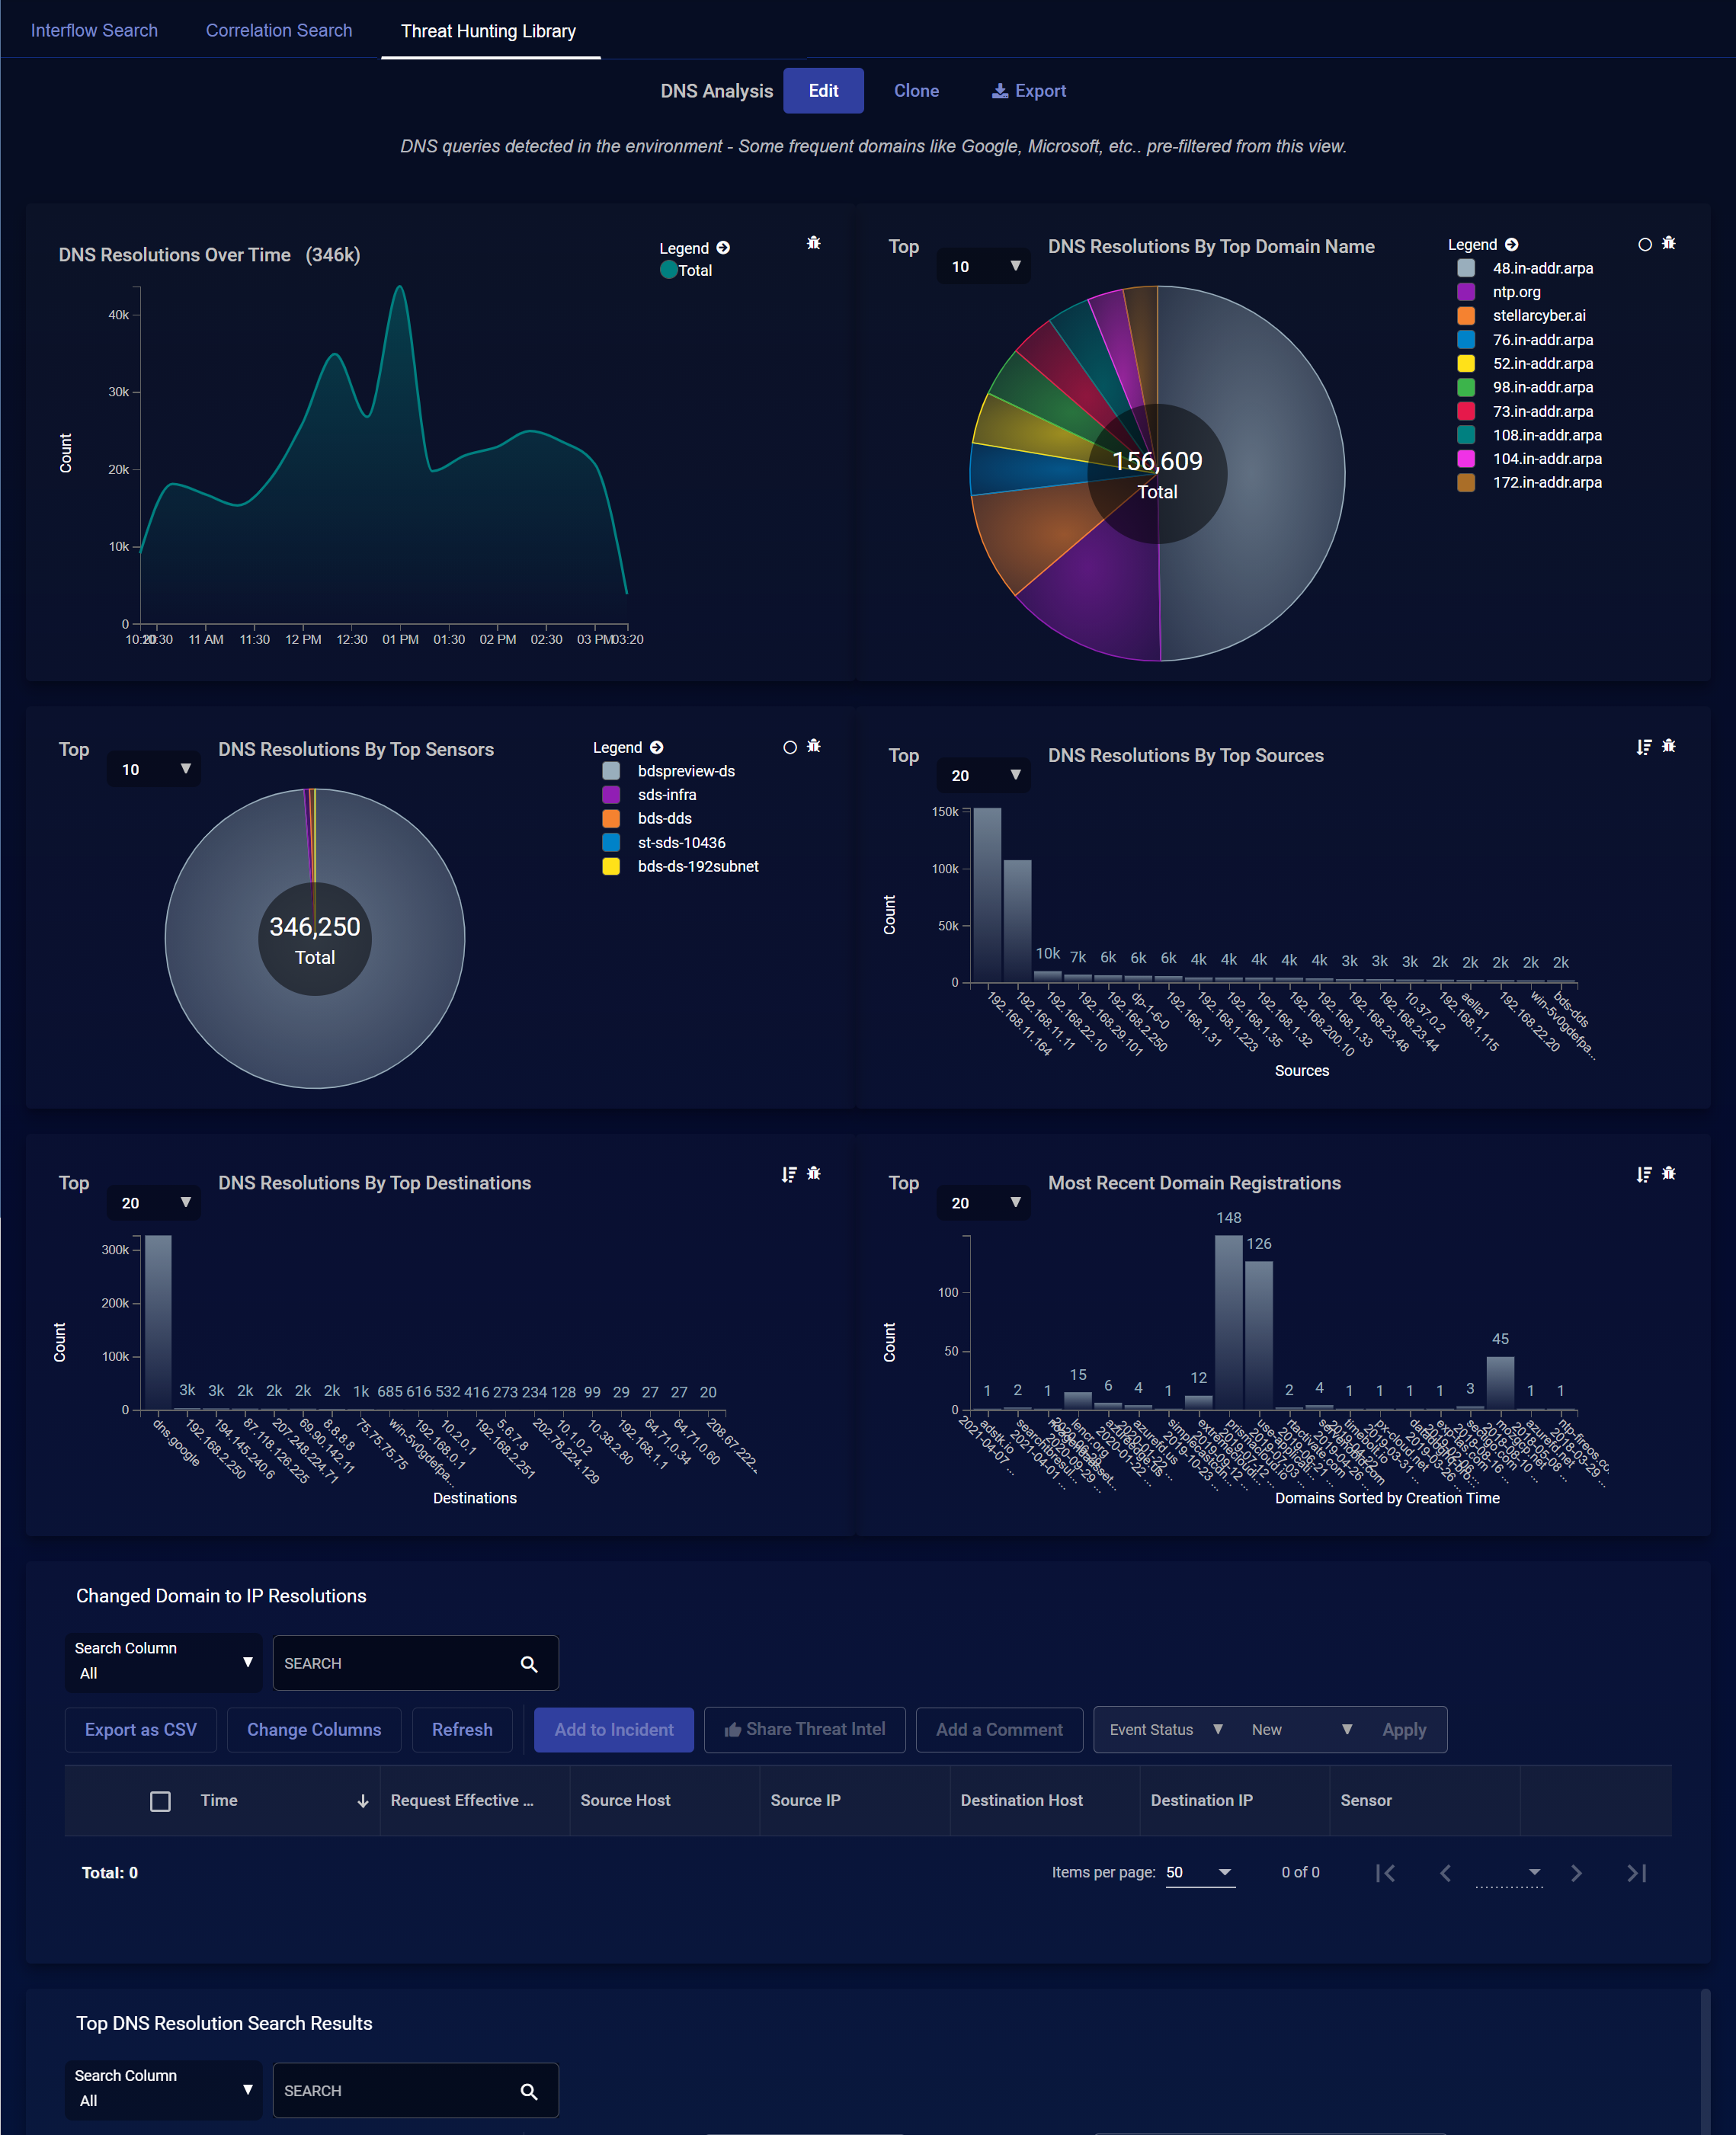
Below the charts, one or more data tables may be displayed. Again, the type of tables and their associated columns change depending on what is relevant to the event type. Example:
-
For DNS Analysis, the tables are Changed Domain to IP Resolutions, and Top DNS Resolution Search Results.
-
For Google Workspace (G Suite), the tables are G Suite Alert Events and G Suite Events.
Be sure to scroll the entire Threat Hunting page, to ensure you are seeing all offered information.
Each row provides an overview of each event. Click the checkboxes to the left of each row to select records. You can also assign security-related events to incidents or create a new incident based on one or more alerts.
Only security-related events can be added to incidents. The Add to Incident button is not available when a non-security event is selected.
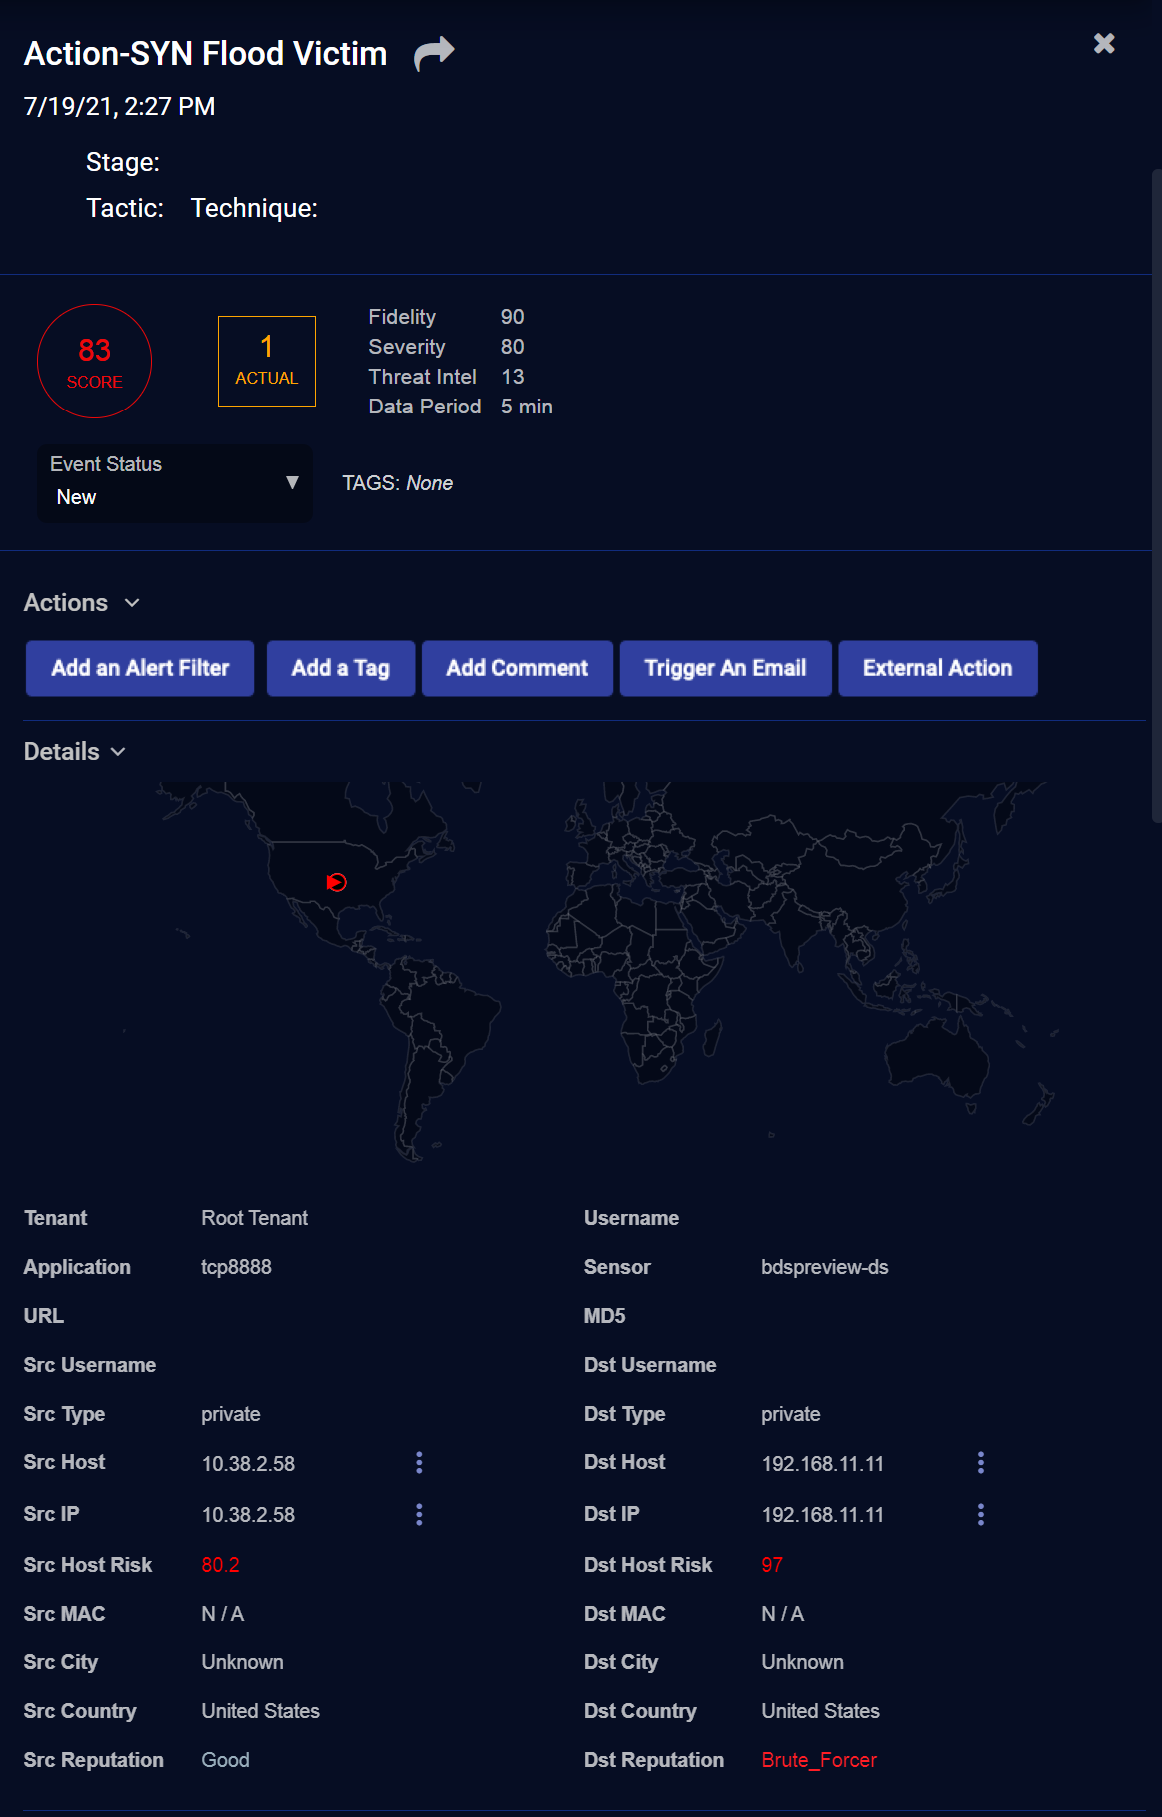
To see detail about an alert, click More Info at the far right of the record. The detail screen appears, which allows you to tag or comment the event, trigger an email, or take firewall action.
-
See the Event Display page for more information on working with events.
-
See the Tables page for more information on working with tables.
