Configuring Google Cloud Audit Log Connectors
Connectors allow Stellar Cyber to collect data from external sources and add it to the data lake.
Stellar Cyber connectors with the Collect function (collectors) may skip collecting some data when the ingestion volume is large, which potentially can lead to data loss. This can happen when the processing capacity of the collector is exceeded.
Connector Overview: Google Cloud Audit Log
Capabilities
-
Collect: Yes
-
Respond: No
-
Native Alerts Mapped: No
-
Runs on: DP
-
Interval: Configurable
Collected Data
|
Content Type |
Index |
Locating Records |
|---|---|---|
|
Admin Activity Data Access Policy Requests System Event |
Syslog |
Domain
N/A
Response Actions
N/A
Third Party Native Alert Integration Details
N/A
Required Credentials and Configurations
-
JSON Key File
-
To set up the service account for this configuration, the Google Cloud user must have the role of
serviceAccountKeyAdmin. -
The following privileges are assigned to the service account for the corresponding log access:
Logs ViewerandPrivate Logs Viewer(for the Data Access logs). -
Audit Logs for the service account must have Admin Read, Data Read, and Data Write enabled for the Kubernetes Engine API or for Google Cloud Storage.
-
Adding a Google Cloud Audit Log Connector
To add a Google Cloud Audit Log connector:
- Enable the Google Cloud Logging API
- Create a Google Cloud service account
- Create a JSON key
- Enable Kubernetes Log access
- Enable Google Cloud Storage access
- Add the connector in Stellar Cyber
- Test the connector
- Verify ingestion
Enabling the Google Cloud Logging API
To enable the Google Cloud Logging API, follow the guidance in the Google Cloud documentation to Enable the Logging API.
Creating a Google Service Account
With the API enabled, you can now create a service account.
To create a service account, follow the guidance in the Google Cloud documentation to Create a service account. For more information on roles, see the Google Cloud documentation for Access control with IAM.
Use our example as a guideline, as you might be using a different software version.
-
Navigate to the main menu of https://console.cloud.google.com.
-
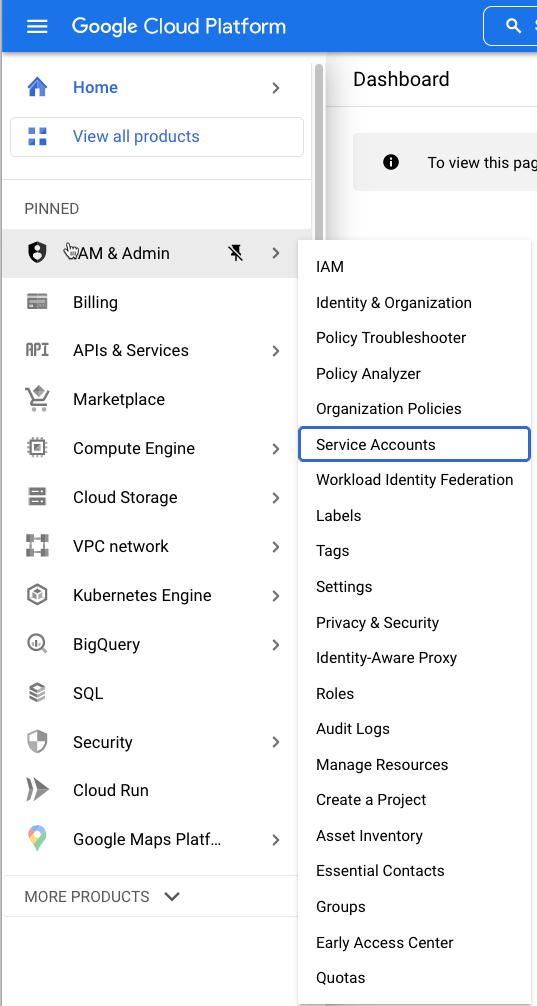
Click to display the navigation pane.
-
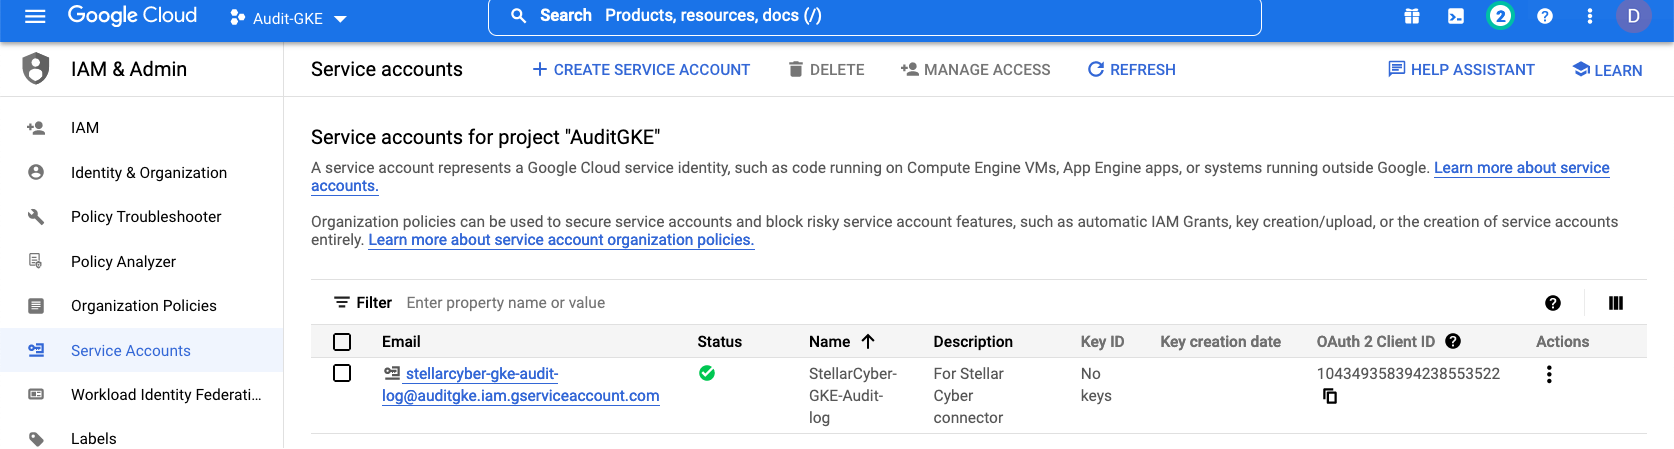
Choose IAM & Admin > Service Accounts. The service accounts pane for the active project displays.
-
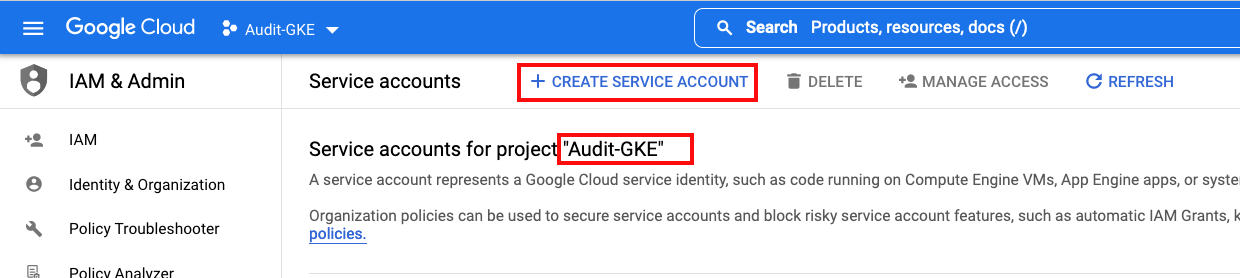
Select your project or verify that you are in your project, then click + Create Service Account.
-
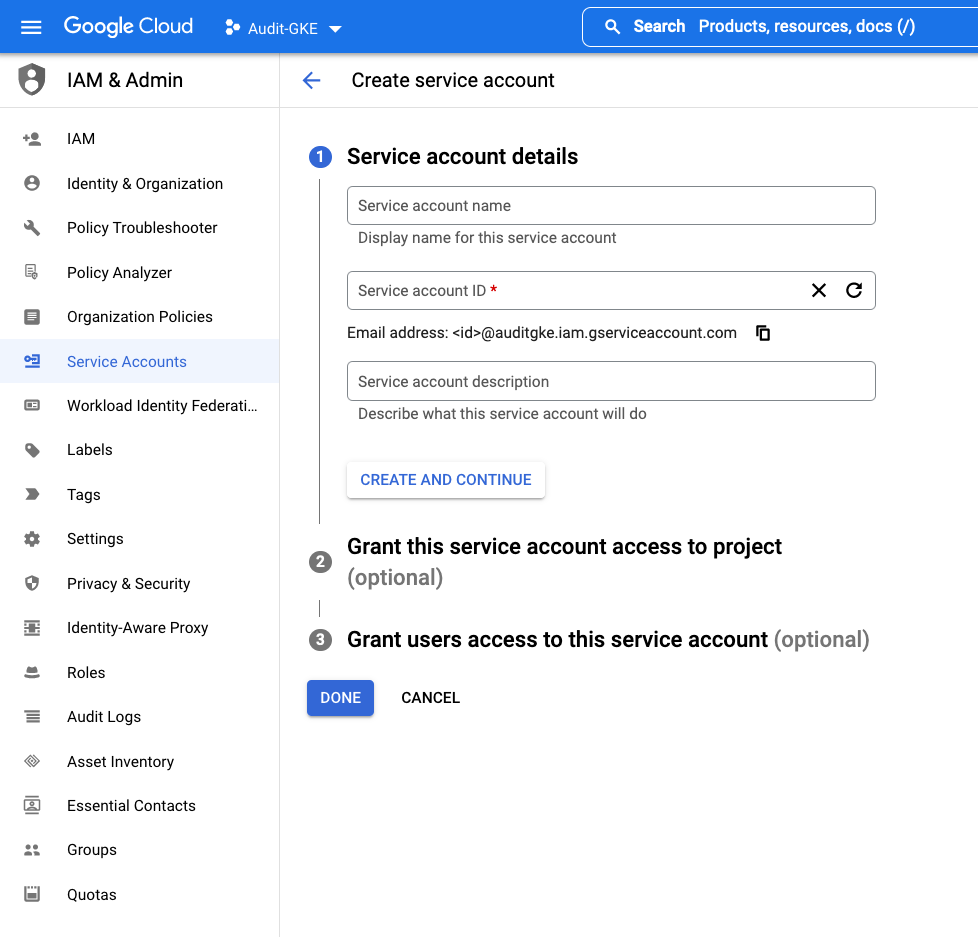
In the Service account details page, enter a Service Account Name in the first field. The Service account ID is automatically created based on the name you supplied.
-
Enter a description for this service account, to identify its association with your Stellar Cyber connector.
-
Click the Create and Continue button.
-
Bypass completing the remaining access control and permission steps, which will be configured in a later step.
-
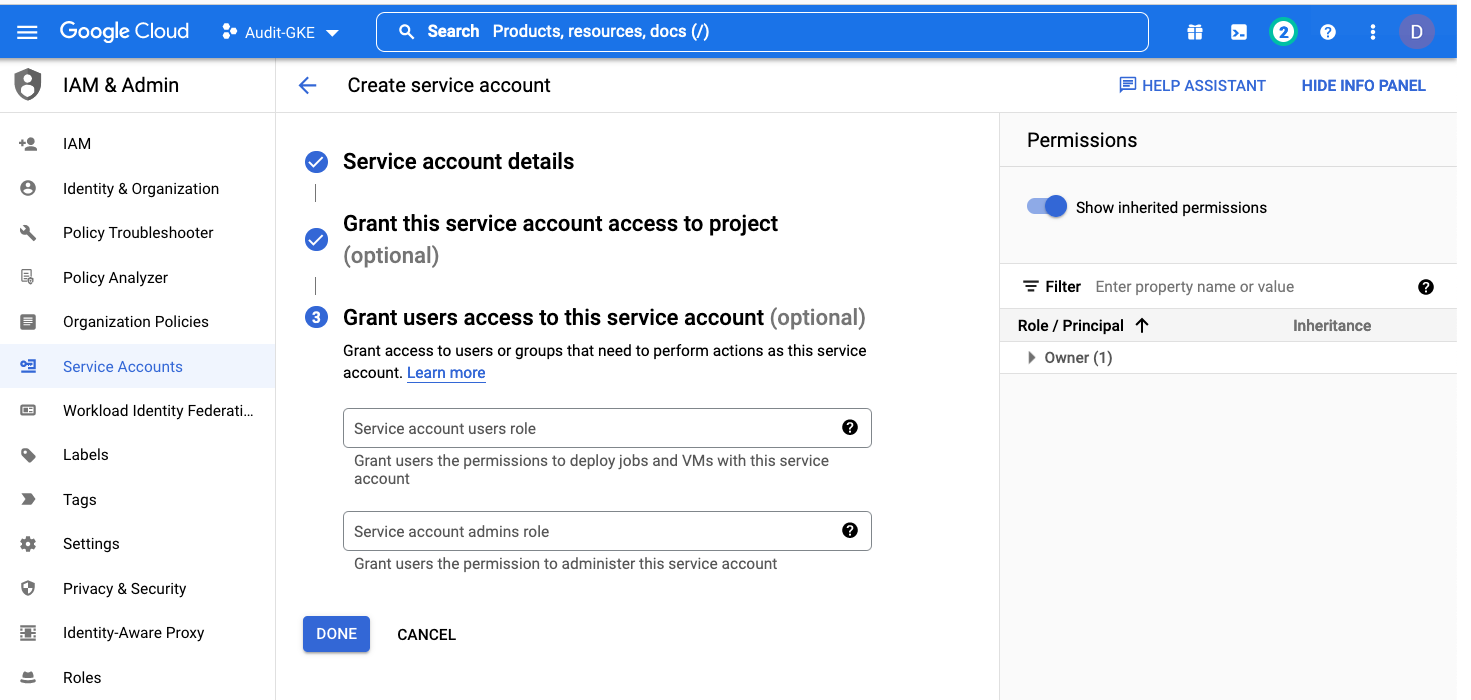
In the section for granting access to the project, do not specify any roles. Click Continue.
-
In the section for granting users access to the service account, do not specify any users. Click Done.
-
-
The new service account is created and displayed on the Service account details page.
-
Make note of the email address displayed for the service account.
-
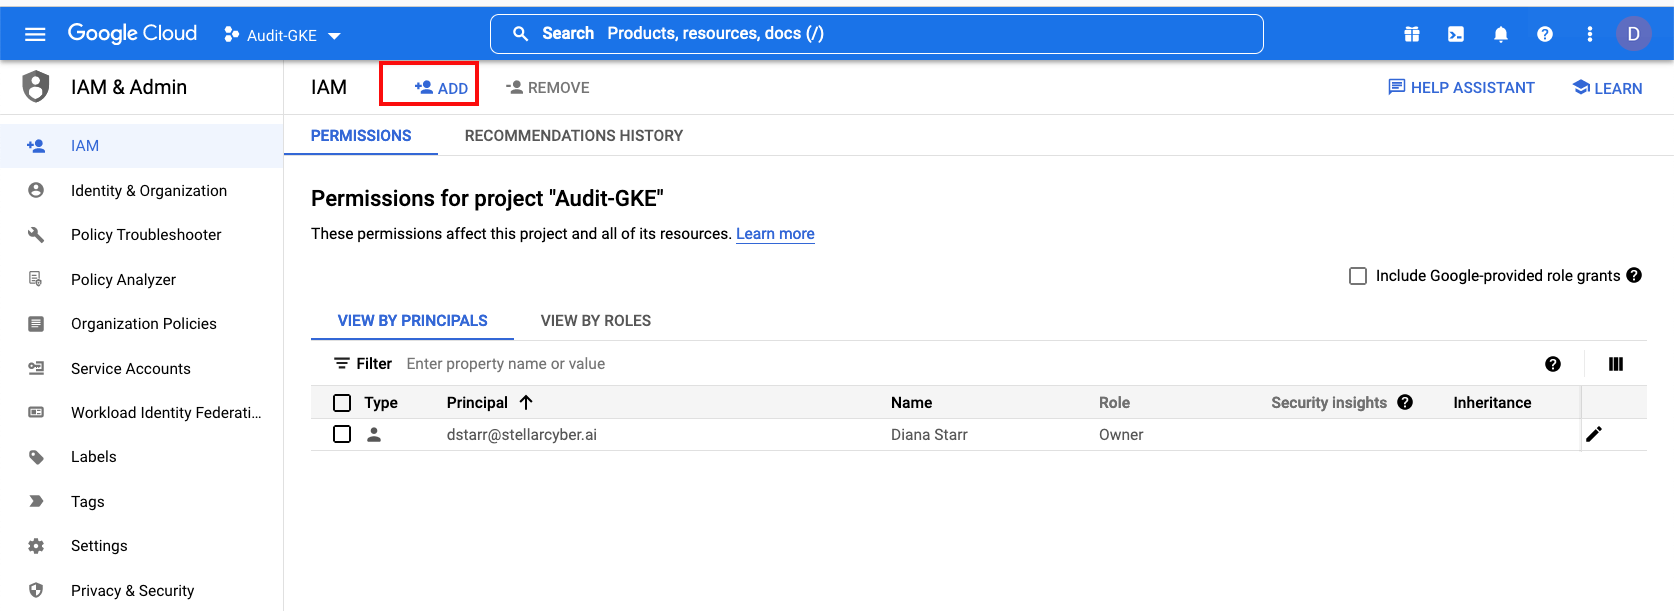
Now give permissions to the Service Account you created. From the IAM & Admin menu, select IAM.
-
Select the email address and click the Edit icon.
-
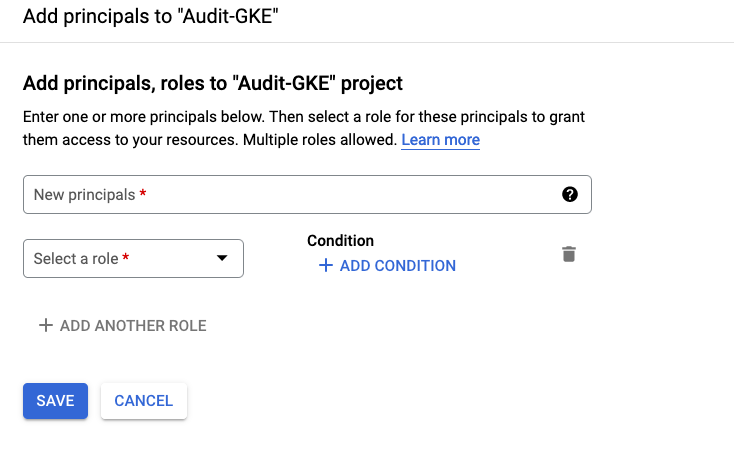
In the dialog that opens, click Add another role.
-
Search for Logs Viewer, and select that role.
This role gives read-only access to Admin Activity, Policy Denied, and System Event audit logs. If you have just this role, you cannot view Data Access audit logs.
-
Click Add Another Role.
-
Search for Private Logs Viewer, and select that role.
The Private Logs Viewer role includes the ability to read Data Access audit logs.
-
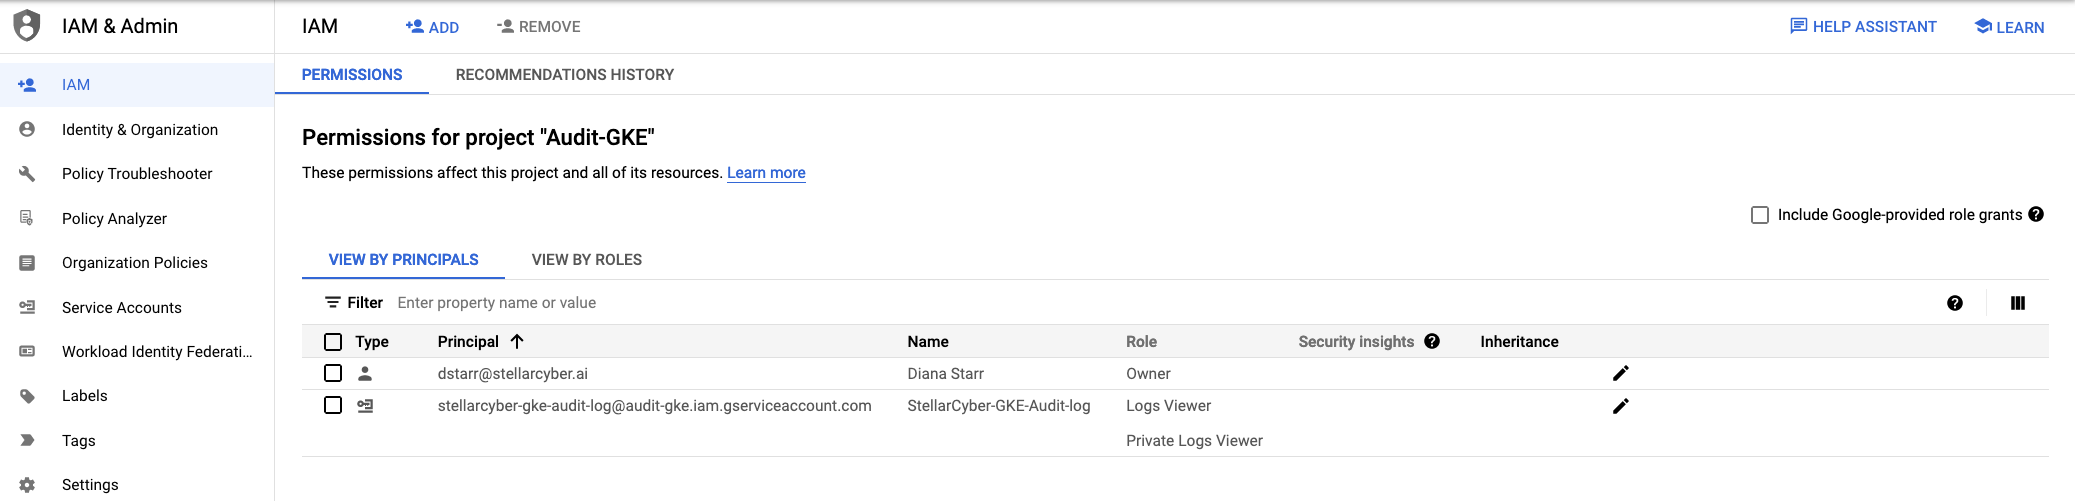
Click Save.
-
The permissions page now displays the service account with the needed permissions to collect logs.
Creating a Service Account Key
With a service account, you can now create a key file for uploading to Stellar Cyber.
To create a service account key, follow the guidance in the Google Cloud documentation to Create a service account key.
Use our example as a guideline, as you might be using a different software version.
-
Still within the IAM & Admin > Service Accounts page, select the service account you created. (Verify that you are in your project.)
-
Click in the actions column for that account and select Manage keys from the menu.
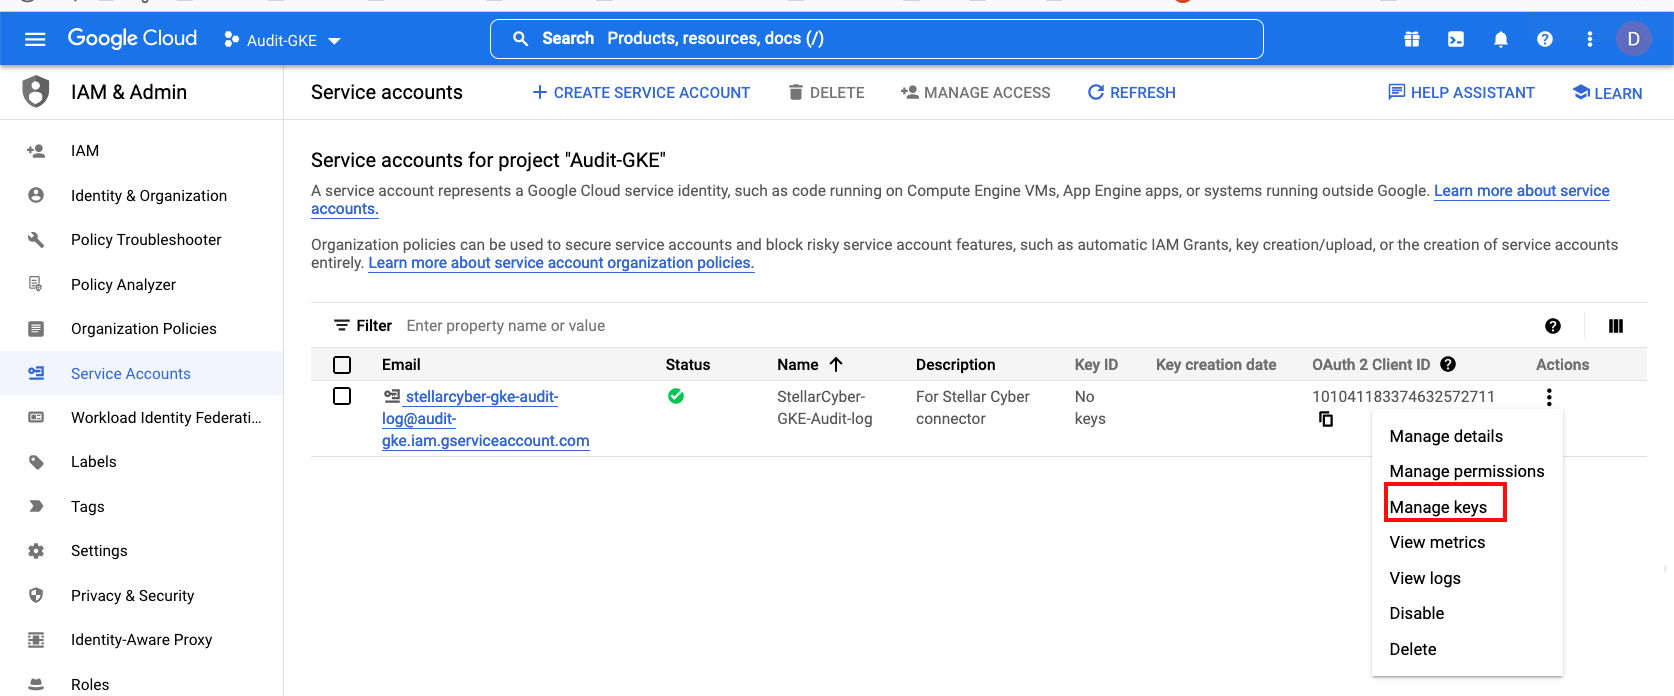
The Keys screen appears.
-
Click the Add Key menu and select Create new key.
-
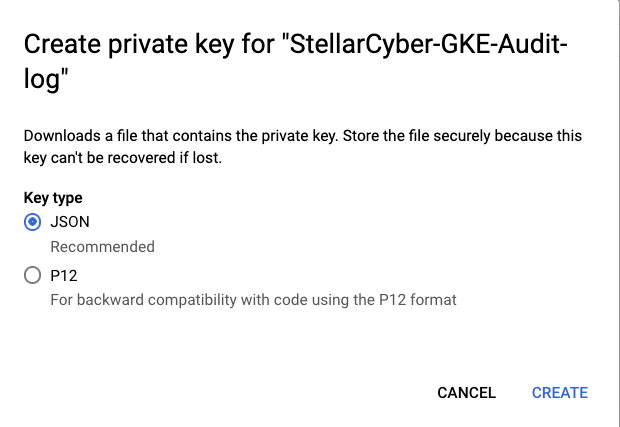
When the dialog displays a dialog Create private key, select JSON.
-
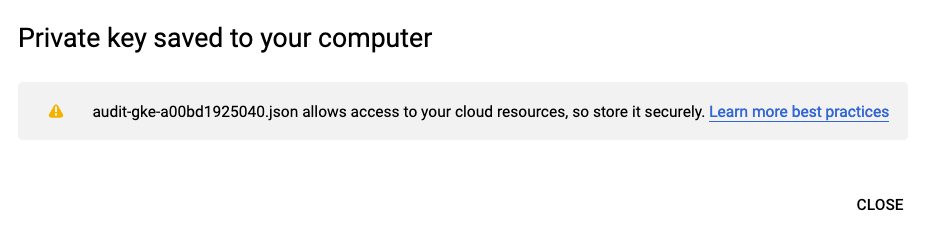
Click Create. The JSON file is downloaded. Keep this file safe, as you cannot recover the key if this file is lost. You will upload this file to Stellar Cyber when configuring the connector.
-
Click Close.
Your key file contains information similar to below, which is used by the Stellar Cyber connector.
Google Cloud Audit Logs JSON Key file
type    "service_account"
project_id    "audit-gke"
private_key_id    "a00bd1925040fcf0ed46e886c3475f7d149ee2ca"
private_key    "-----BEGIN PRIVATE KEY-----\nMIIEvAIBADANBgk .... clipped out ....EFAASCBKYwggSiAgEAAoIBAQDKFRmHwoCYw8YT\nJuVvwbQJKvtwYXA9ADG0ob9pfVuIB036zttxtjwZi1JKLx/8GEOwx/hdn9hrQvuA\nnGVQRUMMMAUaWZAy0GMTSYH1BUS1dv9KHsCXcprAE2z2Bg+6vkoy16X1h9Rxt5p4\niPf0to8zdUQs1DLr9+C9rxpNDexXizgMMDj2J10qpqI6nGedtAigr+ZPCBoP9Byw\nG3pxakYZx25OzW7lEWr2NBL3nDzivbIqLyW63xvQSywpbuR0IU8tKGhAKSNSnxq8\nrCxqBcvQcvbpvbniNbYMNPuRxfYaFYdeNxga9My0SfwkIY3604y5FNud5+w0kqEY\n2ysGs7ThAgMBAAECggEAAdBsHXh78b8kbxuk0La+nVxUg/gKd0A6KgHPmXB+wNUm\ntHgs3ve+sPCj2ELVetSLj0XAzXOd4GriTc+NnumTxDtGQPQF0fh2Irw4u4q4yOei\ny6M0ebmVkUDNZCUmWQ/8M9oU8TwPJpcSNte9MN4ekYzZfAzqwPy9eKt2uSNNVFT5\nbAiGuWcn3P4EOVeHFjQ0rXn8N6xqg4dtNcJfX1cGvUv3tkwH4Nv+WrO3I0yI7SyF\noV7906wY0M//iuenViUZdJ6+mF6R027DxxUaEF7BE9iwkaOrcGICNJb9oL9xRx8f\nKhpMlxlhg5MAe58/8eBqatz5Oh84bsbAzT59/haygQKBgQD9cfiIYWP22uMLzPgs\n6O4rLjApqdkrWlcbuDGQjCw12LwURQstQ8zSLI7JdTH5l0tWgHNYDcsBNeOLCND8\nltvzD2v9RlyziQqu0yoXScZ0oKE/eTzmnHV8qeEpCGMBrcdu7UMO01/YAITfcbEE\n0EGwKsn50hD+CR2OSLwBpEDKgQKBgQDMHpWeM24mYTib1W4yXYNNbMWEM3M/ETtg\n6byFtj06CNnaXWnnt3zTHg5GaqO1mX3Wgi4Lhx7L+yZ+Ew5qRTX6Z3u8cXPp4Niv\nQk+4wb4NGso75idYzd74cMAnccOmJEE+ZybVh/AQcnDS1f2wgNMxIh4Ubruyrp6U\ncGdJ3+X6YQKBgHHC+6Tz2jQO8kT0vx0hfO6C7/lzlNhh16HInu7cDGgrHdkXWLn7\nqe9ZMsp4wXLgF1//jkajAlFLyBQ7Y9tNN/M1I+ru72NjCxmIDWegpOTqyRY9rDlz\nV0Ua18dcTVyOjWtcMnJwLKA/M2U8mhGoDSQvQLPTN+9fVhXszf8KpE6BAoGAO8mJ\nkXkG/n7jkeGGEYKKfxcpE3vueb6WYeCUs6WZcXI+PVO3PYPlMAFRtRZvNTXsQfSH\ngCDnyF+b+rmiM0ZqdRnyiFPC2/JcBZmquDcnb7c1HS5gwAYtFSARaHxODk/4PEsC\nePEERA0BNwAu+pABTBbuMJXurHuxP1FdL6pBNoECgYASvtL0kAMQcdCYV+qiMSND\nftuiacthYJ3WjpYSCan2xQV18WSX2nsD3206x8oKwC/FguHA9AsFw97PGdVtPUXb\nMrtBCz84cN+j9NPcDV/R1OTKTOHUljONwdNy0ewa6BErWOLAlmZ3Qcn8gmbixPJM\nqNKEDlQFULGuPDazrsJ7/A==\n-----END PRIVATE KEY-----\n"
client_email    "stellarcyber-gke-audit-log@audit-gke.iam.gserviceaccount.com"
client_id    "101041183374632572711"
auth_uri    "https://accounts.google.com/o/oauth2/auth"
token_uri    "https://oauth2.googleapis.com/token"
auth_provider_x509_cert_url    "https://www.googleapis.com/oauth2/v1/certs"
client_x509_cert_url    "https://www.googleapis.com/robot/v1/metadata/x509/stellarcyber-gke-audit-log%40audit-gke.iam.gserviceaccount.com"
Enabling Kubernetes Log Access
To enable access to the logs:
-
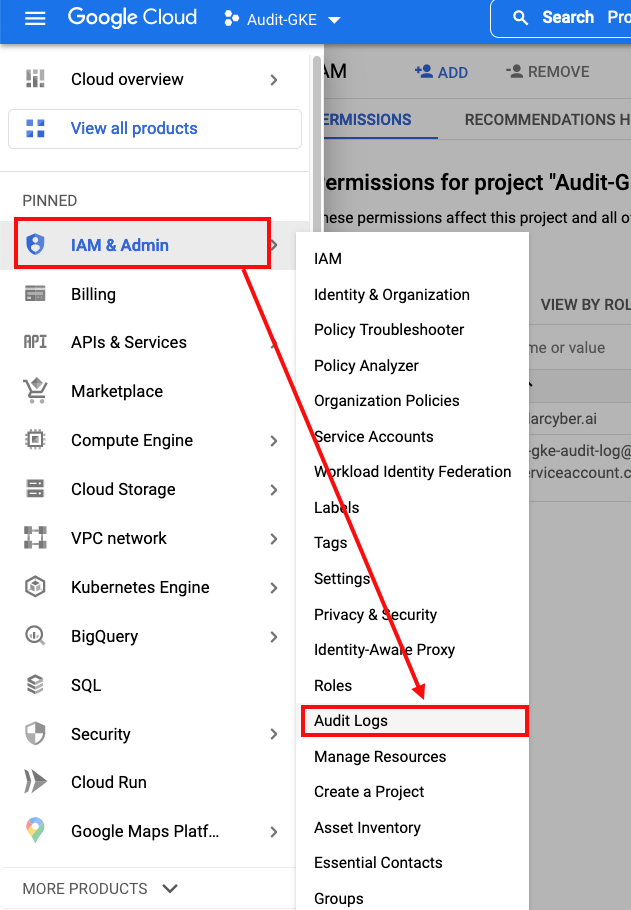
Return to the IAM & Admin menu.
-
Select the Audit Logs sub-menu.
-
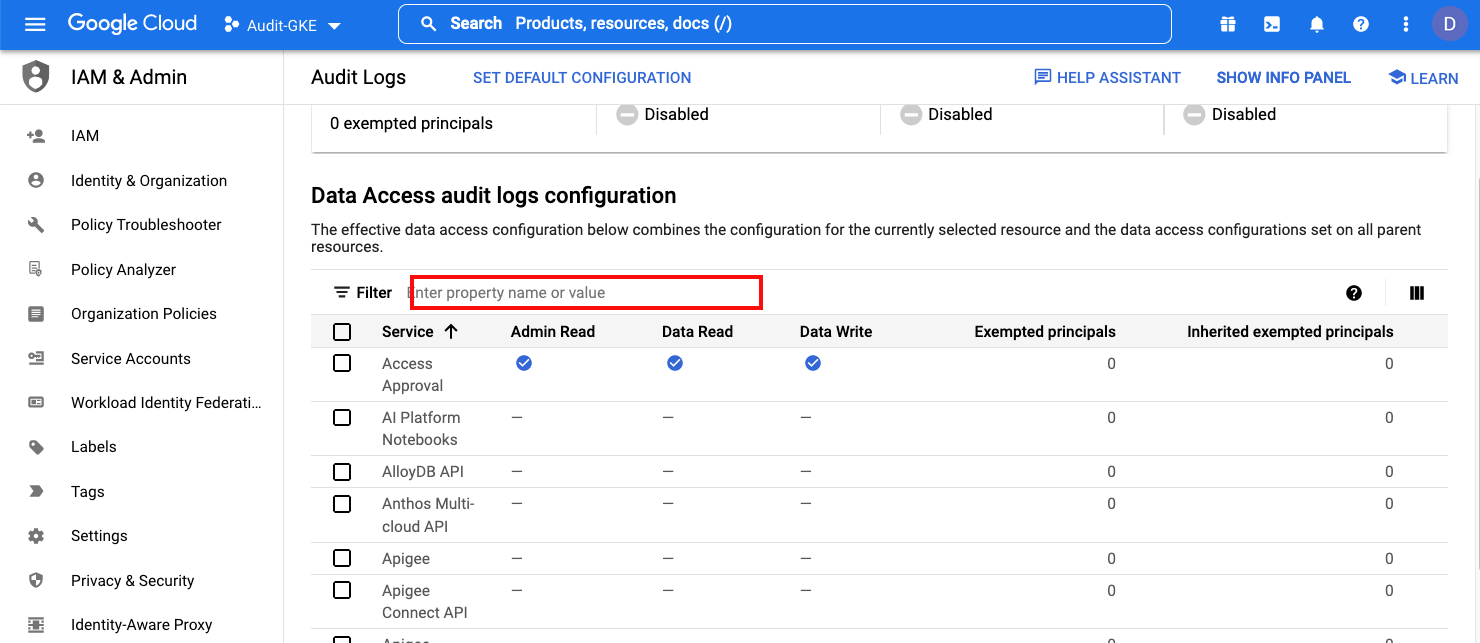
In the page that displays, locate the Filter field (Enter property name or value) for Data Access audit logs configuration.
-
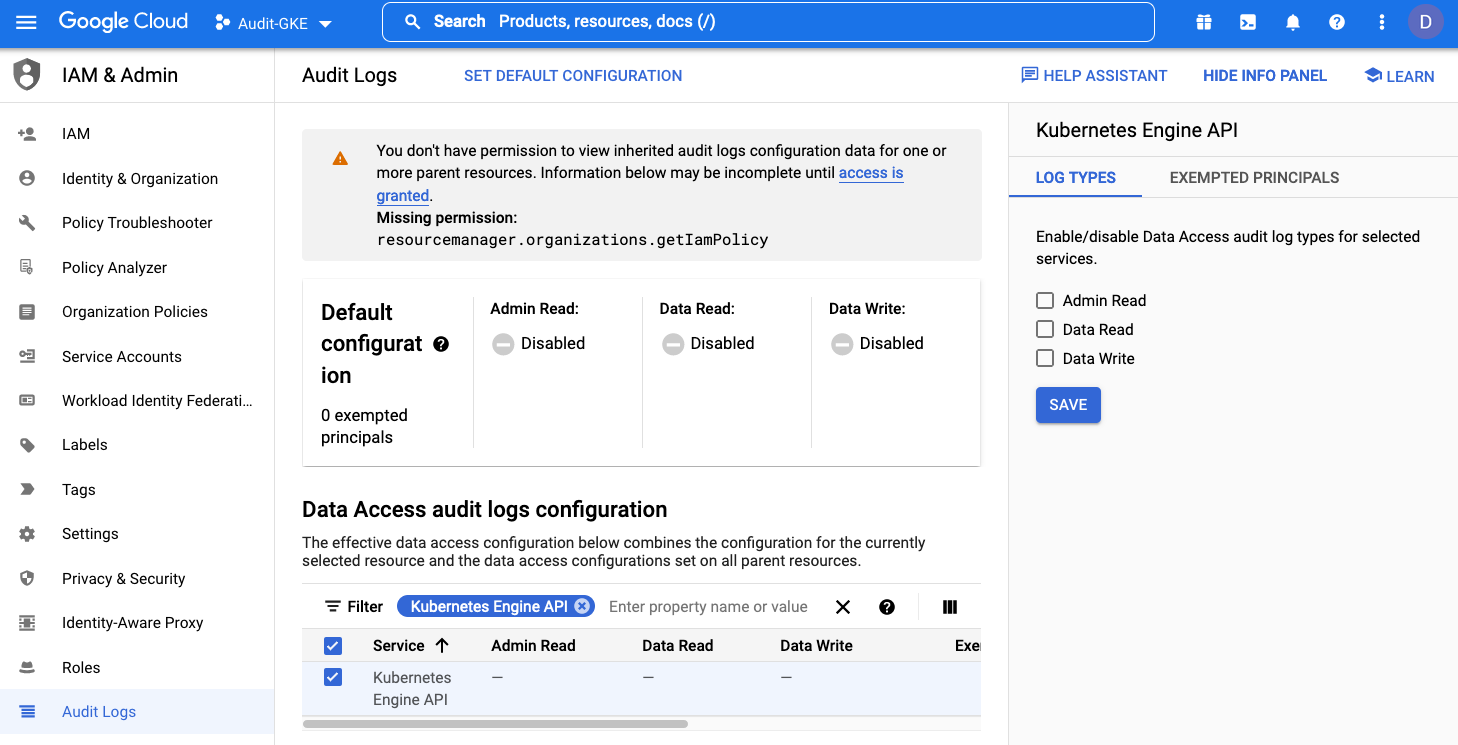
Search for Kubernetes and then select Kubernetes Engine API to the left of the Service label.
-
Enable permissions for Admin Read, Data Read, and Data Write.
-
Click Save.
Enabling Google Cloud Storage Access
To enable access to the logs:
-
Return to the IAM & Admin menu.
-
Select the Audit Logs sub-menu.
-
In the page that displays, locate the Filter field (Enter property name or value) for Data Access audit logs configuration.
-
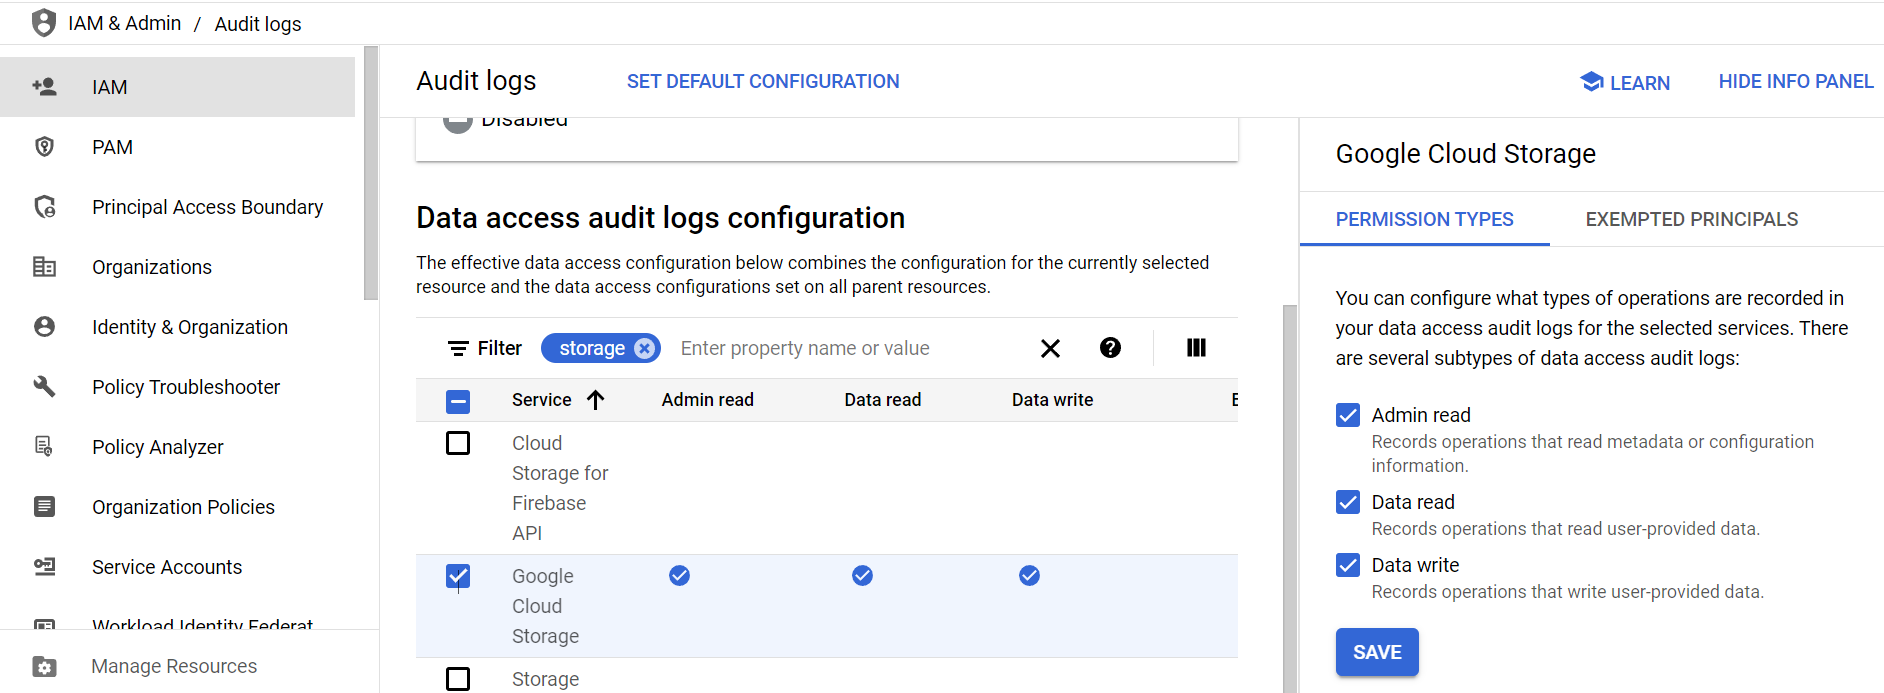
Search for storage and then select Google Cloud Storage to the left of the Service label.
-
Enable permissions for Admin Read, Data Read, and Data Write.
-
Click Save.
-
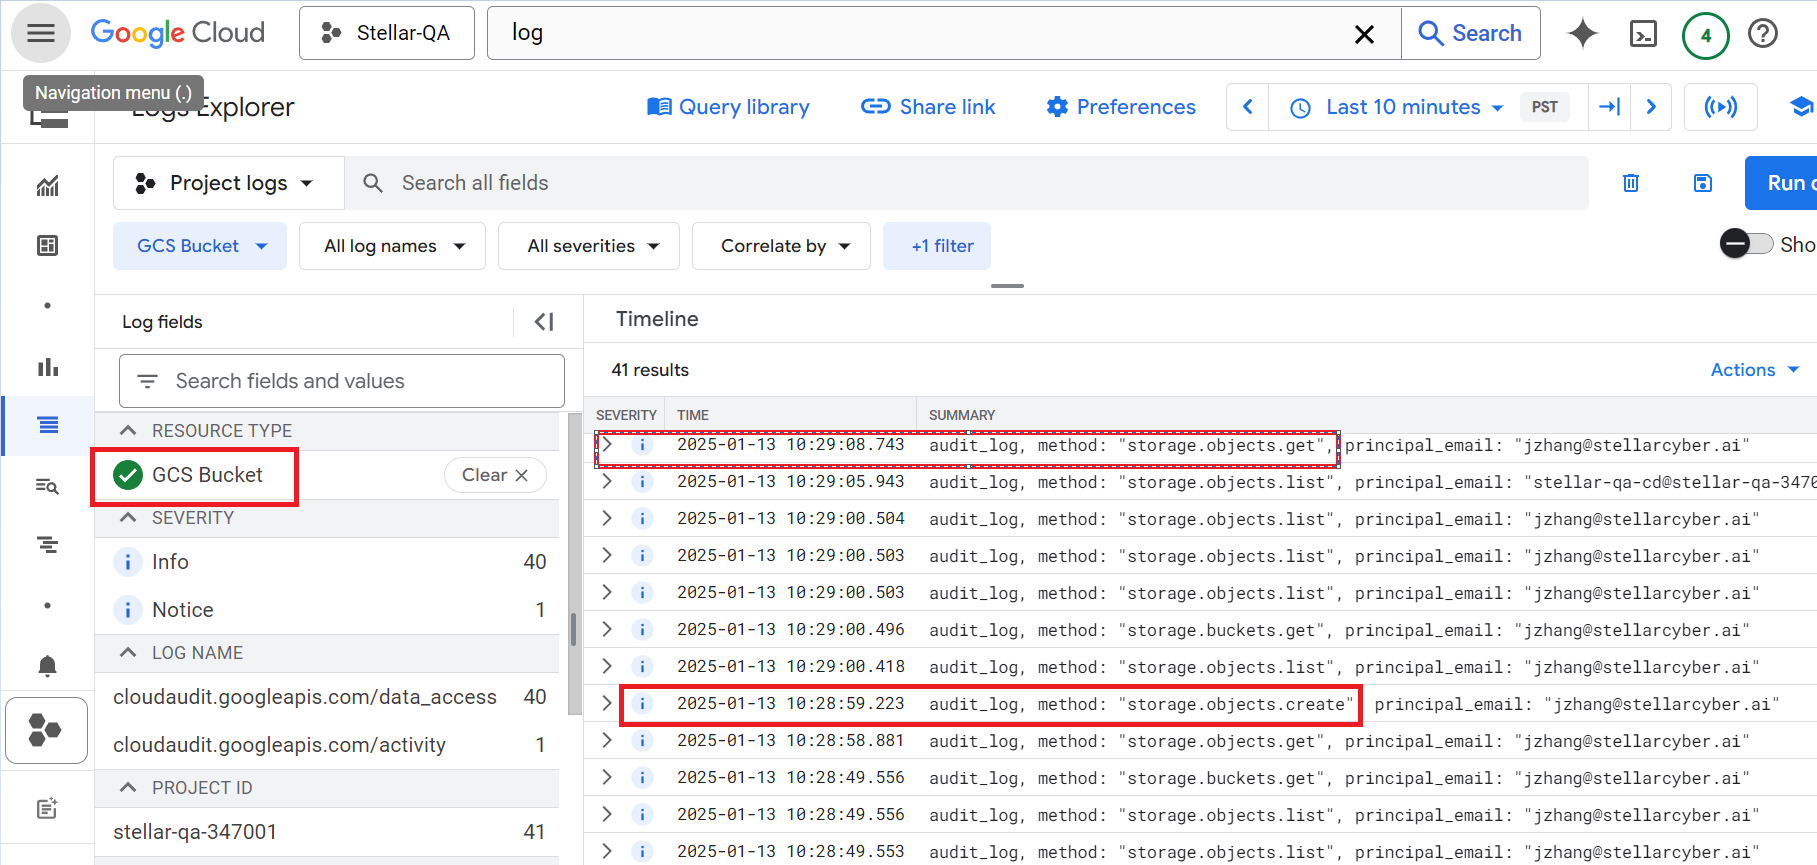
Navigate to the Logs Explorer and click GCS Bucket to view the bucket logs.
Adding the Connector in Stellar Cyber
With the Google service account set up and the API key ready, you can add the Google Cloud Audit Log connector in Stellar Cyber:
-
Log in to Stellar Cyber.
-
Click System | INTEGRATIONS | Connectors. The Connector Overview appears.
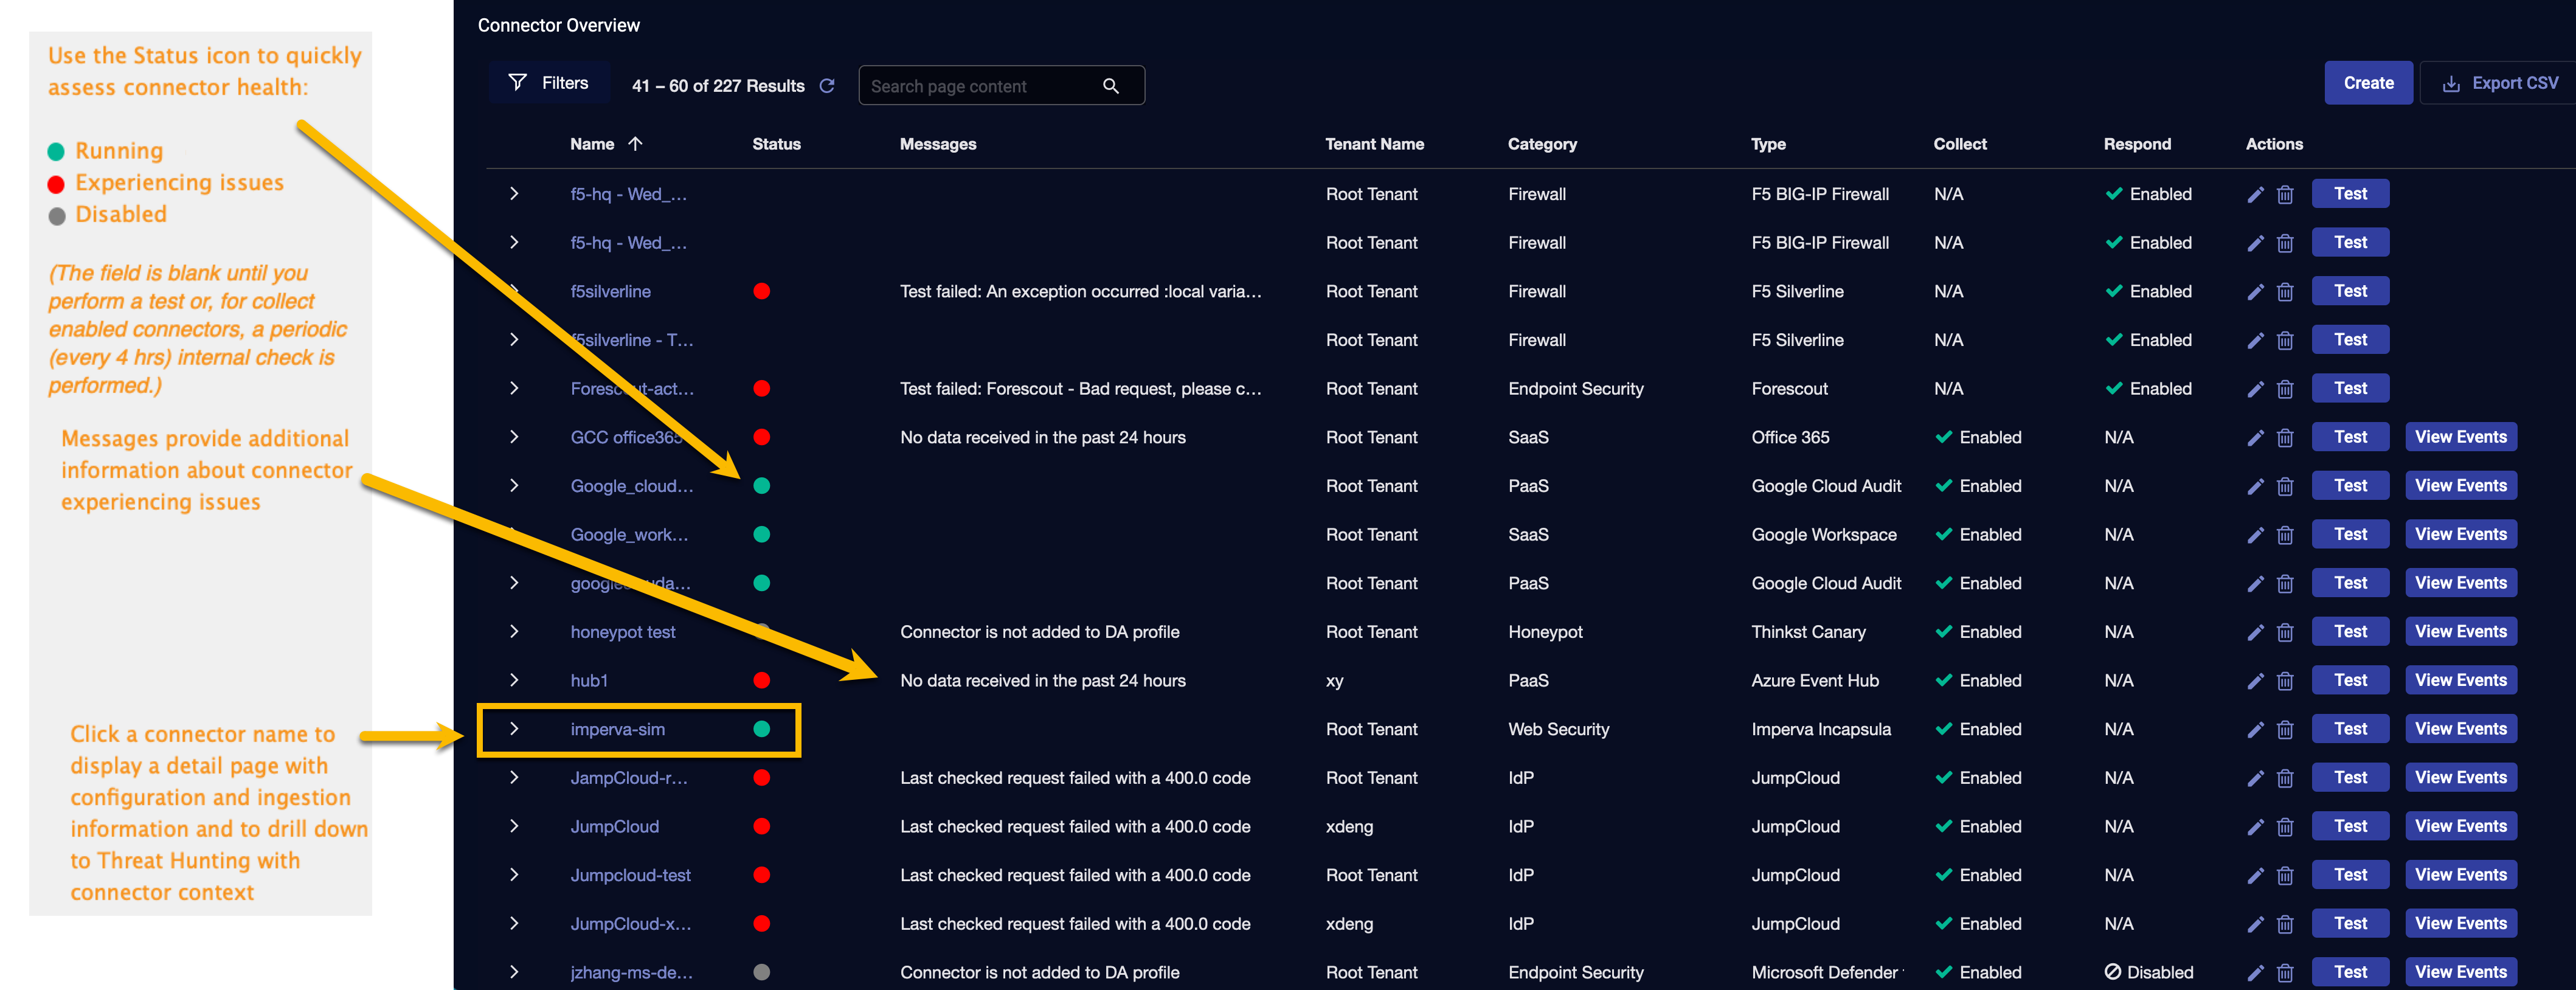
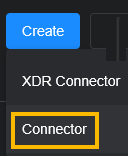
-
Click Create and select Connector.
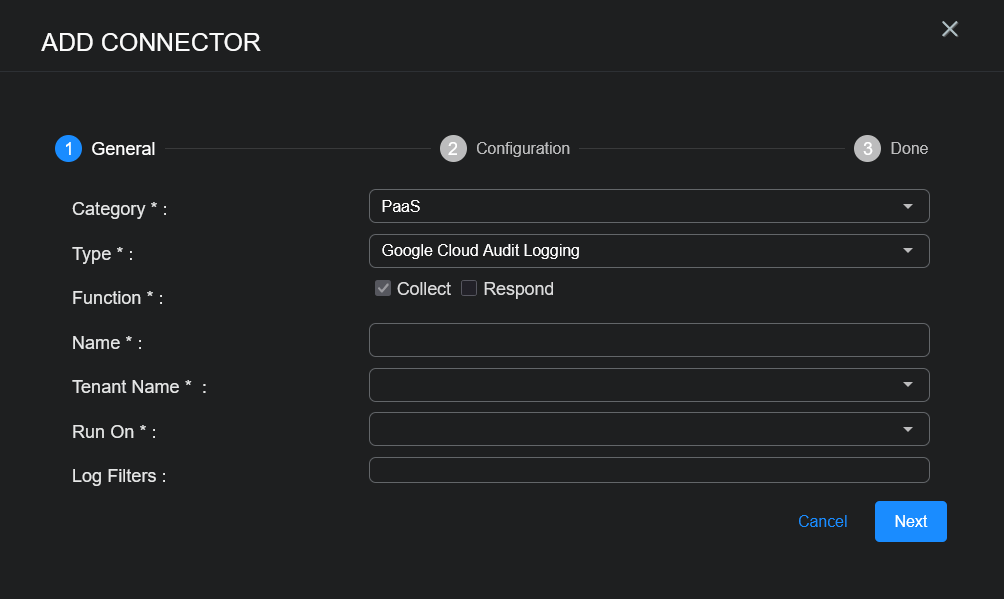
The General tab of the Add Connector screen appears. The information on this tab cannot be changed after you add the connector.
-
Choose PaaS from the Category dropdown.
-
Choose Google Cloud Audit Logging from the Type dropdown.
The asterisk (*) indicates a required field.
-
For this connector, the supported Function is Collect, which is enabled already.
-
Enter a Name.
Notes:- This field does not accept multibyte characters.
- It is recommended that you follow a naming convention such as tenantname-connectortype.
-
Choose a Tenant Name. This is the tenant allowed to use the connector.
-
Choose the device on which to run the connector.
-
(Optional) When the Function is Collect, you can apply Log Filters. For information, see Managing Log Filters.
-
Click Next. The Configuration tab appears.
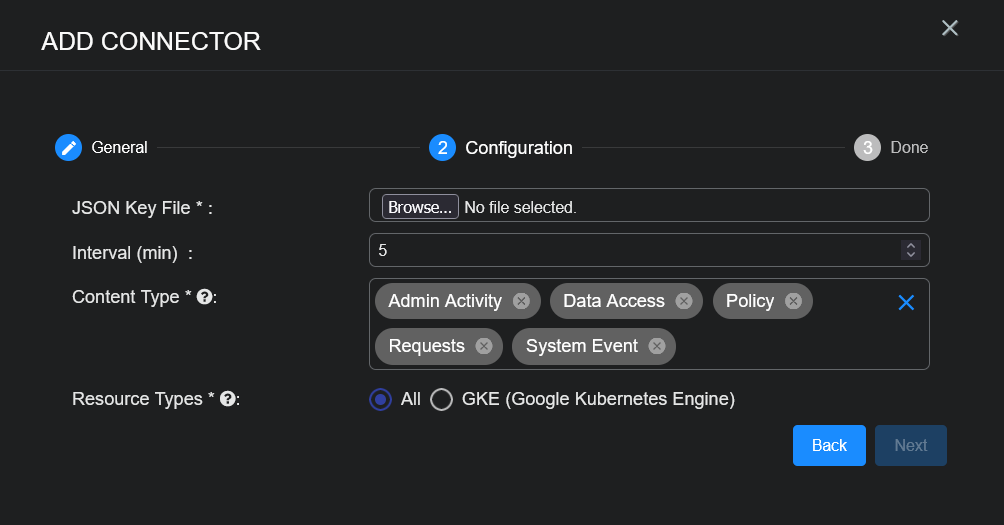
The asterisk (*) indicates a required field.
-
Upload the JSON Key File you created above.
-
Choose the Interval (min). This is how often the logs are collected.
-
Choose the Content Type you want to collect. The following logs are supported:
-
Admin Activity
-
Data Access
-
Policy
-
Requests
-
System Event
The Google API requires that the content type you specify here be a type for which you have viewed logs at least once in the corresponding account.
-
-
Toggle whether you want to collect All data (default) for the content type or just the GKE (Google Kubernetes Engine) logs.
-
Click Next. The final confirmation tab appears.
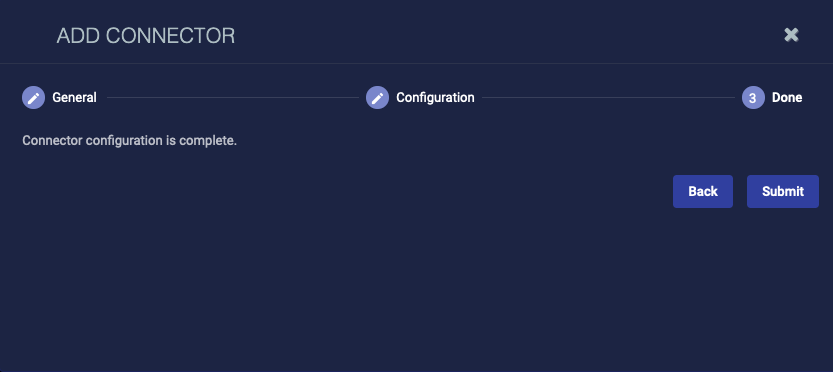
-
Click Submit.
The new connector is immediately active.
Testing the Connector
When you add (or edit) a connector, we recommend that you run a test to validate the connectivity parameters you entered. (The test validates authentication and connectivity).
For connectors running on a sensor, Stellar Cyber recommends that you allow 30-60 seconds for new or modified configuration details to be propagated to the sensor before performing a test.
-
Click System | INTEGRATIONS | Connectors. The Connector Overview appears.
-
Locate the connector by name that you added, or modified, or that you want to test.
-
Click Test at the right side of that row. The test runs immediately.
Note that you may run only one test at a time.
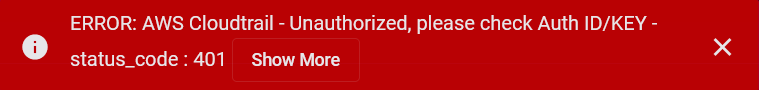
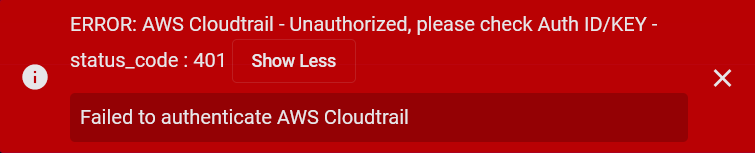
Stellar Cyber conducts a basic connectivity test for the connector and reports a success or failure result. A successful test indicates that you entered all of the connector information correctly.
To aid troubleshooting your connector, the dialog remains open until you explicitly close it by using the X button. If the test fails, you can select the button from the same row to review and correct issues.
The connector status is updated every five (5) minutes. A successful test clears the connector status, but if issues persist, the status reverts to failed after a minute.
Repeat the test as needed.

If the test fails, the common HTTP status error codes are as follows:
| HTTP Error Code | HTTP Standard Error Name | Explanation | Recommendation |
|---|---|---|---|
| 400 | Bad Request | This error occurs when there is an error in the connector configuration. |
Did you configure the connector correctly? |
| 401 | Unauthorized |
This error occurs when an authentication credential is invalid or when a user does not have sufficient privileges to access a specific API. |
Did you enter your credentials correctly? Are your credentials expired? Are your credentials entitled or licensed for that specific resource? |
| 403 | Forbidden | This error occurs when the permission or scope is not correct in a valid credential. |
Did you enter your credentials correctly? Do you have the required role or permissions for that credential? |
| 404 | Not Found | This error occurs when a URL path does not resolve to an entity. | Did you enter your API URL correctly? |
| 429 | Too Many Requests |
This error occurs when the API server receives too much traffic or if a user’s license or entitlement quota is exceeded. |
The server or user license/quota will eventually recover. The connector will periodically retry the query. If this occurs unexpectedly or too often, work with your API provider to investigate the server limits, user licensing, or quotas. |
For a full list of codes, refer to HTTP response status codes.
The Google API requires that the content type you specify here be a type for which you have viewed logs at least once in the corresponding account. If you run the test for a content type that has not been viewed, the test will result in an error.
Verifying Ingestion
To verify ingestion:
-
Select Threat Hunting.
The Interflow Search tab appears.
-
Change the Indices to Syslog.
The table immediately updates to show ingested Interflow records.
