Configuring OneLogin Connectors
Connectors allow Stellar Cyber to collect data from external sources and add it to the data lake. This topic describes the OneLogin connector. The OneLogin connector allows you to ingest user and event data.
Connector Overview: OneLogin
Capabilities
-
Collect: Yes
-
Respond: No
-
Native Alerts Mapped: No
-
Runs on: DP
-
Interval: Configurable
Collected Data
|
Content Type |
Index |
Locating Records |
|---|---|---|
|
Events Users |
Syslog Traffic |
Domain
|
https://<API Domain> where <API Domain> is a variable from the configuration of this connector |
Response Actions
N/A
Third Party Native Alert Integration Details
N/A
Required Credentials
-
Client ID and Client Secret
Let us know if you find the above overview useful.
Adding a OneLogin Connector
To add a OneLogin connector:
- Create the OneLogin API token to use in Stellar Cyber
- Add the connector in Stellar Cyber
- Test the connector
- Verify ingestion
Creating the OneLogin API Token
To create the OneLogin API token you'll use to configure the connector:
-
Log in to your OneLogin as an account owner or an account with administrative privileges.
-
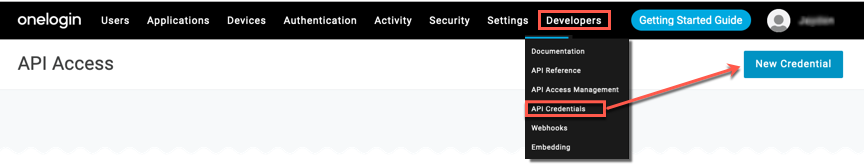
Navigate to Developers > API Credentials.
-
On the API Access Page, click New Credential.

-
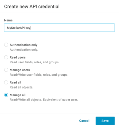
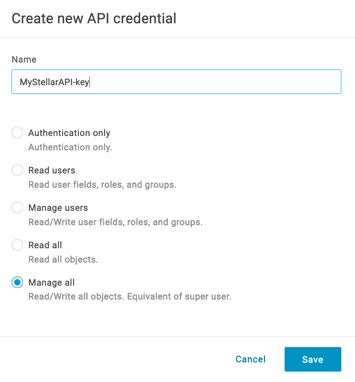
On the dialog that displays, enter the Name of the token to be used with Stellar Cyber and make note of it.
-
Select a scope that fits your plan for the Stellar Cyber connector. If you want to disable users, you will need to select the option for Manage All (this will allow you to disable users, if needed).
-
Click Save.
-
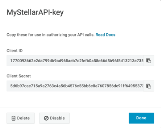
A dialog displays your new keys. At this point, make note of the Client secret and Client ID for use later.
-
Click Done.

Adding the Connector in Stellar Cyber
To add a OneLogin connector in Stellar Cyber:
-
Log in to Stellar Cyber.
-
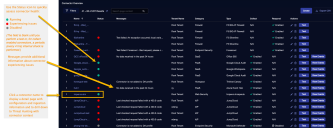
Click System | Integration | Connectors. The Connector Overview appears.
-
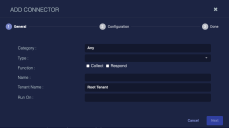
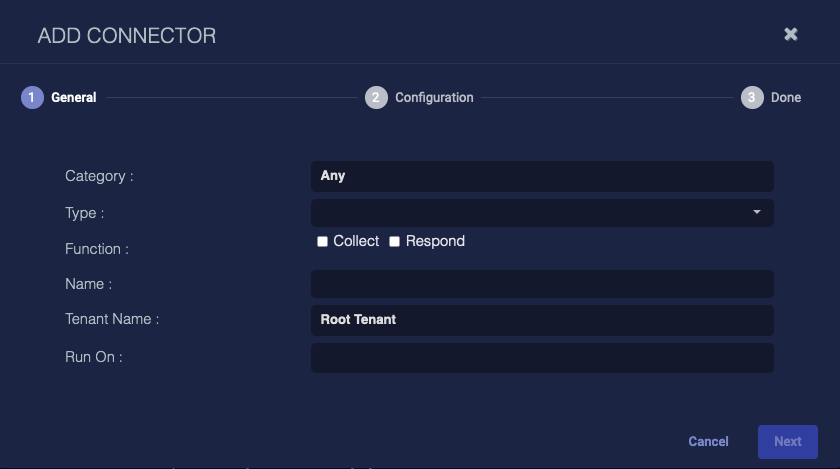
Click Create. The General tab of the Add Connector screen appears. The information on this tab cannot be changed after you add the connector.
-
Choose IdP from the Category drop-down.
-
Choose OneLogin from the Type drop-down.
-
For this connector, the supported Function is Collect, which is enabled already.
-
Enter a Name.
This field does not accept multibyte characters.
-
Choose a Tenant Name. The Interflow records created by this connector include this tenant name.
-
Choose the device on which to run the connector.
-
Certain connectors can be run on either a Sensor or a Data Processor. The available devices are displayed in the Run On menu. If you want to associate your collector with a sensor, you must have configured that sensor prior to configuring the connector or you will not be able to select it during initial configuration.
-
If the device you're connecting to is on premises, we recommend you run on the local sensor. If you're connecting to a cloud service, we recommend you run on the DP.
-
-
(Optional) When the Function is Collect, you can create Log Filters. For information, see Managing Log Filters.

-
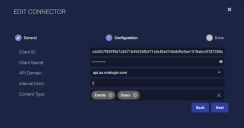
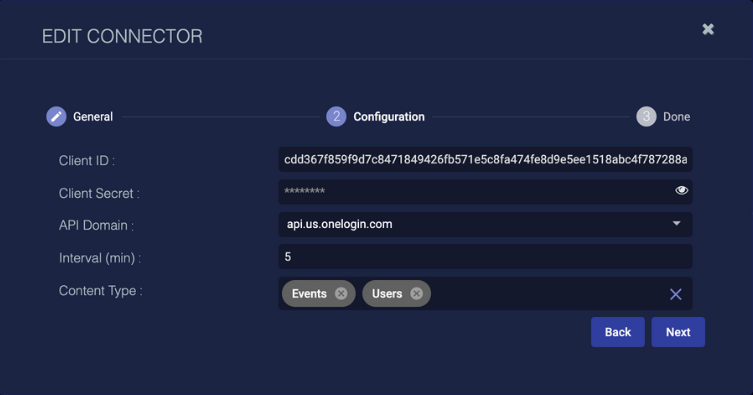
Click Next. The Configuration tab appears.
-
Enter the Client ID you noted above.
- Enter the Client Secret you noted above.
-
Select the OneLogin API Domain from the drop-down, for example: api.us.onelogin.com or api.eu.onelogin.com).
-
Choose the Interval (min). This is how often the logs are collected.
-
Choose the Content Type you would like to collect. The logs for Events and Users are supported.
-
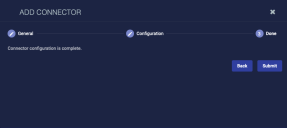
Click Next. The final confirmation tab appears.
-
Click Submit.
To pull data, a connector must be added to a Data Analyzer profile if it is running on the Data Processor.
-
If you are adding rather than editing a connector with the Collect function enabled and you specified for it to run on a Data Processor, a dialog box now prompts you to add the connector to the default Data Analyzer profile. Click Cancel to leave it out of the default profile or click OK to add it to the default profile.
-
This prompt only occurs during the initial create connector process when Collect is enabled.
-
Certain connectors can be run on either a Sensor or a Data Processor, and some are best run on one versus the other. In any case, when the connector is run on a Data Processor, that connector must be included in a Data Analyzer profile. If you leave it out of the default profile, you must add it to another profile. You need the Administrator Root scope to add the connector to the Data Analyzer profile. If you do not have privileges to configure Data Analyzer profiles, a dialog displays recommending you ask your administrator to add it for you.
-
The first time you add a Collect connector to a profile, it pulls data immediately and then not again until the scheduled interval has elapsed. If the connector configuration dialog did not offer an option to set a specific interval, it is run every five minutes. Exceptions to this default interval are the Proofpoint on Demand (pulls data every 1 hour) and Azure Event Hub (continuously pulls data) connectors. The intervals for each connector are listed in the Connector Types & Functions topic.
The Connector Overview appears.
-


The new connector is immediately active.
Testing the Connector
If you've just added this connector, wait 5–10 minutes before testing.
When you add (or edit) a connector, we recommend that you run a test to validate the connectivity parameters you entered. (The test validates only the authentication / connectivity; it does not validate data flow).
-
Click System | Integrations | Connectors. The Connector Overview appears.
-
Locate the connector that you added, or modified, or that you want to test.
-
Click Test at the right side of that row. The test runs immediately.
Note that you may run only one test at a time.
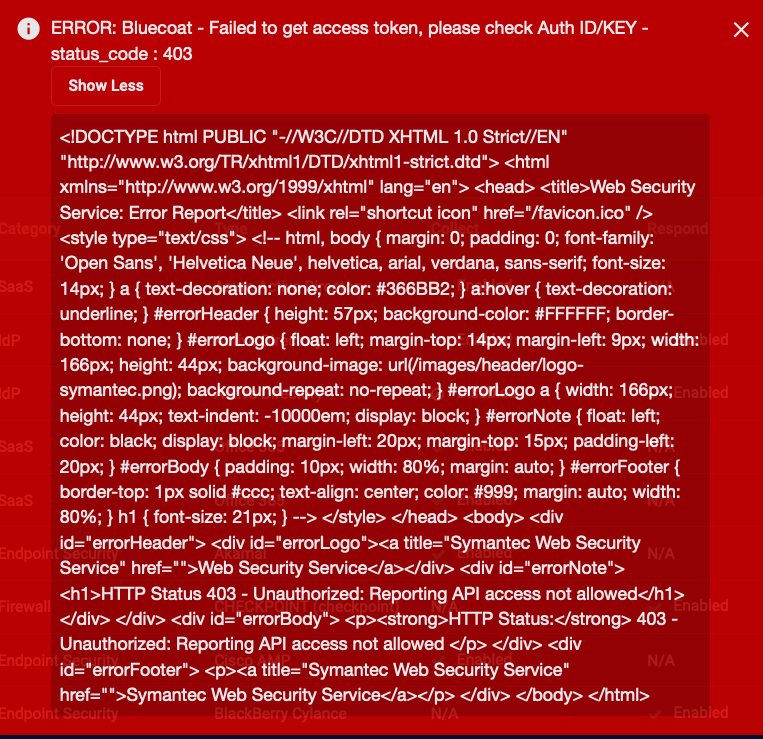
Stellar Cyber conducts a basic connectivity test for the connector and reports a success or failure result. A successful test indicates that you entered all of the connector information correctly.
To aid troubleshooting your connector, the dialog remains open until you explicitly close it by using the X button. If the test fails, you can select the button from the same row to review and correct issues.
The connector status is updated every five (5) minutes. A successful test clears the connector status, but if issues persist, the status reverts to failed after a minute.
Repeat the test as needed.


Verifying Ingestion
To verify ingestion:
- Click Investigate | Threat Hunting. The Interflow Search tab appears.
- Change the Indices to Syslog or Traffic to check ingestion. The table immediately updates to show ingested Interflow records.
