Using Toolbar Filters 
The primary function of Stellar Cyber is to surface important information from a very large data set. Use this topic to understand how to use Stellar Cyber's display filters to find information more quickly and more easily.
There are additional tools that allow you to create and reuse filters and queries and apply them to sensors directly. Review related features described in Configuring Global Shared Resources.
See the following sections for details:
Use Cases for Display Filters
Display filters are useful in any situation where you want to reduce the amount of data appearing in the user interface and focus on just the information that interests you. For example:
- Choose a period of time. The systems starts with a default time period of the last five hours. The results will show what is going on in the network in real time. However, if you're investigating a case from a few days ago, set the time filter to display only results from that time period.
- Examine what a given host is doing (or has done). The host in question can be either internal or external. If you suspect a host might be infected with malware, use the host or sensor filters to find that host.
- Research events related to your cases. Use the assignee filter to see only events related to cases you own.
- Research events related to an open case. Use the case filter to see only events for that case, or use the events filter to see related events not specific to the case.
Display Filters in the User Interface
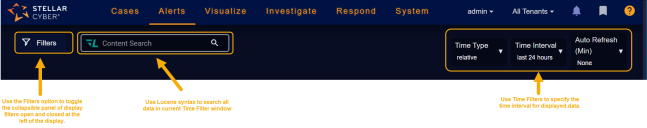
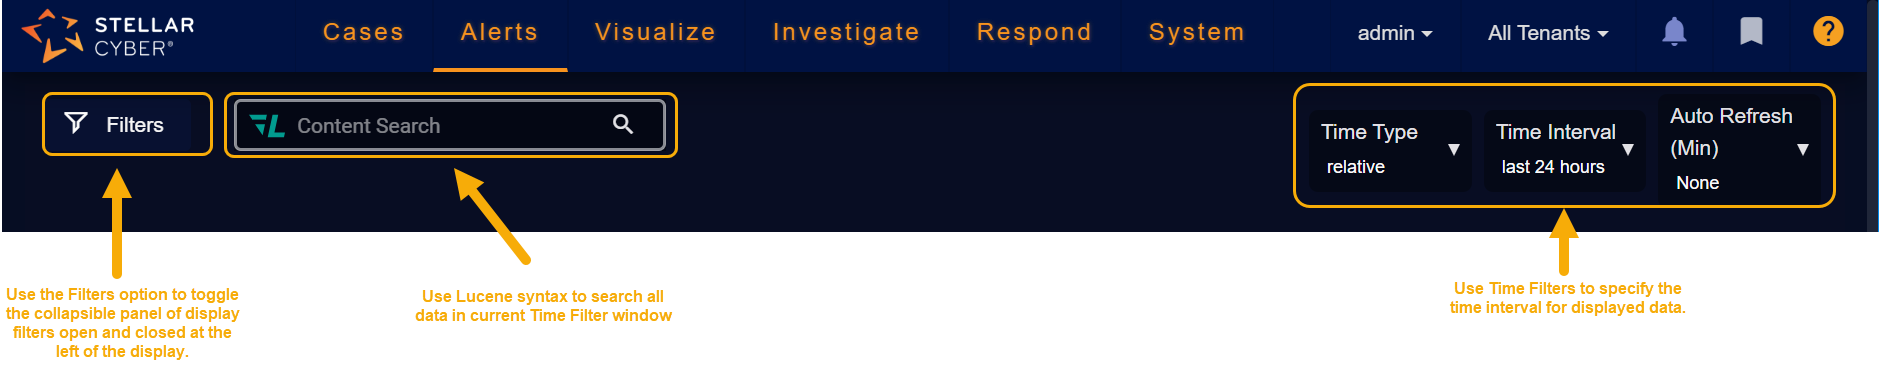
Stellar Cyber's display filters are available both in the toolbar and as a collapsible panel at the left of most displays:
-
Toolbar filters are at the top of pages that display query results, which is most pages in Stellar Cyber. For example:
-
The Filters panel is available at the left of most displays by toggling it open with the
 button in the toolbar:
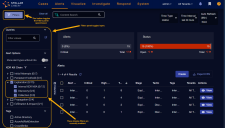

When you set a filter, the displayed data is immediately updated. In addition, if you set a filter from the Filters panel, the filter button updates to show the number of filters applied once the panel is toggled closed. For example –  .
.
The filter settings are persistent within a session. If you go to another page the search results remain the same. For example, if you are on the Kill Chain page and go to the Threat Hunting page, the same records are displayed.
Using Options in the Toolbar
This section describes the options available in the Stellar Cyber toolbar:
Displaying the Filters Panel from the Toolbar
As described above, you can toggle the Filters panel open/closed with the  button in the toolbar
Searching Displayed Data
The Search control provides a powerful way to use Lucene syntax to search for data across all pages of the currently displayed table.
A basic search is just a string of characters, such as "Intel" or "Google". Other common usages include country names that appear in the geolocation references for IP addresses, or even IP addresses themselves. An unqualified string searches all fields in the database. This could be slow if the data set is very large.
See the Search page for details on constructing searches.
See the Interflow overview for field names that are useful in searches.
Setting Time Filters in the Toolbar
The Time Type filter is often the first filter you should set. It controls the range of time for displayed events, and can help greatly narrow the query results. This useful setting gives you a quick view of what is currently happening in the network. To investigate an event in the past, set this filter accordingly. To set the time range, choose a Time Type. When you choose a type, the control immediately to the right of Time Type changes.
Changes you make in the Time Filter are preserved within your local browser's session storage, not within Stellar Cyber. If you log out of Stellar Cyber and log back in, or if you switch users, the time setting remains the same as you left it. Storage for different browser types is independent, so the time setting you make while using one type does not affect the time setting in another type (such as when you switch between use of Chrome and Firefox).
The three available Time Types are:
- Relative
- Daily
- Absolute
Relative Time
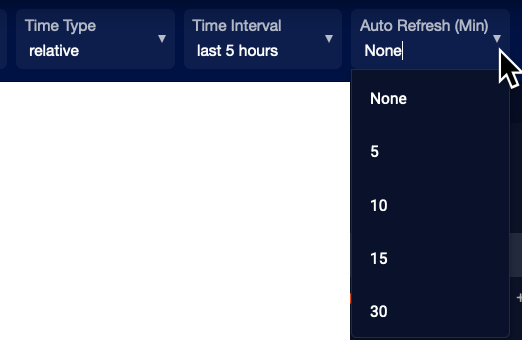
Relative time sets the time range from the current time of day going backwards. When you choose relative time, the Time Interval drop-box appears to the right. When you select an interval less than 24 hours, an Auto Refresh (Min) menu is displayed, allowing you to specify how frequently you want the data refreshed.
Relative time is a moving window. As time progresses, new events are added to the results while older ones drop off.
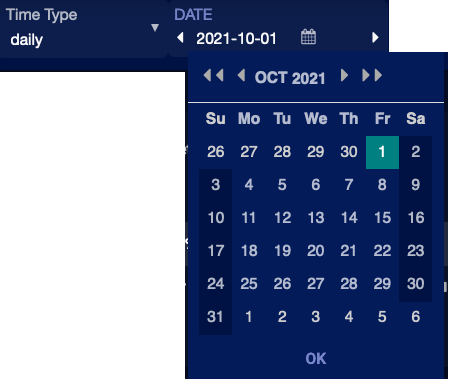
Daily Time
Daily time isolates individual days. When you choose daily time, the day selection box appears to the right. Click the arrows to move forward or back by a day at a time. Click the date in the center to see a calendar pop-up. The time is UTC.
Absolute Time
Absolute time allows you to search within a sequence of days.
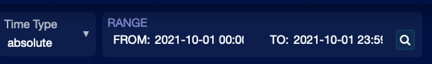
To set absolute time:
- Choose absolute in the Time Type drop-down. The Range box appears to the right.
- Click the From date to set the start day on the calendar pop-up. You can also set the hour and minute. The Search button starts blinking.
- Click the To date to set the end day on the calendar pop-up. You can also set the hour and minute.
- Click the Search button.
This is a rare filter that does not take effect immediately. Instead, the control waits, allowing you to set both dates without having the query execute before you can finish narrowing the results.
Setting Filters in the Filters Panel
The filters available in the filters panel depend on the table you're currently displaying. This section provides an overview of some of the most common and useful filters available in the filters panel:
Alert Score Filter
Use this option to narrow your results to events with a specific score range.
Event Status Filter
Filter on the status of events. By default All Open events are included. The choices include:
- No Filter
- All Open
- New
- In Progress
- Ignored
- Closed
Keep in mind that the global Status filters available here apply only to security events – alerts. They do not apply to Cases. You can apply Status filters to Cases, too, but only from the Cases interface itself.
Sensor Filter
A Stellar Cyber system includes any number of sensors. There are different types but they all collect data and send it to the data processor via Interflow messages. Each sensor is identified by a unique name in the system.
You can use the filter to select for all sensors or for a specific sensor. All Sensors is the default.
If you choose a specific sensor, the search results only include data that involves that sensor. If you choose All Sensors, the filter has no effect on the results.
This filter is useful when investigating the activities that appear in a specific place in the network. If you choose a Windows or Linux agent sensor, then the results focus on those specific systems.
See the Architecture Overview page for more information on sensors.
User Name Filter
Filter on a specific Stellar Cyber user.
Event / Asset Tag Filter
Filter on events or assets using a specific tag.
Assignee Filter
Filter on the Stellar Cyber user assigned to investigate.
Additional Scoring Filters
Optionally set specific filters by fidelity, severity, and Threat Intell scores.
Using Table Filters and the Search Bar
You can also set filters directly from table cells. Once set, they appear in the Filters panel. This section provides some tips on using the global search bar, table filters, and the filters panel to find what you're looking for:
Searching for a Specific Interflow Key and Value
You can search for Interflow keys with specific values in a table in several ways:
-
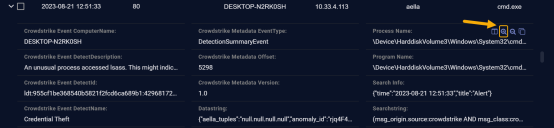
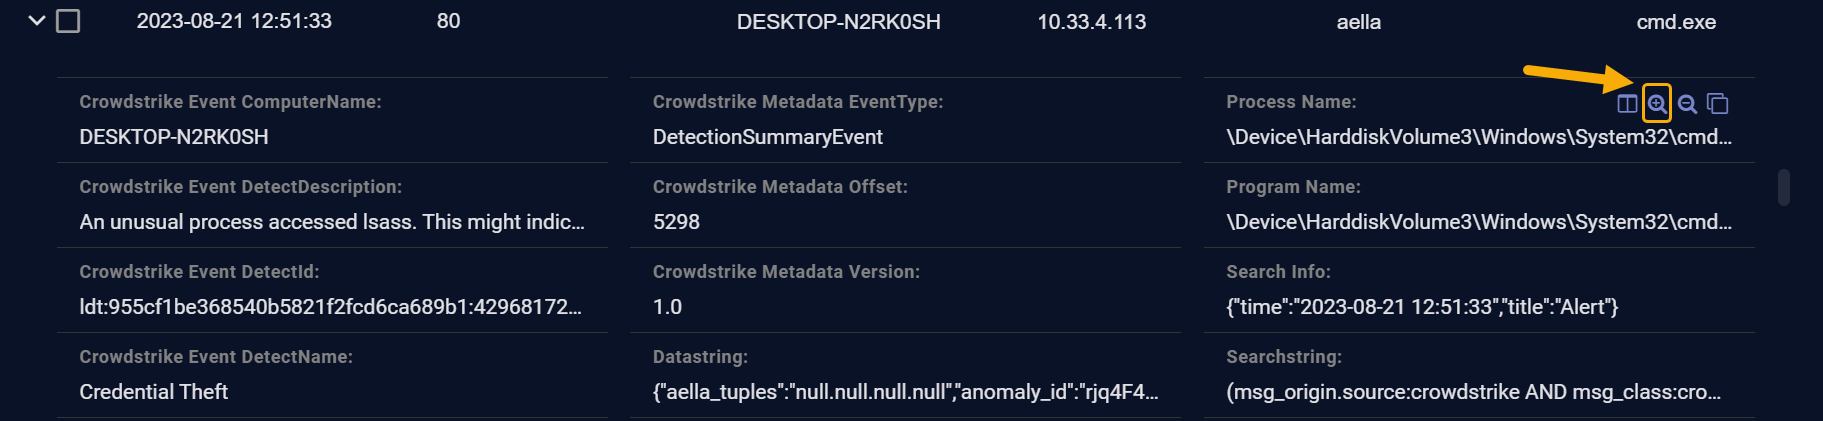
Find the key and value in a table and use the Filter For button to search for matching records. Once you add a term as a filter in this way, it automatically appears in the Filter Panel at the left of the display, too. For example, in the figure below, we're searching for Process Names matching the displayed value.
-
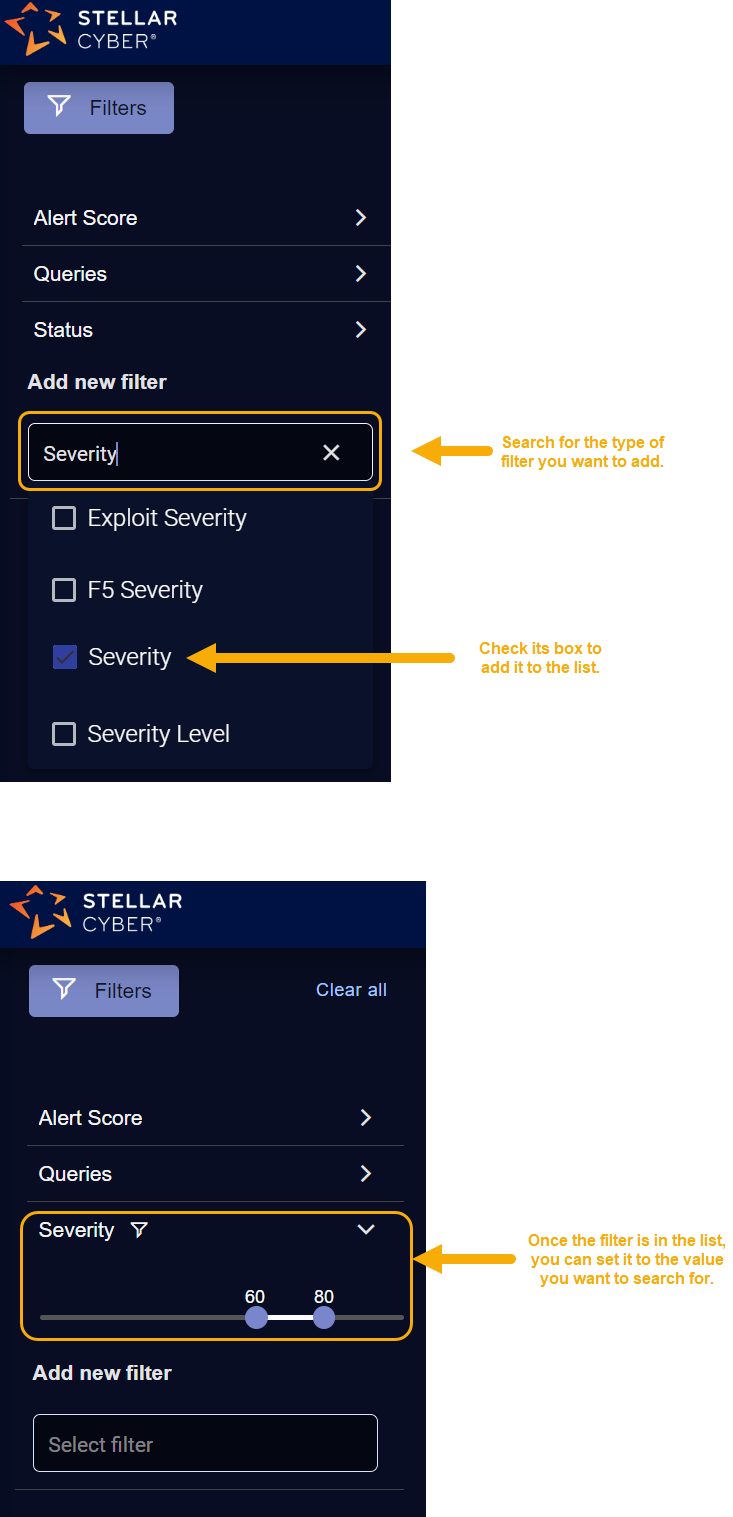
Add the Interflow key directly in the Filter Panel. If the attribute you want to search for is not already listed in the panel, you can use the Add new filter functionality to add it. Then, supply the value in the field. For example:
Searching for a Value Without a Key
If you know the value you want to search for but aren't certain of the Interflow key (for example, a number), your best route is the global search bar at the top of all Stellar Cyber pages. Take advantage of the full Lucene syntax to search for partial matches, fuzzy matches, and so on.
Excluding Values from a Table
Sometimes, it can be useful to narrow a search by temporarily excluding all records with a certain Interflow key value. This is the perfect time to use the Filter Out button in a table cell. For example, in the figure below, we're excluding all records matching the selected Host Name:

Removing Some Filter Criteria
You can remove individual filter criteria from the current search by clicking their standard delete (X) icons in the filter panel. For example:

Removing All Filter Criteria
You can remove all filter criteria by clicking the handy Clear all button at the top of the filter panel. For example:
![]()
Searching for a Specific Alert Type
You can search the Alerts table for all alerts of a specific type using either the global search bar or a table filter in the Alert Type column:
-
Use the global search bar to search the Alerts table for all alerts of a specific type by including the Interflow key of xdr_event.display_name followed by the name of the Alert Type you want to search for in quotation marks. For example, to search for the Recently Registered Domains alert type, you would enter the following in the search bar:


-
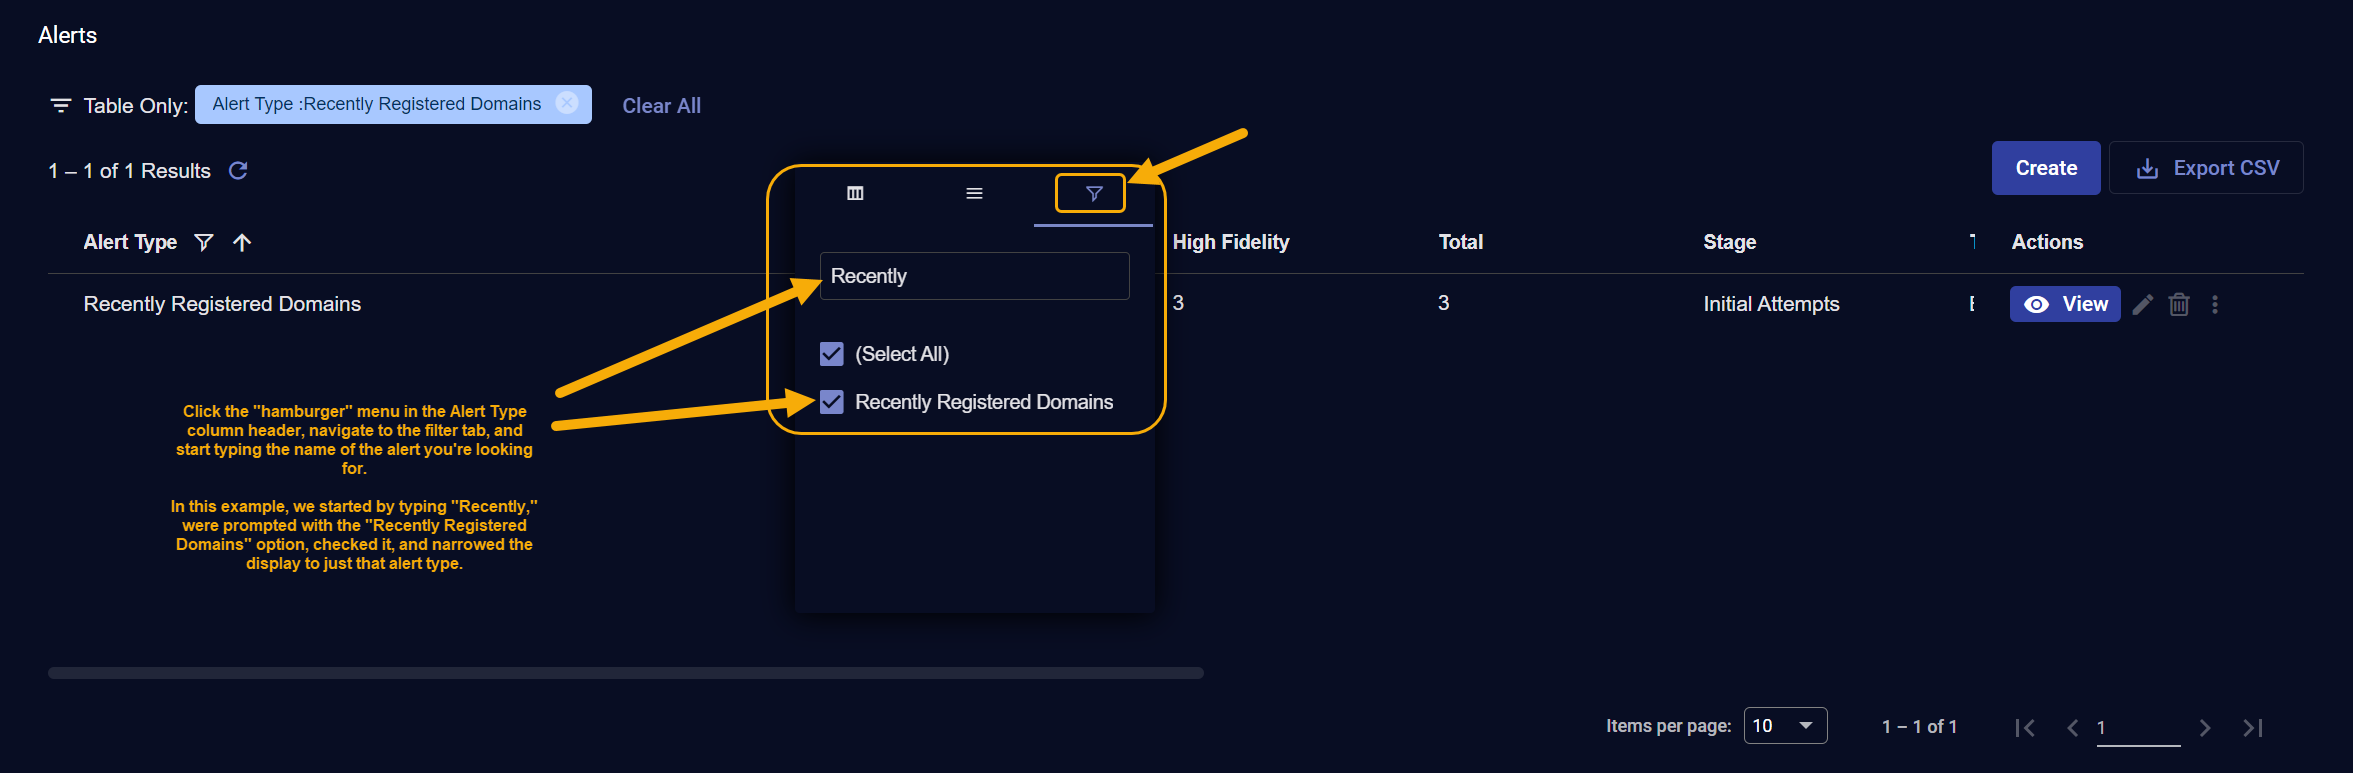
Use a table filter in the Alert Type column as follows:
-
Click the "hamburger" menu in the Alert Type column header.
-
Navigate to the Filter tab in the context menu that appears.
-
Start typing the name of the alert type for which you want to search in the text box.
-
When the matching alert type appears, click its box to apply the filter.
The filter appears at the top of the table, as in the figure below:

-
Search Tips
-
When using table data as a filter, be aware of whether the data includes multiple values. For example, the figure below shows values of both modular_sensor and Linux_agent for the data_sources Interflow key. Rather than using the Filter For button to add this entire term as a search filter, try manually supplying one or the other in the Filters panel at the left of the display.


Other Filters that Affect Data Display (Tenant Selection & Indices)
As you navigate Stellar Cyber, notice these primary settings that affect data visibility in conjunction with the other settings you make in both the toolbar and the filters panel.
Tenant Filter
The Tenant selection menu is displayed at the top of the Stellar Cyber interface. While the tenant selection is not in the filter controls, selecting a tenant filters the results just as any other filter. You can also select All Tenants to essentially remove that filter. If your role is a tenant admin or user, your tenant is automatically selected and cannot be changed. This maintains privacy between tenants.
If you change a filter from All Tenants to a specific tenant, it is possible that the data displayed under All Tenants is not in scope for the tenant you selected. In that case, an error page displays to advise of the cause with a link to the Stellar Cyber home page. Navigate to your original location and perform the desired action with the desired tenant, which ensures the objects visible to that tenant are available for display.
Indices
The Data Lake stores data in indices. Each index is used for a different purpose depending on what the source of data is. For example, there is one index for Linux events and another for Syslog records. When building your filter, remember that:
- The search results always display data from a single index.
- The filter controls do not include a control for which index is used to produce the results. This parameter is usually supplied invisibly by the current page.
- On the XDR Kill Chain Home Page the Alerts index is used. Other pages might use a different index depending on their function.
- The Investigate | Threat Hunting page defaults to the Alerts index; a menu is available from this page for you to change the index to match the threat type you are investigating. Select one or more indices to complement the filter you set in the toolbar.
Toolbar Filters Prior to 4.3.7
Prior to the 4.3.7 release, toolbar filters worked as described below.
You can use the toolbar filters to narrow displayed results. For example:
- Choosing a period of time. The systems starts with a default time period of the last five hours. The results will show what is going on in the network in real time. However, if you're investigating an incident from a few days ago, set the time filter to display only results from that time period.
- Examining what a given host is doing (or has done). The host in question can be either internal or external. If you suspect a host might be infected with malware, use the host or sensor filters to find that host.
- Researching events related to your cases. Use the assignee filter to see only events related to cases you own.
- Researching events related to an open case. Use the case filter to see only events for that case, or use the events filter to see related events not specific to the case.
The filter controls are at the top of pages that display query results, which is most pages in Stellar Cyber.

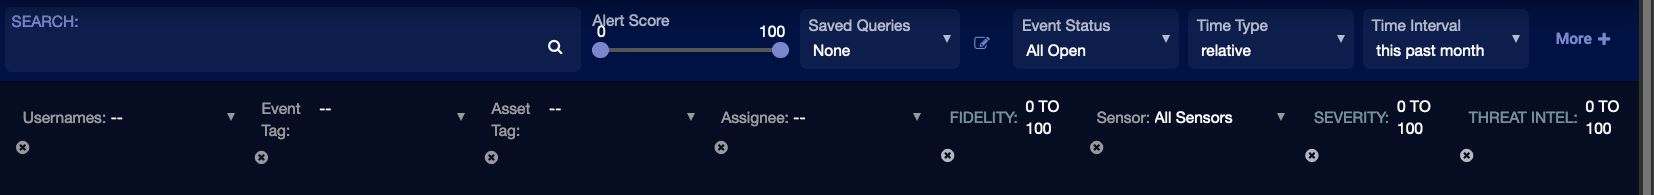
Click the More + button at the far right of the screen to display a list of the additional filters. The full filter set, with advanced types, is depicted below.
When you set a filter, the displayed data is immediately updated.
The filter settings are persistent within a session. If you go to another page the search results remain the same. For example, if you are on the Kill Chain page and go to the Threat Hunting page, the same records are displayed.
Primary Toolbar Filters
As you navigate Stellar Cyber, notice these primary settings that affect data visibility, in conjunction with the other settings you make from the Filter toolbar.
Tenant Filter
The Tenant selection menu is displayed at the top of the Stellar Cyber interface. While the tenant selection is not in the filter controls, selecting a tenant filters the results just as any other filter. You can also select All Tenants to essentially remove that filter. If your role is a tenant admin or user, your tenant is automatically selected and cannot be changed. This maintains privacy between tenants.
If you change a filter from All Tenants to a specific tenant, it is possible that the data displayed under All Tenants is not in scope for the tenant you selected. In that case, an error page displays to advise of the cause with a link to the Stellar Cyber home page. Navigate to your original location and perform the desired action with the desired tenant, which ensures the objects visible to that tenant are available for display.
Indices
The Data Lake stores data in indices. Each index is used for a different purpose depending on what the source of data is. For example, there is one index for Linux events and another for Syslog records. When building your filter, remember that:
- The search results always display data from a single index.
- The filter controls do not include a control for which index is used to produce the results. This parameter is usually supplied invisibly by the current page.
- On the XDR Kill Chain Home Page the Alerts index is used. Other pages might use a different index depending on their function.
- The Investigate | Threat Hunting page defaults to the Alerts index; a menu is available from this page for you to change the index to match the threat type you are investigating. Select one or more indices to complement the filter you set in the toolbar.
Secondary Toolbar Filters
Search Filter
The search control is located to the far left and provides a powerful way to search for data.
A basic search is just a string of characters, such as "Intel" or "Google". Other common usages include country names that appear in the geolocation references for IP addresses, or even IP addresses themselves. An unqualified string searches all fields in the database. This could be slow if the data set is very large.
See the Search page for details on constructing searches.
See the Interflow overview for field names that are useful in searches.
Alert Score Filter
Use this option to narrow your results to events with a specific score range. You can also set specific filters by fidelity, severity, and Threat Intell score, using those filters available from the More + menu. Alternatively, you can set these score filters from actual data, by selecting the field menu next to the table value. The menu is displayed by clicking the vertical ellipse button from a table field to open a menu that allows you to set the value as an include or exclude filter.
Query Filters
Queries are similar to searches but use a different method for building and processing. Click Saved Queries to choose a previously saved query from a drop-down. Click the Query Builder to create, edit, and delete queries.
Saved queries are specific to each user.
See the Queries page for details on constructing and using queries.
Event Status Filter
Filter on the status of events. By default All Open events are included. The choices include:
- No Filter
- All Open
- New
- In Progress
- Ignored
- Closed
Time Filter
Time Type is often the first filter you should set. It controls the range of time for displayed events, and can help greatly narrow the query results. The default time is a relative range of 5 hours. This useful setting gives you a quick view of what is currently happening in the network. To investigate an event in the past, set this filter accordingly. To set the time range, choose a Time Type. When you choose a type, the control immediately to the right of Time Type changes.
Changes you make in the Time Filter are preserved within your local browser's session storage, not within Stellar Cyber. If you log out of Stellar Cyber and log back in, or if you switch users, the time setting remains the same as you left it. Storage for different browser types is independent, so the time setting you make while using one type does not affect the time setting in another type (such as when you switch between use of Chrome and Firefox).
The three available Time Types are:
- Relative
- Daily
- Absolute
Relative
Relative time sets the time range from the current time of day going backwards. When you choose relative time, the Time Interval drop-box appears to the right. When you select an interval less than 24 hours, an Auto Refresh (Min) menu is displayed, allowing you to specify how frequently you want the data refreshed.
Relative time is a moving window. As time progresses, new events are added to the results while older ones drop off.
Daily
Daily time isolates individual days. When you choose daily time, the day selection box appears to the right. Click the arrows to move forward or back by a day at a time. Click the date in the center to see a calendar pop-up. The time is UTC.
Absolute
Absolute time allows you to search within a sequence of days.
To set absolute time:
- Choose absolute in the Time Type drop-down. The Range box appears to the right.
- Click the From date to set the start day on the calendar pop-up. You can also set the hour and minute. The Search button starts blinking.
- Click the To date to set the end day on the calendar pop-up. You can also set the hour and minute.
- Click the Search button.
This is a rare filter that does not take effect immediately. Instead, the control waits, allowing you to set both dates without having the query execute before you can finish narrowing the results.
Sensor Filter
A Stellar Cyber system includes any number of sensors. There are different types but they all collect data and send it to the data processor via Interflow messages. Each sensor is identified by a unique name in the system.
You can use the filter to select for all sensors or for a specific sensor. All Sensors is the default.
If you choose a specific sensor, the search results only include data that involves that sensor. If you choose All Sensors, the filter has no effect on the results.
This filter is useful when investigating the activities that appear in a specific place in the network. If you choose a Windows or Linux agent sensor, then the results focus on those specific systems.
See the Architecture Overview page for more information on sensors.
User Name Filter
Filter on a specific Stellar Cyber user.
Event / Asset Tag Filter
Filter on events or assets using a specific tag.
Assignee Filter
Filter on the Stellar Cyber user assigned to investigate.
Additional Scoring Filters
Optionally set specific filters by fidelity, severity, and Threat Intell scores.
