Using the XDR Kill Chain (Home Page)
The XDR Kill Chain dashboard is the default home page for Stellar Cyber. It provides a central location for assessing overall risk and threats found within the environment. Drilldowns to ongoing incidents, risky assets, and tactics help you keep the environment and its systems secure by zeroing in on what requires immediate attention.
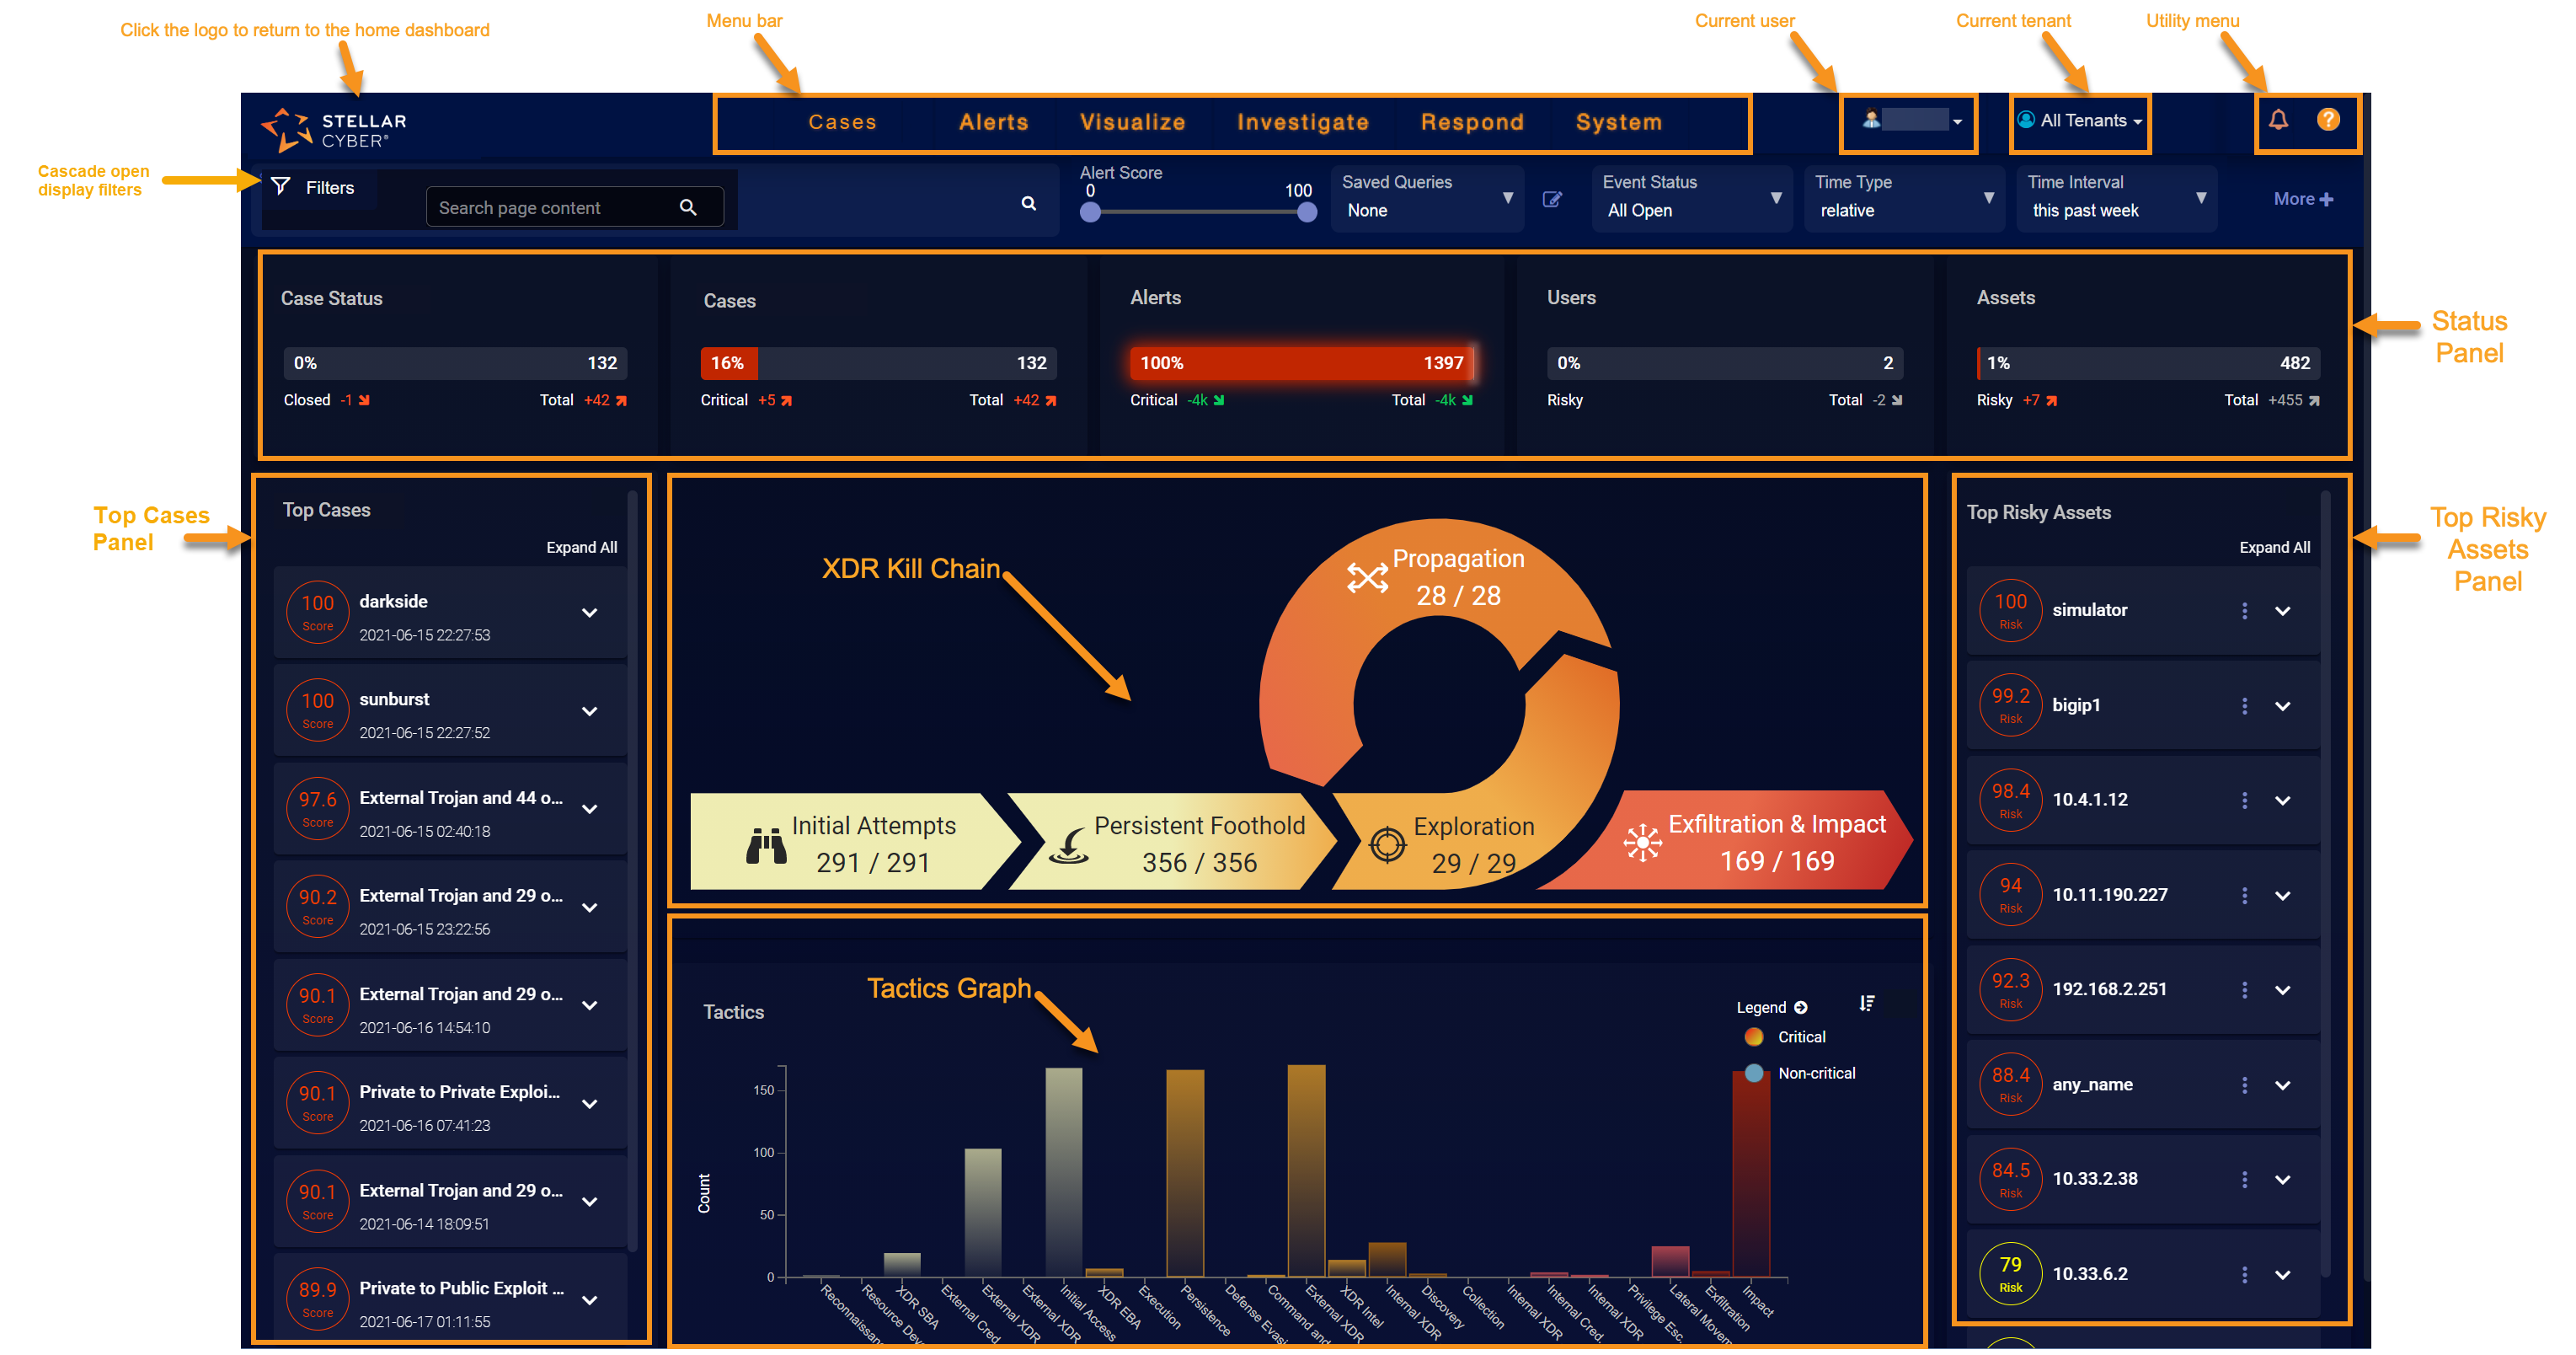
The illustration below introduces you to the XDR Kill Chain dashboard's major components. Following the illustration, you can review detailed information on each of the main components.
-
XDR Kill Chain Loop – Provides critical/total alert counts at each of the XDR Kill Chain stages; click a stage to drill to the Alert Types page for the corresponding stage. Critical alerts are those with an Alert Score of 75 or greater.
-
Status Panel – Provides at-a-glance status graphs for case status, cases, alerts, users, and assets, including trend information.
-
Top Cases Panel – Lists collapsible capsule summaries of the top cases by score; click a case to drill to its Case Detail view.
-
Top Risky Assets Panel – Lists collapsible capsule summaries of the top risky assets by score with multiple drilldowns for further analysis.
-
Tactics Panel – Provides a bar graph quantifying the alerts observed by Stellar Cyber according to their corresponding tactics. You can filter by critical or non-critical tactics and drill to a view of the Alert Types page filtered by the corresponding tactic.
-
Common Controls – Provides the standard menu bar, as well as search, query, and filter controls that appear throughout Stellar Cyber.
Getting Back to the XDR Kill Chain Dashboard
The Stellar Cyber XDR Kill Chain dashboard appears immediately after you log in and is the system's default home page:
-
If you have not changed your home page using the Set as homepage button , you can get back to the XDR Kill Chain dashboard by clicking the Stellar Cyber logo at the upper left of the display or by selecting the Dashboard | Home option.
-
If you have changed your home page using the Set as homepage button , you can get back to the XDR Kill Chain dashboard by selecting it from the Visualize | Predefined menu.
XDR Kill Chain
The centerpiece of the XDR Kill Chain dashboard is the XDR Kill Chain loop. The XDR Kill Chain identifies five separate stages on the attack landscape, each with its own associated tactics and techniques. Tactics and techniques include both those based on the MITRE | ATT&CK framework, as well as native XDR versions developed by Stellar Cyber. You can hover your mouse over any XDR Kill Chain stage to see a popup listing the tactics tracked at the corresponding stage.
Each of the stages reports counts for critical and total alerts within the selected filters and provides a drilldown to the Alert Types display, filtered for the corresponding stage.
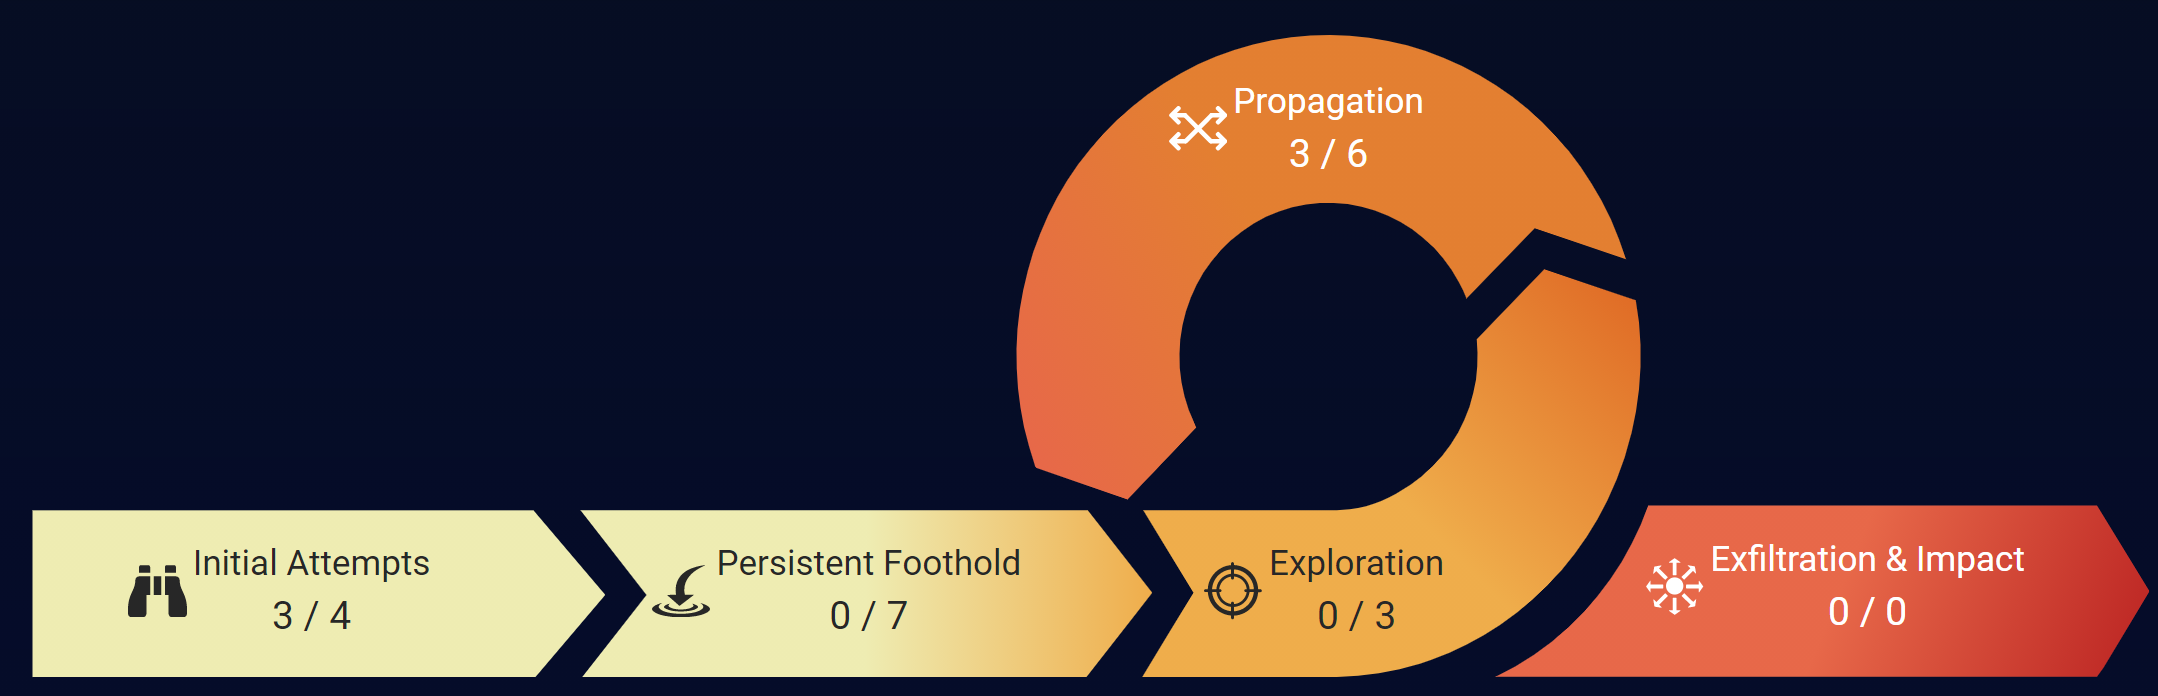
The XDR Kill Chain includes the following stages, each identified by its own distinctive color and icon. These colors and icons are used consistently throughout the user interface to reinforce stage identification.
| XDR Kill Chain Stage | Icon | Summary | Associated MITRE | ATT&CK Tactics | Associated XDR Tactics | Classic Attacks |
|---|---|---|---|---|---|
| Initial Attempts |

|
Attackers are trying to access your network. |
External XDR NBA External XDR UBA |
|
|
| Persistent Foothold |

|
Attackers are trying to maintain access to your systems in spite of defensive techniques. |
XDR EBA External XDR Malware XDR Intel |
|
|
| Exploration |

|
Attackers are inspecting your network, learning about your environment before taking further action. | Internal XDR NBA |
|
|
| Propagation |

|
Attackers are trying to obtain additional privileges and access and control additional systems on your network. |
Internal XDR UBA Internal XDR Malware |
|
|
| Exfiltration & Impact |

|
Attackers are trying to steal data, potentially dumping it in a way that avoids detection, and/or vandalizing your systems and data. |
|
This Kill Chain loop provides an immediate barometer of the quantity and severity of the events observed by Stellar Cyber within the current filter settings. Each stage of the Kill Chain loop is shown with counts for critical and total alerts within the current filters:
- The number on the left reports the number of critical alerts within the current filters. These alerts have been scored by machine learning services with a Alert Score of 75 or greater and are most likely to need immediate attention.
- The number on the right reports the total number of alerts detected within the current filters.
The dashboard only shows data matching the current filters set using the controls at the top of the display (time, event score, sensor, and so on).
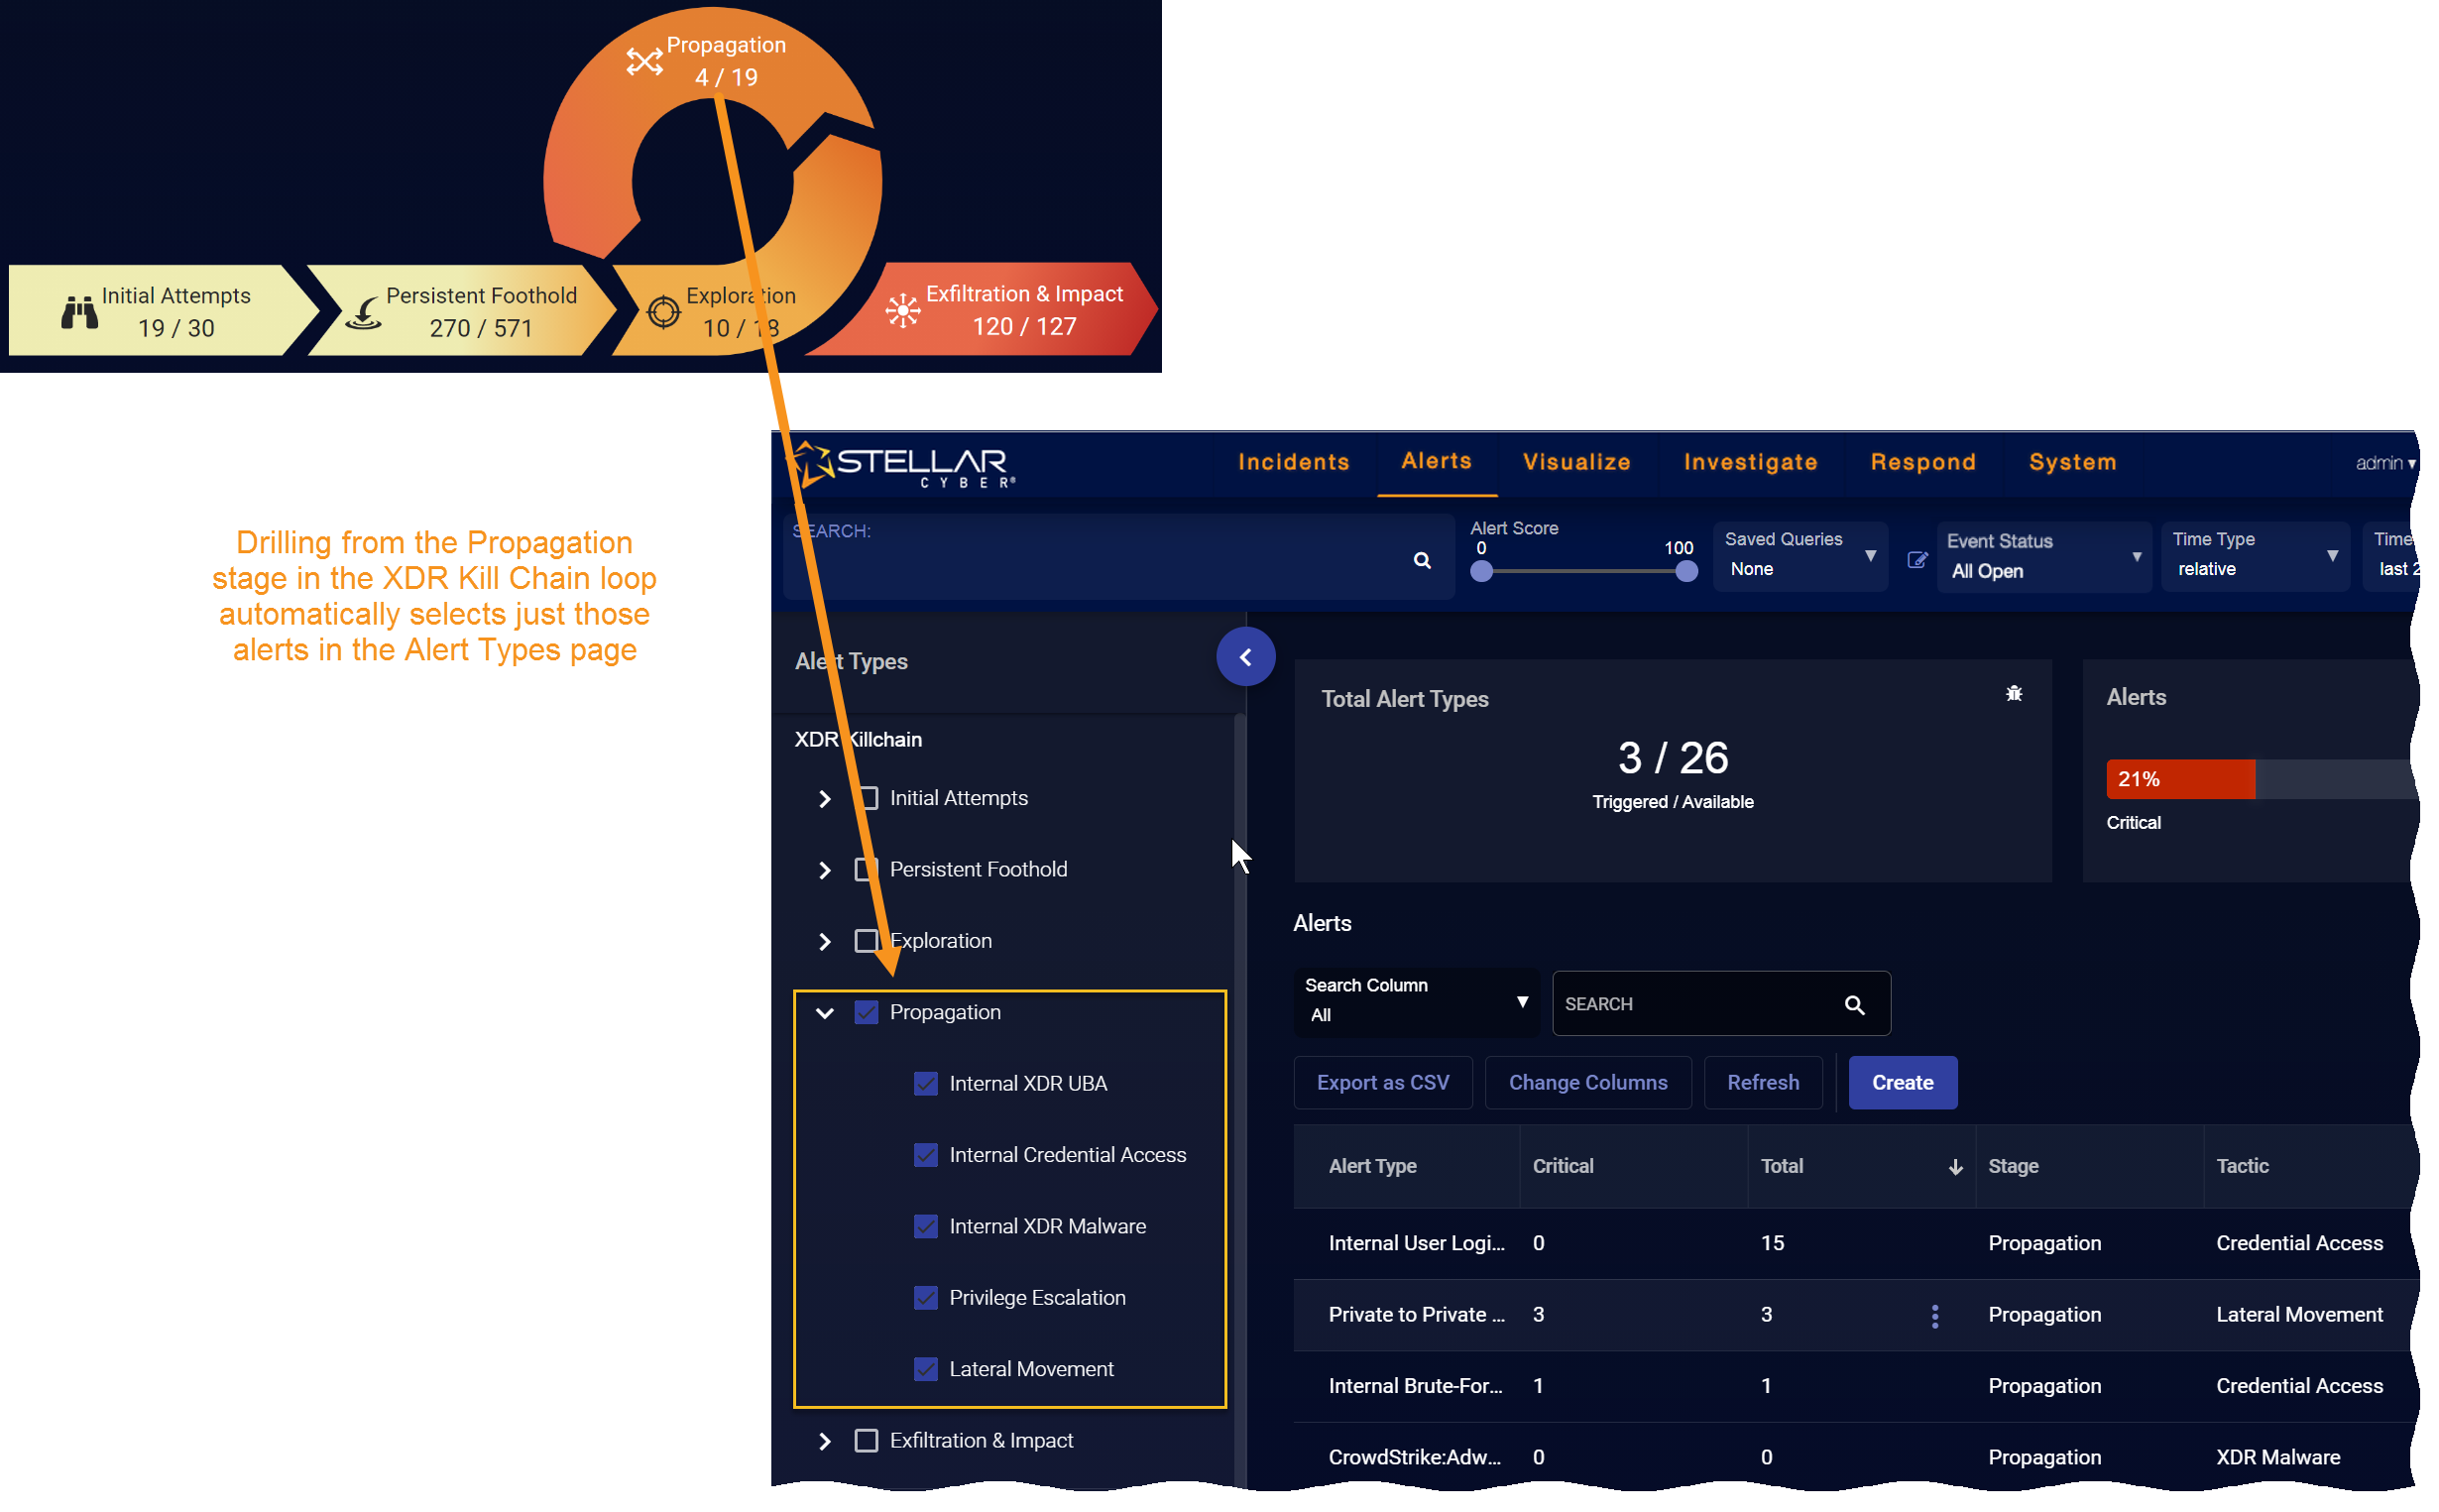
Drilling to Alerts from the XDR Kill Chain Loop
You can click any of the stages in the XDR Kill Chain loop to drill to the Alerts page with a display filter automatically applied so that just the alert types at the selected stage are displayed, as illustrated in the figure below.
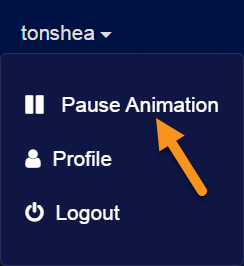
Pausing the XDR Kill Chain Loop
You can pause the animation of the XDR Kill Chain loop from your username menu, as shown below:
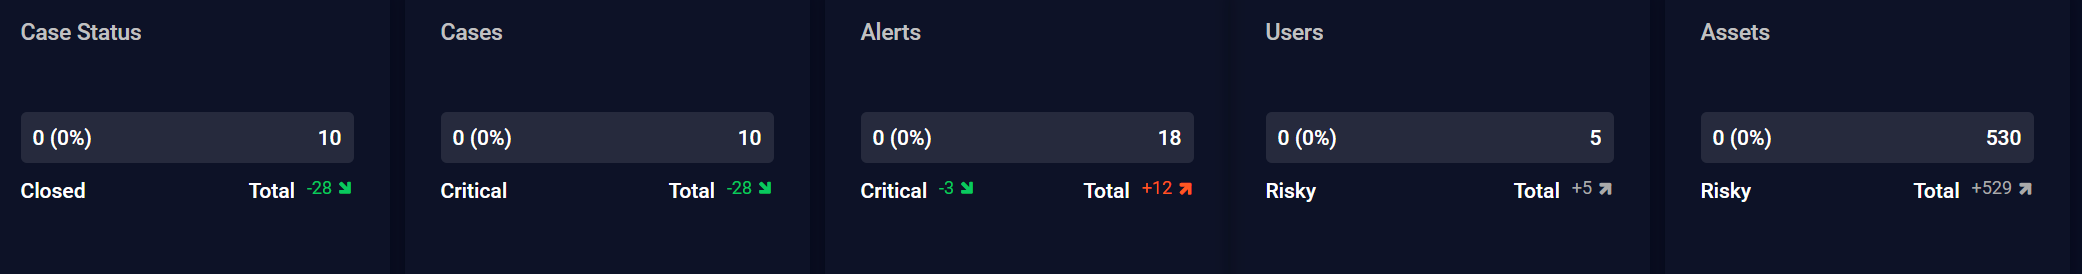
Status Panel
The Status panel appears immediately above the XDR Kill Chain and displays separate, color-coded cards illustrating counts and trends for Cases, Case Status, Alerts, Users, and Assets.
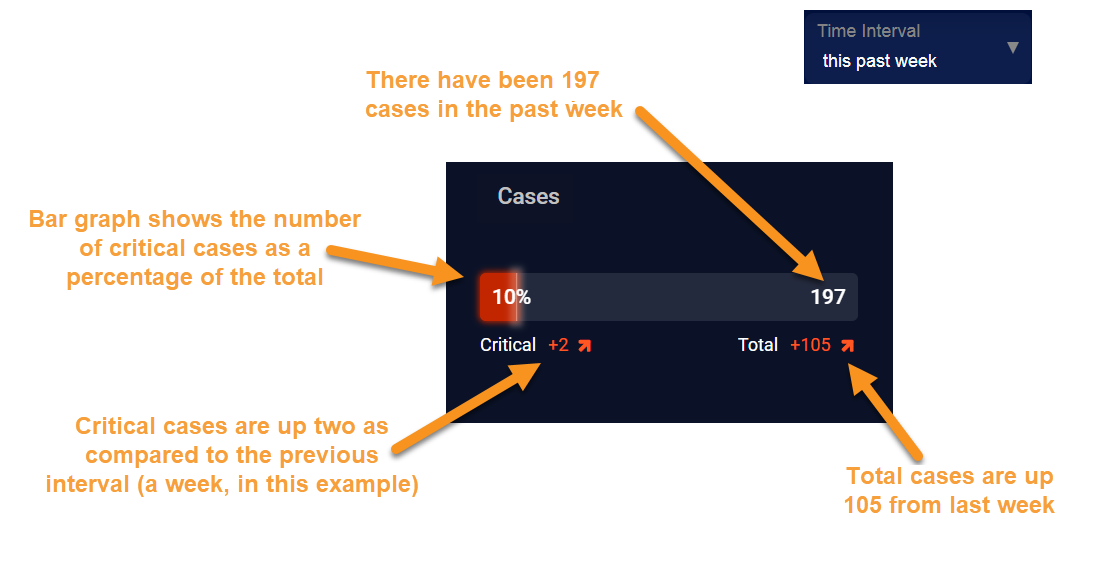
The bar graphs and counters in the Status Panel cards all function in roughly the same way. Consider the Cases status card shown below:
-
Case Status – Use this panel to gauge your progress on addressing cases that match the selected filters:
-
The bar graph shows the number of Closed cases (those with a Status of either Resolved or Cancelled set in the Case Detail page) compared to the total number of cases that match the selected filters.
-
The Closed indicator shows you the trend in case closure, comparing the net increase or drop in closed cases to the previous time window of the same size. Closed cases are those with a status of either Resolved or Cancelled in the Case Detail page.
-
The Total indicator shows you the trend in total cases, comparing the net increase or drop in total case closures to the previous time interval of the same size.
-
-
Cases– Use this panel to assess the number of cases that match the selected filters. The bar graph, Critical, and Total indicators all function in roughly the same ways as the Cases Status panel, except for critical and total case creation.
-
Alerts – Use this panel to assess the number of critical alerts detected in the selected time interval. The bar graph, Critical, and Total indicators all function in roughly the same ways as the Incident Status panel, except for critical and total alert creation.
-
Users – Use this panel to assess the number of risky users detected in the selected time interval. The bar graph, Risky, and Total indicators all function in roughly the same ways as the Incident Status panel, except for total and risky user detection.
-
Assets – Use this panel to assess the number of risky assets detected in the selected time interval. The bar graph, Risky, and Total indicators all function in roughly the same ways as the Incident Status panel, except for risky and total asset detection.
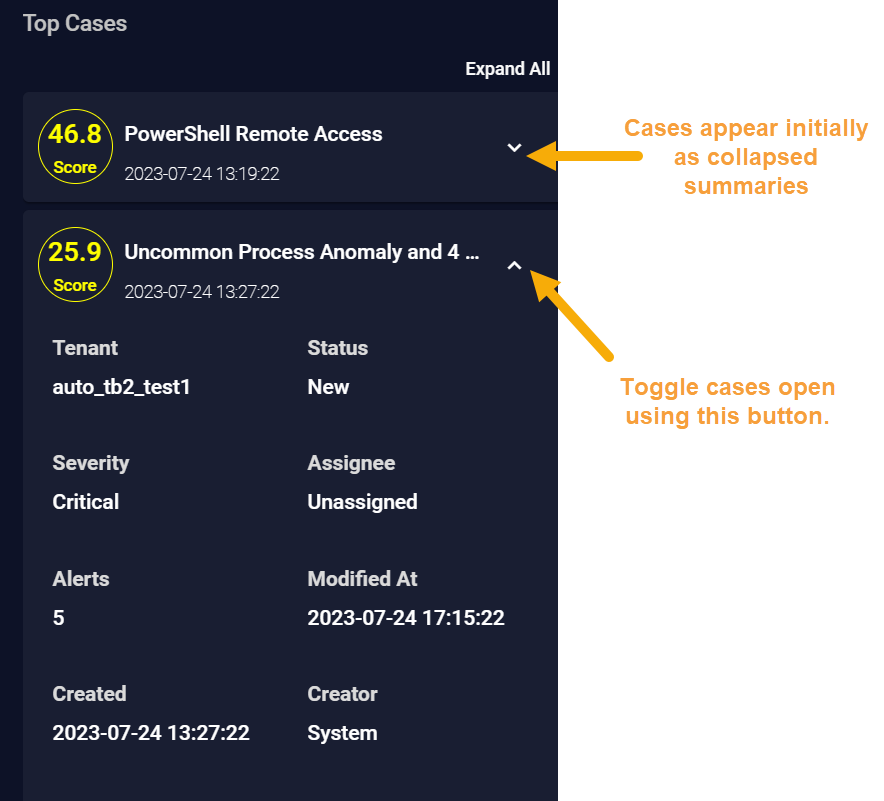
Top Cases Panel
The Top Cases panel lists the most severe Cases in the selected Time Interval according to their score. The panel is located at the left of the XDR Kill Chain dashboard, directly under the Case Status and Cases panels, handily arranging these related tools together.
A case is a set of multiple correlated alerts and entities constituting a potential unified security attack, ranked by a dynamically updated score indicating the severity of the attack. Stellar Cyber uses its machine-learning capabilities to generate cases automatically, grouping related alerts into a unified case for improved attack resolution.
Cases appear initially in the Top Cases panel as collapsed summary entries, but can be cascaded open using the ˅ button at their right, as shown below. You can also expand all of the entries in the list using the Expand all button at the top of the panel.
Cases are reported in the Top Cases panel with the following information:
-
Name – Stellar Cyber automatically assigns a name to each Case it reports. You can either accept the default name or supply your own in the Case Detail view.
-
Tenant – The tenant with which this Case is associated.
-
Ticket ID – The system-assigned ticket number for the Case.
-
Status – The status associated with this Case. Can be either New, In Progress, Resolved, or Cancelled. You can change the status in the Case Detail view, giving you a handy way to track your team's Case response over time.
-
Incident Score – The severity of the Case, as determined by Stellar Cyber. The score updates in real time as events and entities are added to or removed from the Case. Scores are color-coded to indicate their severity.
-
Alerts – A count of the alerts associated with the Case.
The maximum of associated alerts is 5,000.
-
Priority – The priority of the Case. Cases start out with a Medium priority, but can be changed in the Case Detail view to Low, High, or Critical.
-
Assignee – The assignee for the Case, if any. You can assign resources to Cases in the Case Detail view.
-
Last Modified – The last time the Case was modified by a user, either by changing any of its properties (for example, changing its status or name), or by adding/removing any event associated with the Case.
-
Creator – The user account that created the Case. Cases created by Stellar Cyber are listed with a creator of System.
-
Created – The time at which the Case was created by Stellar Cyber.
Drilling to the Case Detail Page
You can click on the Case name in the Top Cases panel to view the Case Detail view for the corresponding Case.
Top Risky Assets Panel
The Top Risky Assets panel lists assets in the selected Time Interval in descending order of Risk Score. The panel is located at the right of the XDR Kill Chain dashboard, directly under the Assets status panel, handily arranging these related tools together.
Assets appear initially in the Top Assets panel as collapsed summary entries, but can be cascaded open using the ˅ button at their right, as shown below. You can also expand all of the entries in the list using the Expand all button at the top of the panel.
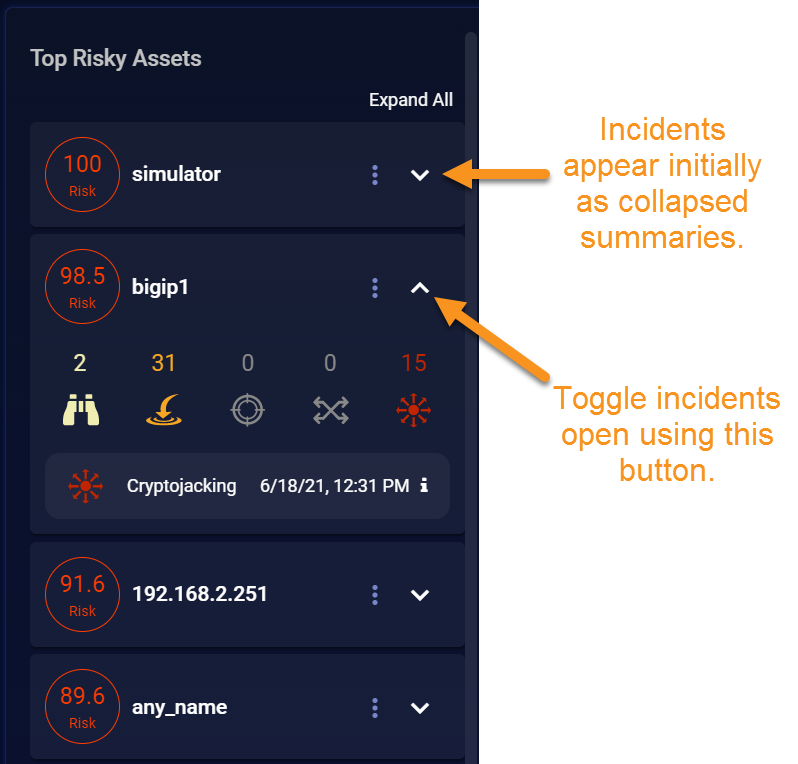
Assets are reported in the Top Assets panel with the highest-risk entries at the top. As shown in the figure below, each asset is listed with the following information and context-sensitive drilldowns:

-
Risk score. The number in the circle indicates risk. The highest risk is 100 and the least is zero.
-
IP address or hostname of the asset.
-
Context menu access
 for drilldowns to the following additional Stellar Cyber for the asset:
 -
Asset Detail View – Opens the Investigate | Asset Analytics | Asset Details tab for the selected friendly name, hostname, or IP address as the filter.
-
360 Panoramic View – Opens the Investigate | Panoramic view with the selected friendly name, hostname, or IP address as the filter.
-
ZOOM Lateral View – Opens Investigate | Threat Hunting to the ZOOM tab. The Lateral view displayed with the friendly name, hostname, or IP address as the focus.
-
ZOOM Chronicle View – Opens Investigate | Threat Hunting to the ZOOM tab. The Chronicle view displayed with the friendly name, hostname, or IP address as the focus.
The ZOOM feature is deprecated in 4.3.7 and will be removed in a future release.
-
VT VirusTotal Lookup – Performs a lookup on virustotal.com for the selected friendly name, hostname, or IP address.
-
Add as Including Filter – Creates a filter to display only those events containing the value in the field.
-
Add as Excluding Filter – Filters out those events containing the value in the field.
-
Copy to Clipboard – Copies the field value to the clipboard so it can be pasted elsewhere.
-
Related Alerts – Opens Investigate | Threat Hunting to the Interflow tab with a search performed on the corresponding entity.
-
-
XDR Kill Chain summary. Alert counts are shown for each XDR Kill Chain stage, identified using their consistent stage icons and colors. You can click any stage entry to drill to the Alert Types page, filtered for the corresponding asset and Kill Chain stage.
-
A one-line summary for the most severe alert associated with the asset. You can click the button to drill to the Event Display for the alert, including the supporting Interflow data.
Tactics Graph
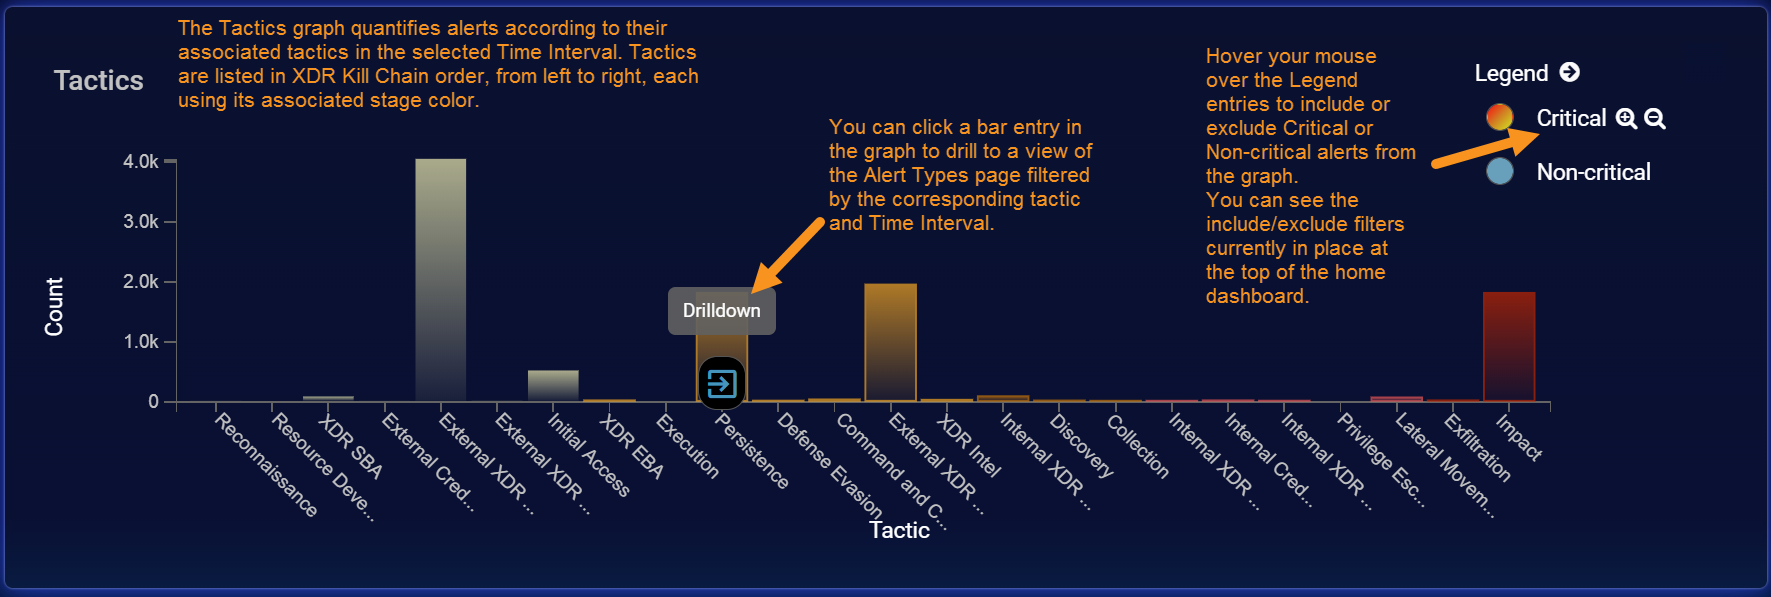
The Tactics graph at the bottom of the XDR Kill Chain dashboard quantifies alerts by their associated XDR Kill Chain tactic within the selected filters.
-
Tactics are listed in XDR Kill Chain order, from left to right along the x-axis of the graph. Bar graph entries for each tactic are displayed in their corresponding XDR Kill Chain stage color.
-
You can drill to the Alert Types page by clicking any bar graph entry for a tactic and selecting the Drilldown popup that appears. In response, the Alert Types page appears, already filtered by the selected tactic and time interval.
-
You can hover your mouse over the Legend entries to include or exclude critical or non-critical alerts from the graph. Critical alerts are those with an Alert Score of 75 or greater.
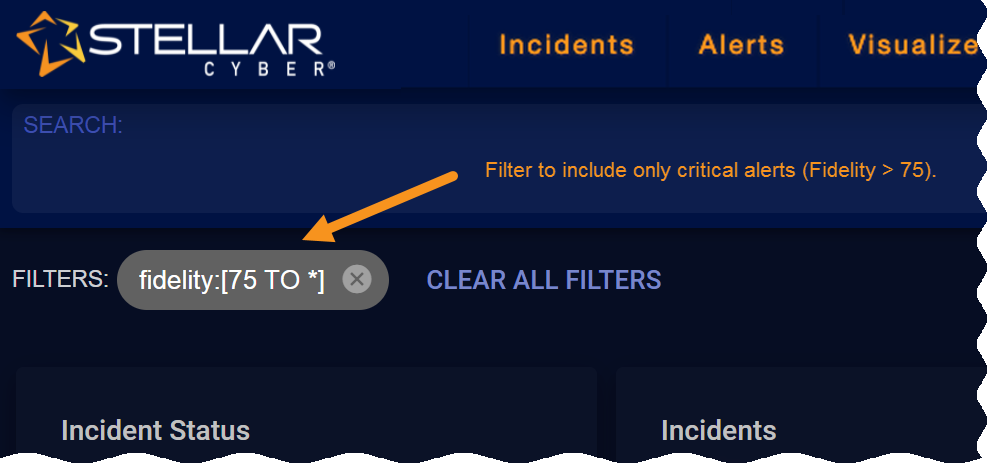
Once you've applied an include/exclude filter, you can see its current settings at the top of the display. As shown below, you can also clear the filter to return the display to its unfiltered state.

Common Menus and Controls
This section summarizes the common menus and controls that appear at the top of most Stellar Cyber pages:
Main Menu Bar
Use the Menu Bar at the top of the interface to navigate to any function in Stellar Cyber. This control appears on all screens.

Select these menu options to access the following features:
-
Click the Stellar Cyber logo to get back to the current Home page.
-
Cases: Manage cases– sets of multiple correlated alerts – reported by Stellar Cyber.
-
Alerts: Display a list of alerts observed by Stellar Cyber, organized by the XDR Kill Chain and analyzed with machine learning.
-
Visualize: Access both predefined and custom dashboards, as well as create and manage new dashboards and charts.
-
Investigate: Use selected views to perform threat hunting, search the Stellar Cyber database for information related to observed events, and view asset analytics.
-
Respond: Define your own alert types through automation, create and schedule reports, and initiate and manage actions such as user, firewall, or device actions taken in response to events.
-
System: Configure and administer Stellar Cyber and manage assets.
The currently active menu option is underlined.
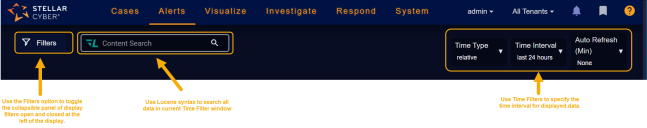
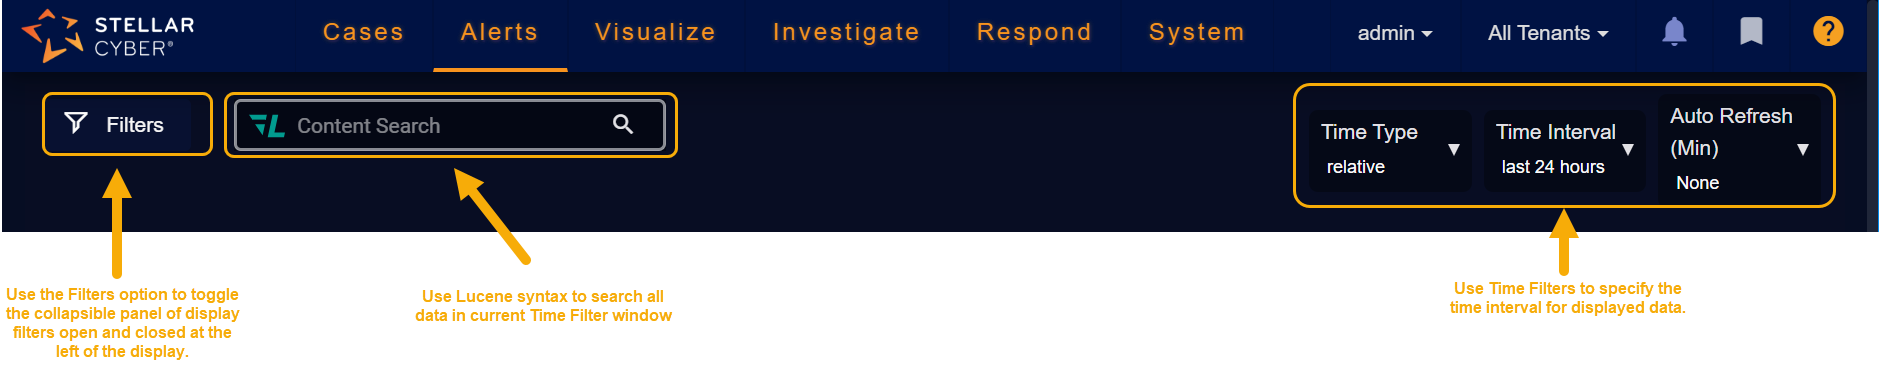
Filter Controls
Stellar Cyber's display filters are available both in the toolbar and as a collapsible panel at the left of most displays:
-
Toolbar filters are at the top of pages that display query results, which is most pages in Stellar Cyber. For example:
-
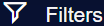
The Filters panel is available at the left of most displays by toggling it open with the
 button in the toolbar:
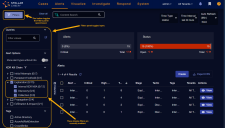

When you set a filter, the displayed data is immediately updated. In addition, if you set a filter from the Filters panel, the filter button updates to show the number of filters applied once the panel is toggled closed. For example –  .
.
The filter settings are persistent within a session. If you go to another page the search results remain the same. For example, if you are on the Kill Chain page and go to the Threat Hunting page, the same records are displayed.
Each of the controls take effect immediately, except for a Time Type of absolute.
See the About Filters page for a complete description of these controls.
The filter settings are persistent for the current session. So they are maintained when you go to a new page.
You can configure a preset filter for all of your views on your User Profile.
Search Tool
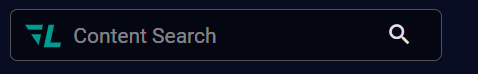
The search tool performs a simple search on the set of records displayed. Although easy to use, it is capable of complex search operations. For more information see the About Search page.
Selected Tenant
All records in the Stellar Cyber system are assigned to a tenant. In addition to the filter controls, search and query results can be narrowed to reflect only those records of a specific tenant. Alternatively, all tenants can be included.
Stellar Cyber users assigned to a tenant but who are not admin users cannot change the tenant setting.
Use the Select Tenant dropdown at the top right of the display to change the selected tenant.
See the About Tenants page for more information on Stellar Cyber tenants.
The Select Tenants setting is persistent within the current session and is maintained when you go to a new page.
Saved Query / Query Builder
Use the Query Builder to construct both simple and complex queries that search the Stellar Cyber database.
You can also save and retrieve queries.
See About Queries for a complete description on how to use queries.
The current query setting is persistent for the current session and is maintained when you go to a new page.
Current User
The Current User dropdown shows the name of the currently logged-in user and provides access to the following functions:
-
Pause Animation—lets you pause the animation of the XDR Kill Chain graphic.
-
Profile—lets you edit your user settings.
-
Logout—ends the current session and returns you to the Login page.
Utility buttons

The buttons at the upper right of the screen provide access to general utilities:
-
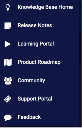
The question mark button opens a menu that provides access to the documentation and other tools, such as the Learning Portal, the Support Portal, and ways for you to provide direct feedback on the product roadmap and other features.
-
The heartbeat button opens the System Status page. When it is green, there are no outstanding system health issues.
-
 The thumbprint button is used to indicate the DP is in forensics mode. Click this button to jump to the Cold Storage Imports view and check status of the files being imported for analysis.
 -
 The alarm bell button shows you the number of unread system notifications. Click the button to launch the Notification Center. Users with appropriate access can specify rules that govern how system notifications are generated in the System Action Center.
 -
or Unset by default, the bookmark button is used to assign a different page to display when you click the Stellar Cyber logo (Home). When you navigate away from the XDR Kill Chain page (which is the default for Home), the gray bookmark button appears in the utility area. This indicates that the active page is not currently set as the Home page. If desired, click the button to set the active page as the new Home. When you are visiting the page that is currently set as home, the button is gold. Click the gold button to unset and restore the menu value to the system default of the XDR Kill Chain page; or visit another page and set the bookmark.
Note that any time the XDR Kill Chain is not configured as Home, it is added as a menu option in the Visualize menu's list of predefined Dashboards.