Asset Details
Stellar Cyber keeps track of assets in your system, using both imported and discovered data.
The Asset Details page shows all information related to the asset, including an embedded map that shows the asset's location. To see the details on an asset:
-
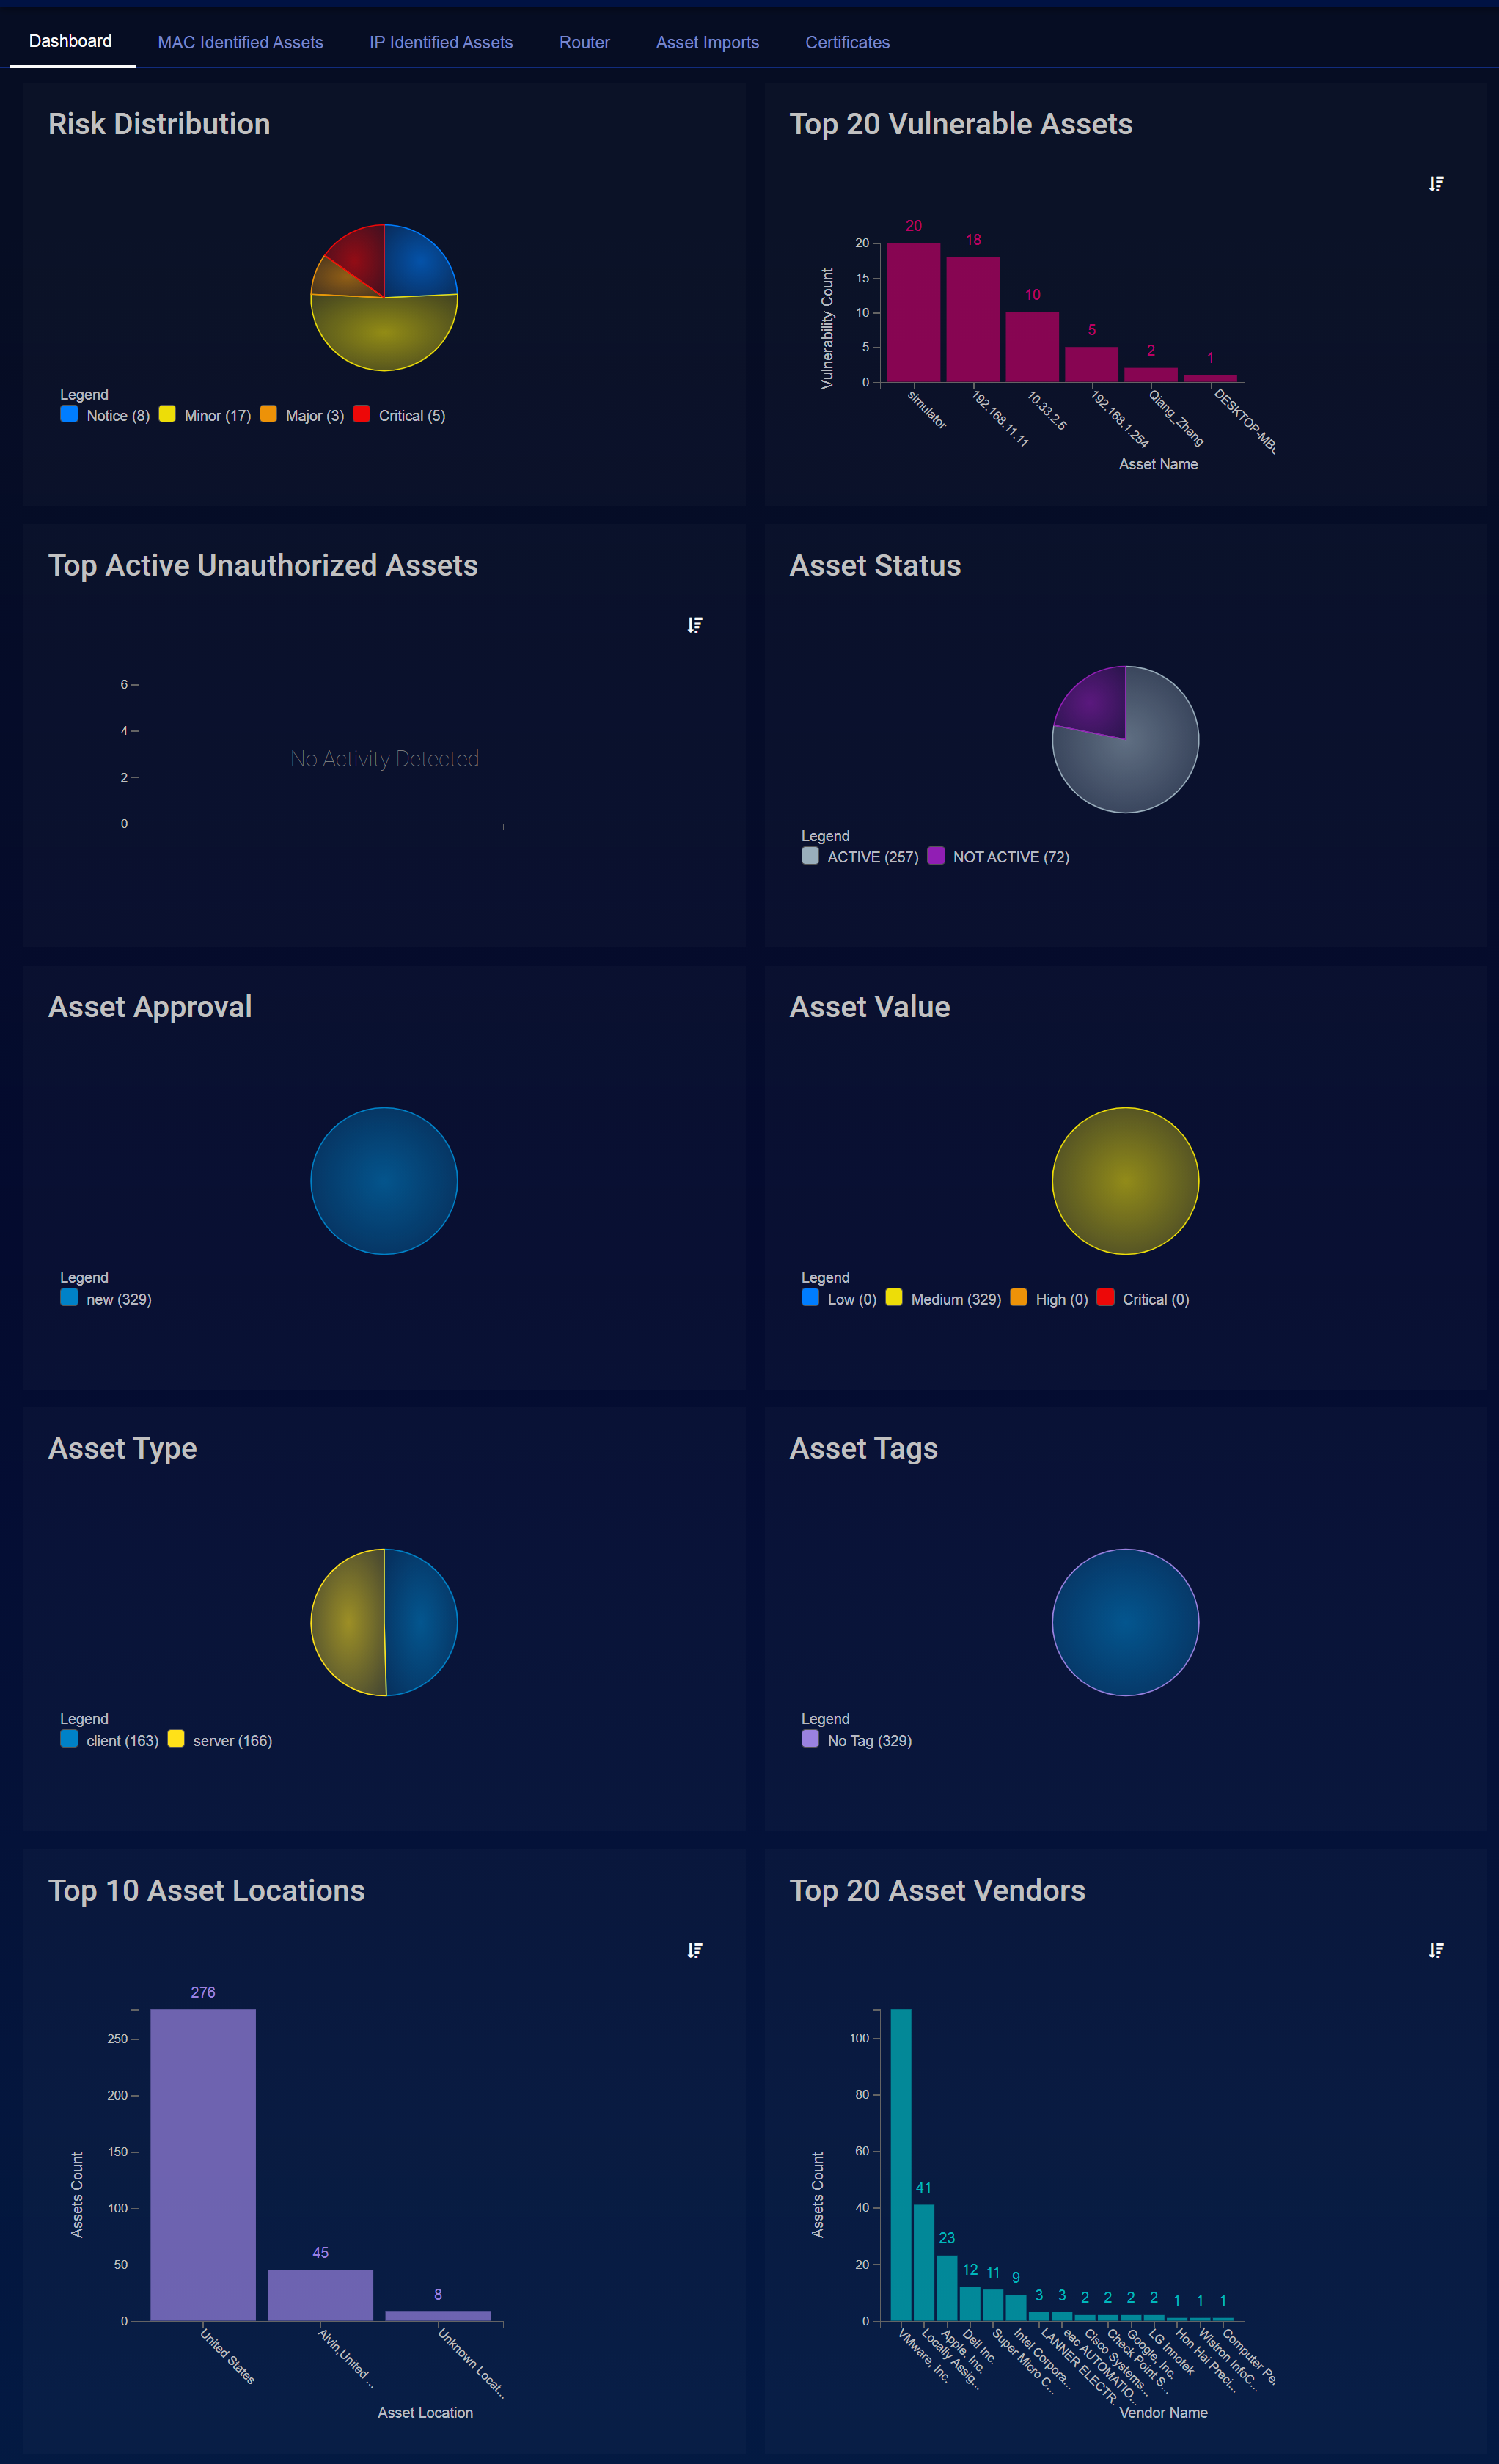
Click Investigate | Asset Analytics. The asset dashboard appears.
-
Click either MAC Identified Assets or IP Identified Assets. The associated table of assets appears.

-
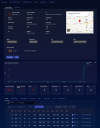
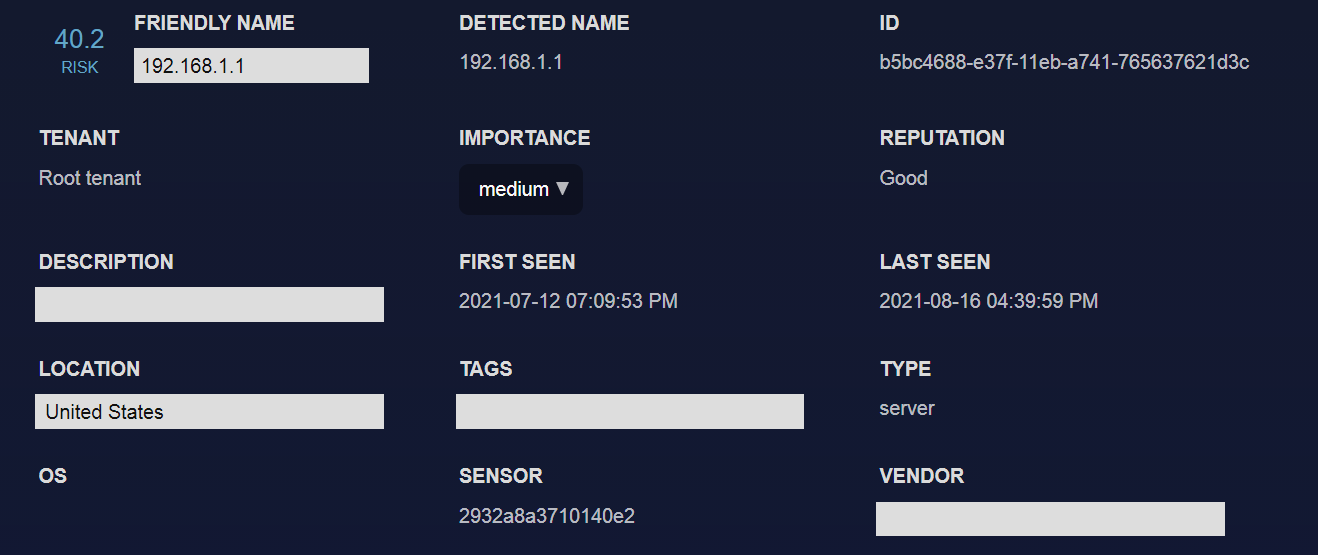
Click on the FRIENDLY NAME of the asset that interests you. The Asset Details appear. Following is an example for a MAC-identified asset:
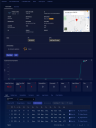
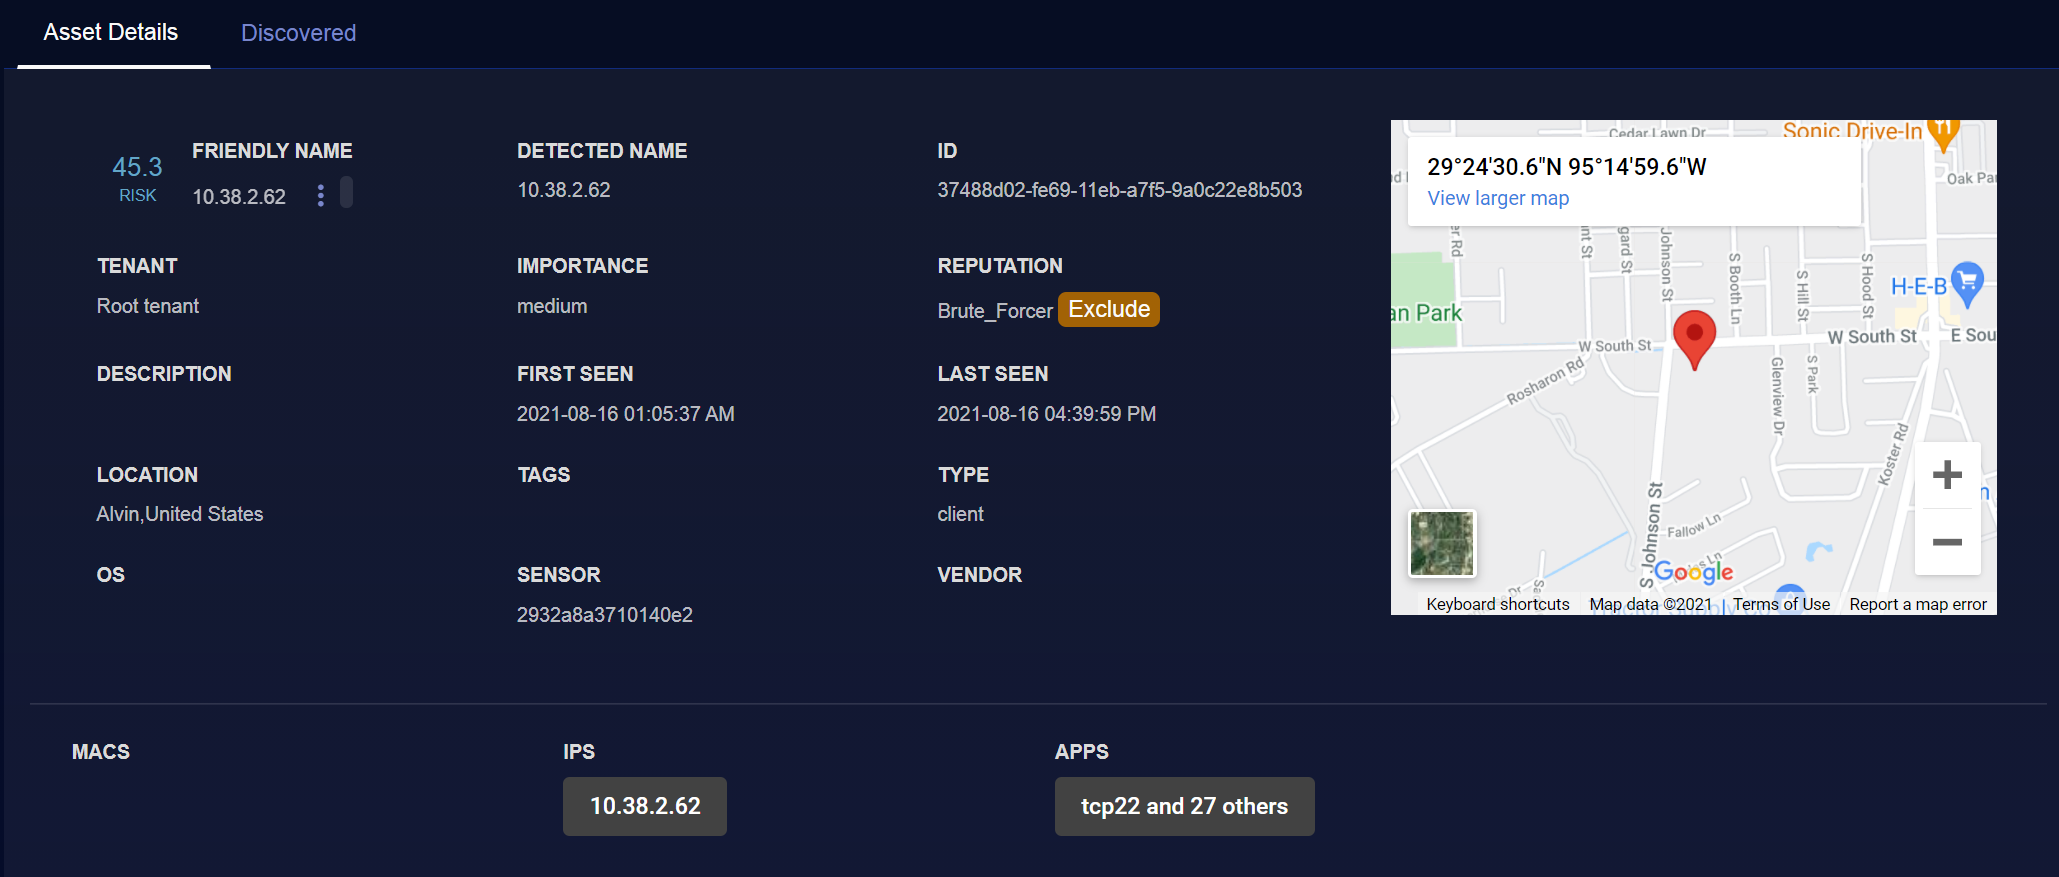
Following is an example for an IP-identified asset:
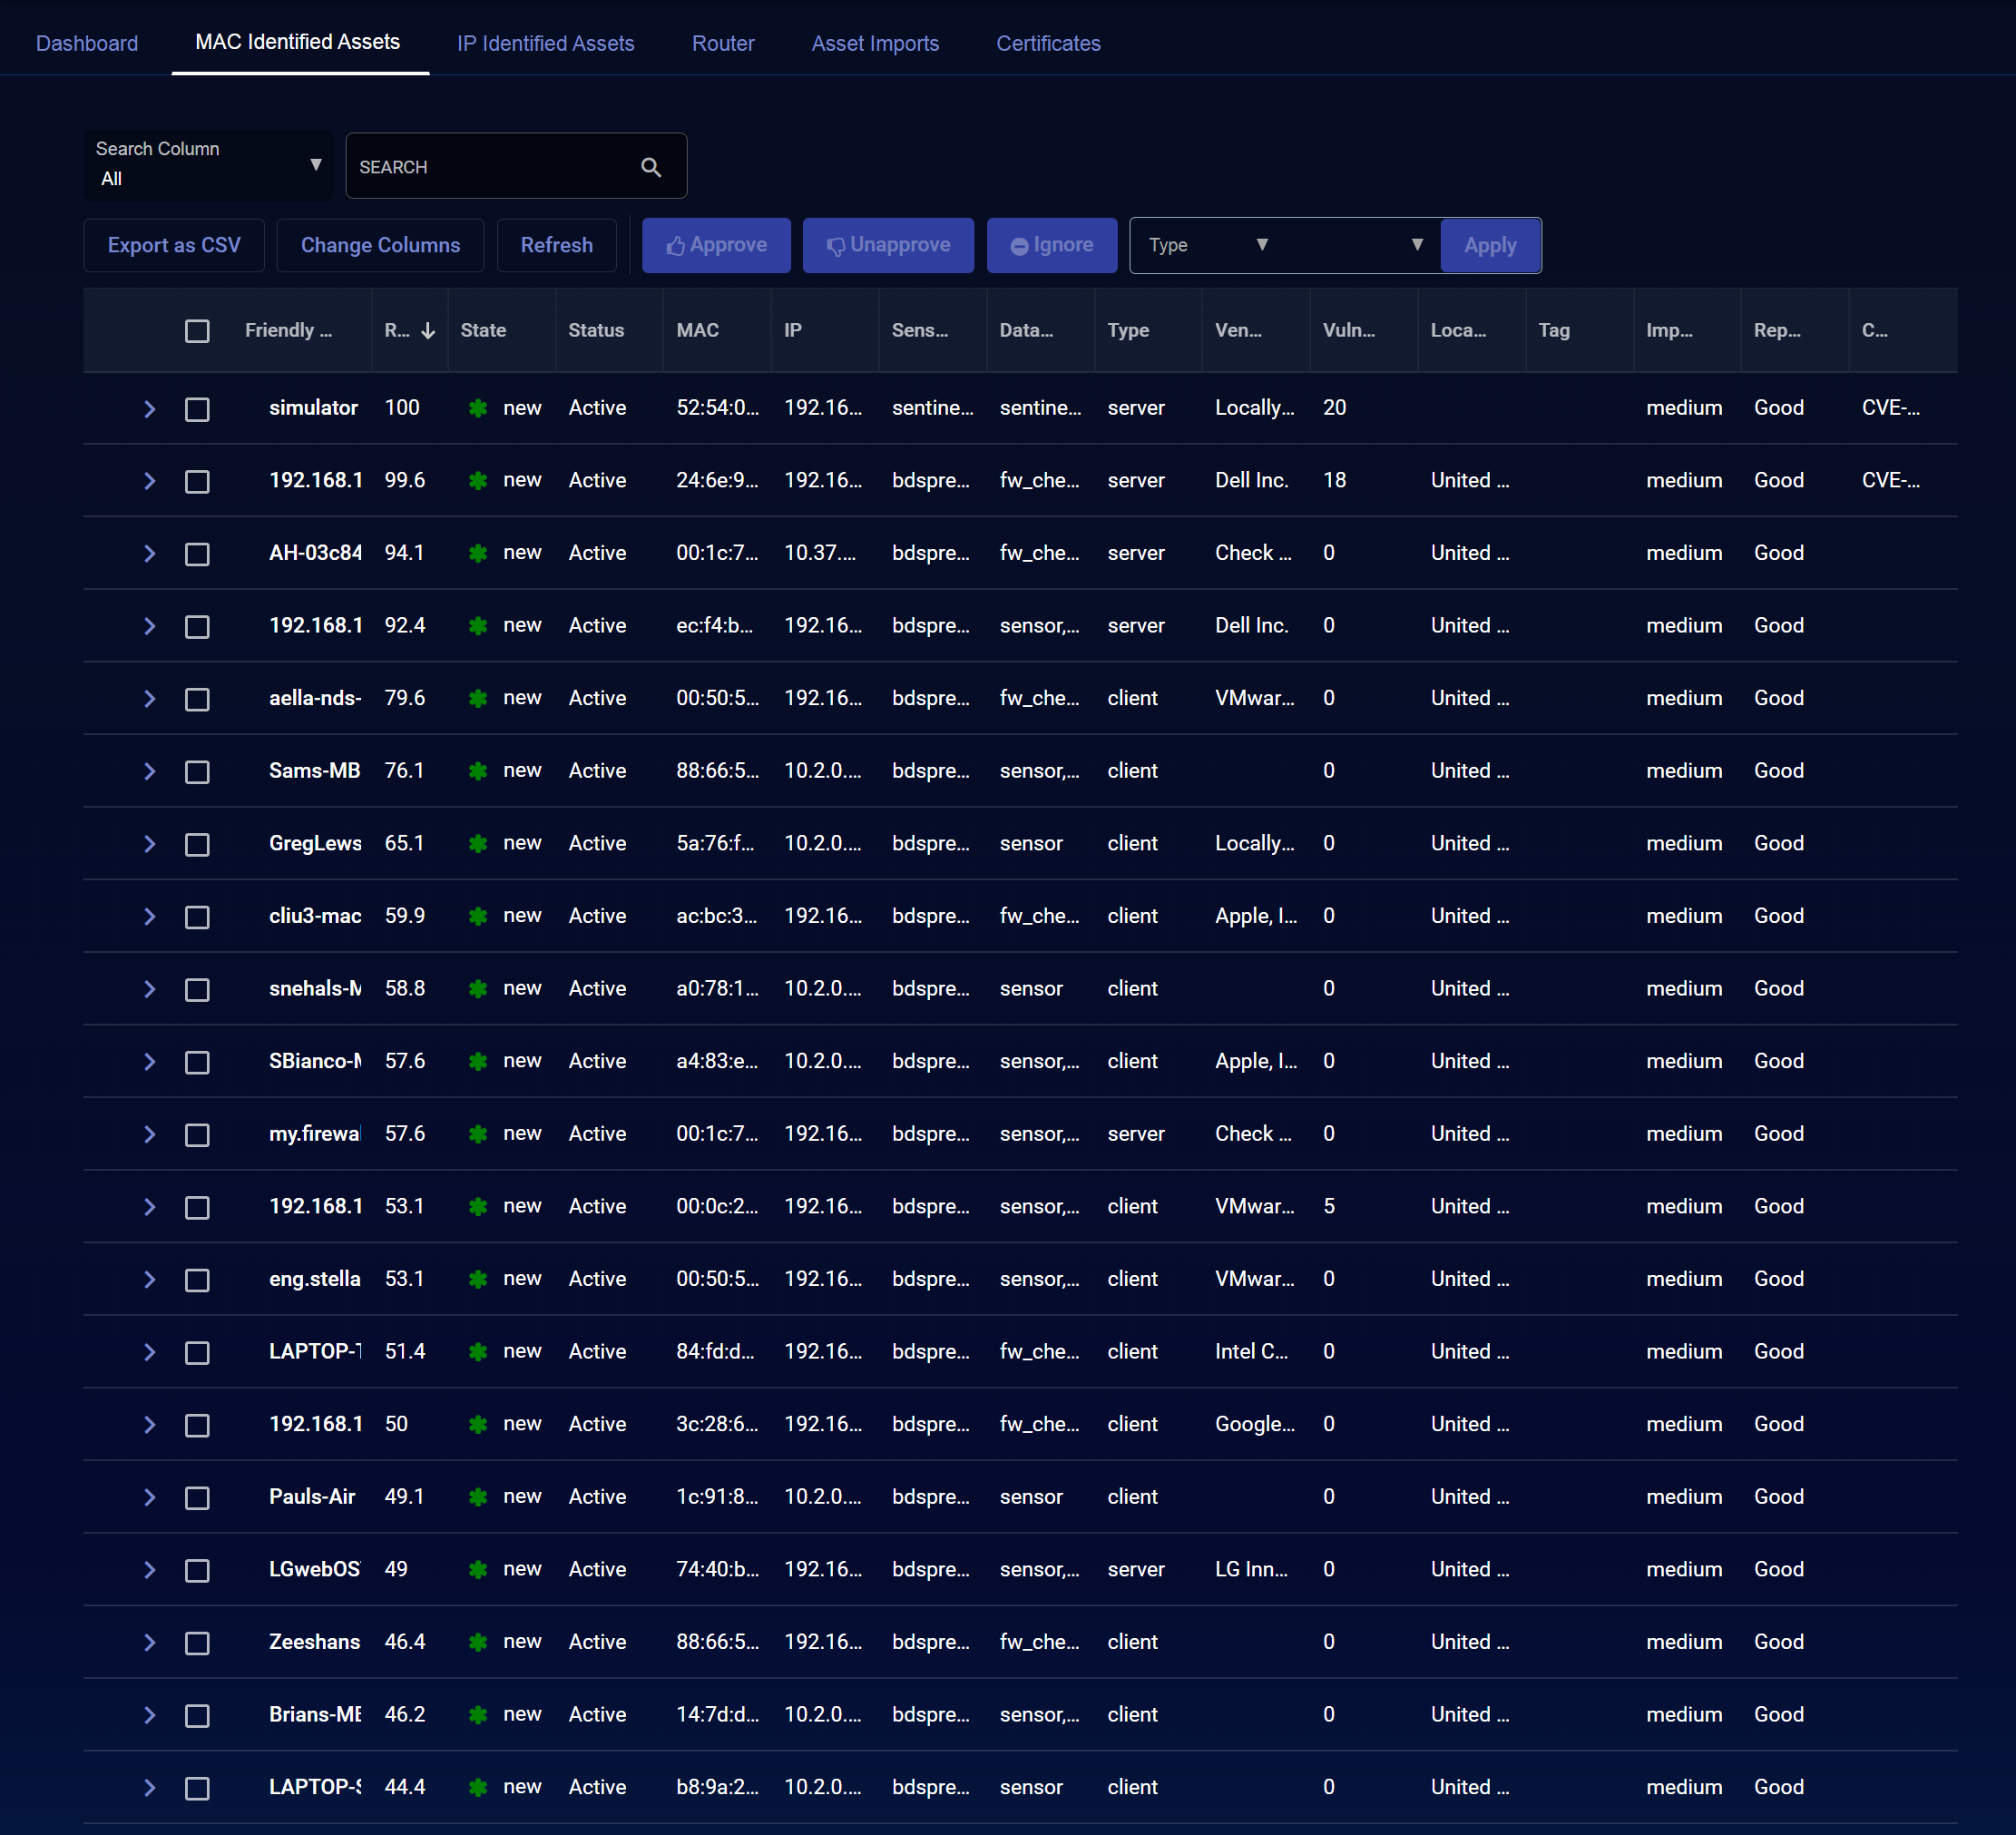

On the Asset Details page you can:
- View discovered data
- View statistics for the asset
- Exclude an asset from a Stellar assigned reputation
- Do further analysis on the friendly name, hostnames, and IP addresses
- Edit some of the fields
You can also view a table at the bottom of the Asset Details page listing associated Alerts, Related Users, Vulnerabilities, Commands, Logins, Login Failures, Files, and Server Statistics for the current asset. Keep in mind that the entries in these tables are all filtered by the global Filter settings at the top of the page (Alert Score, Sensor, Time, Tags, and so on).
Viewing Discovered Data
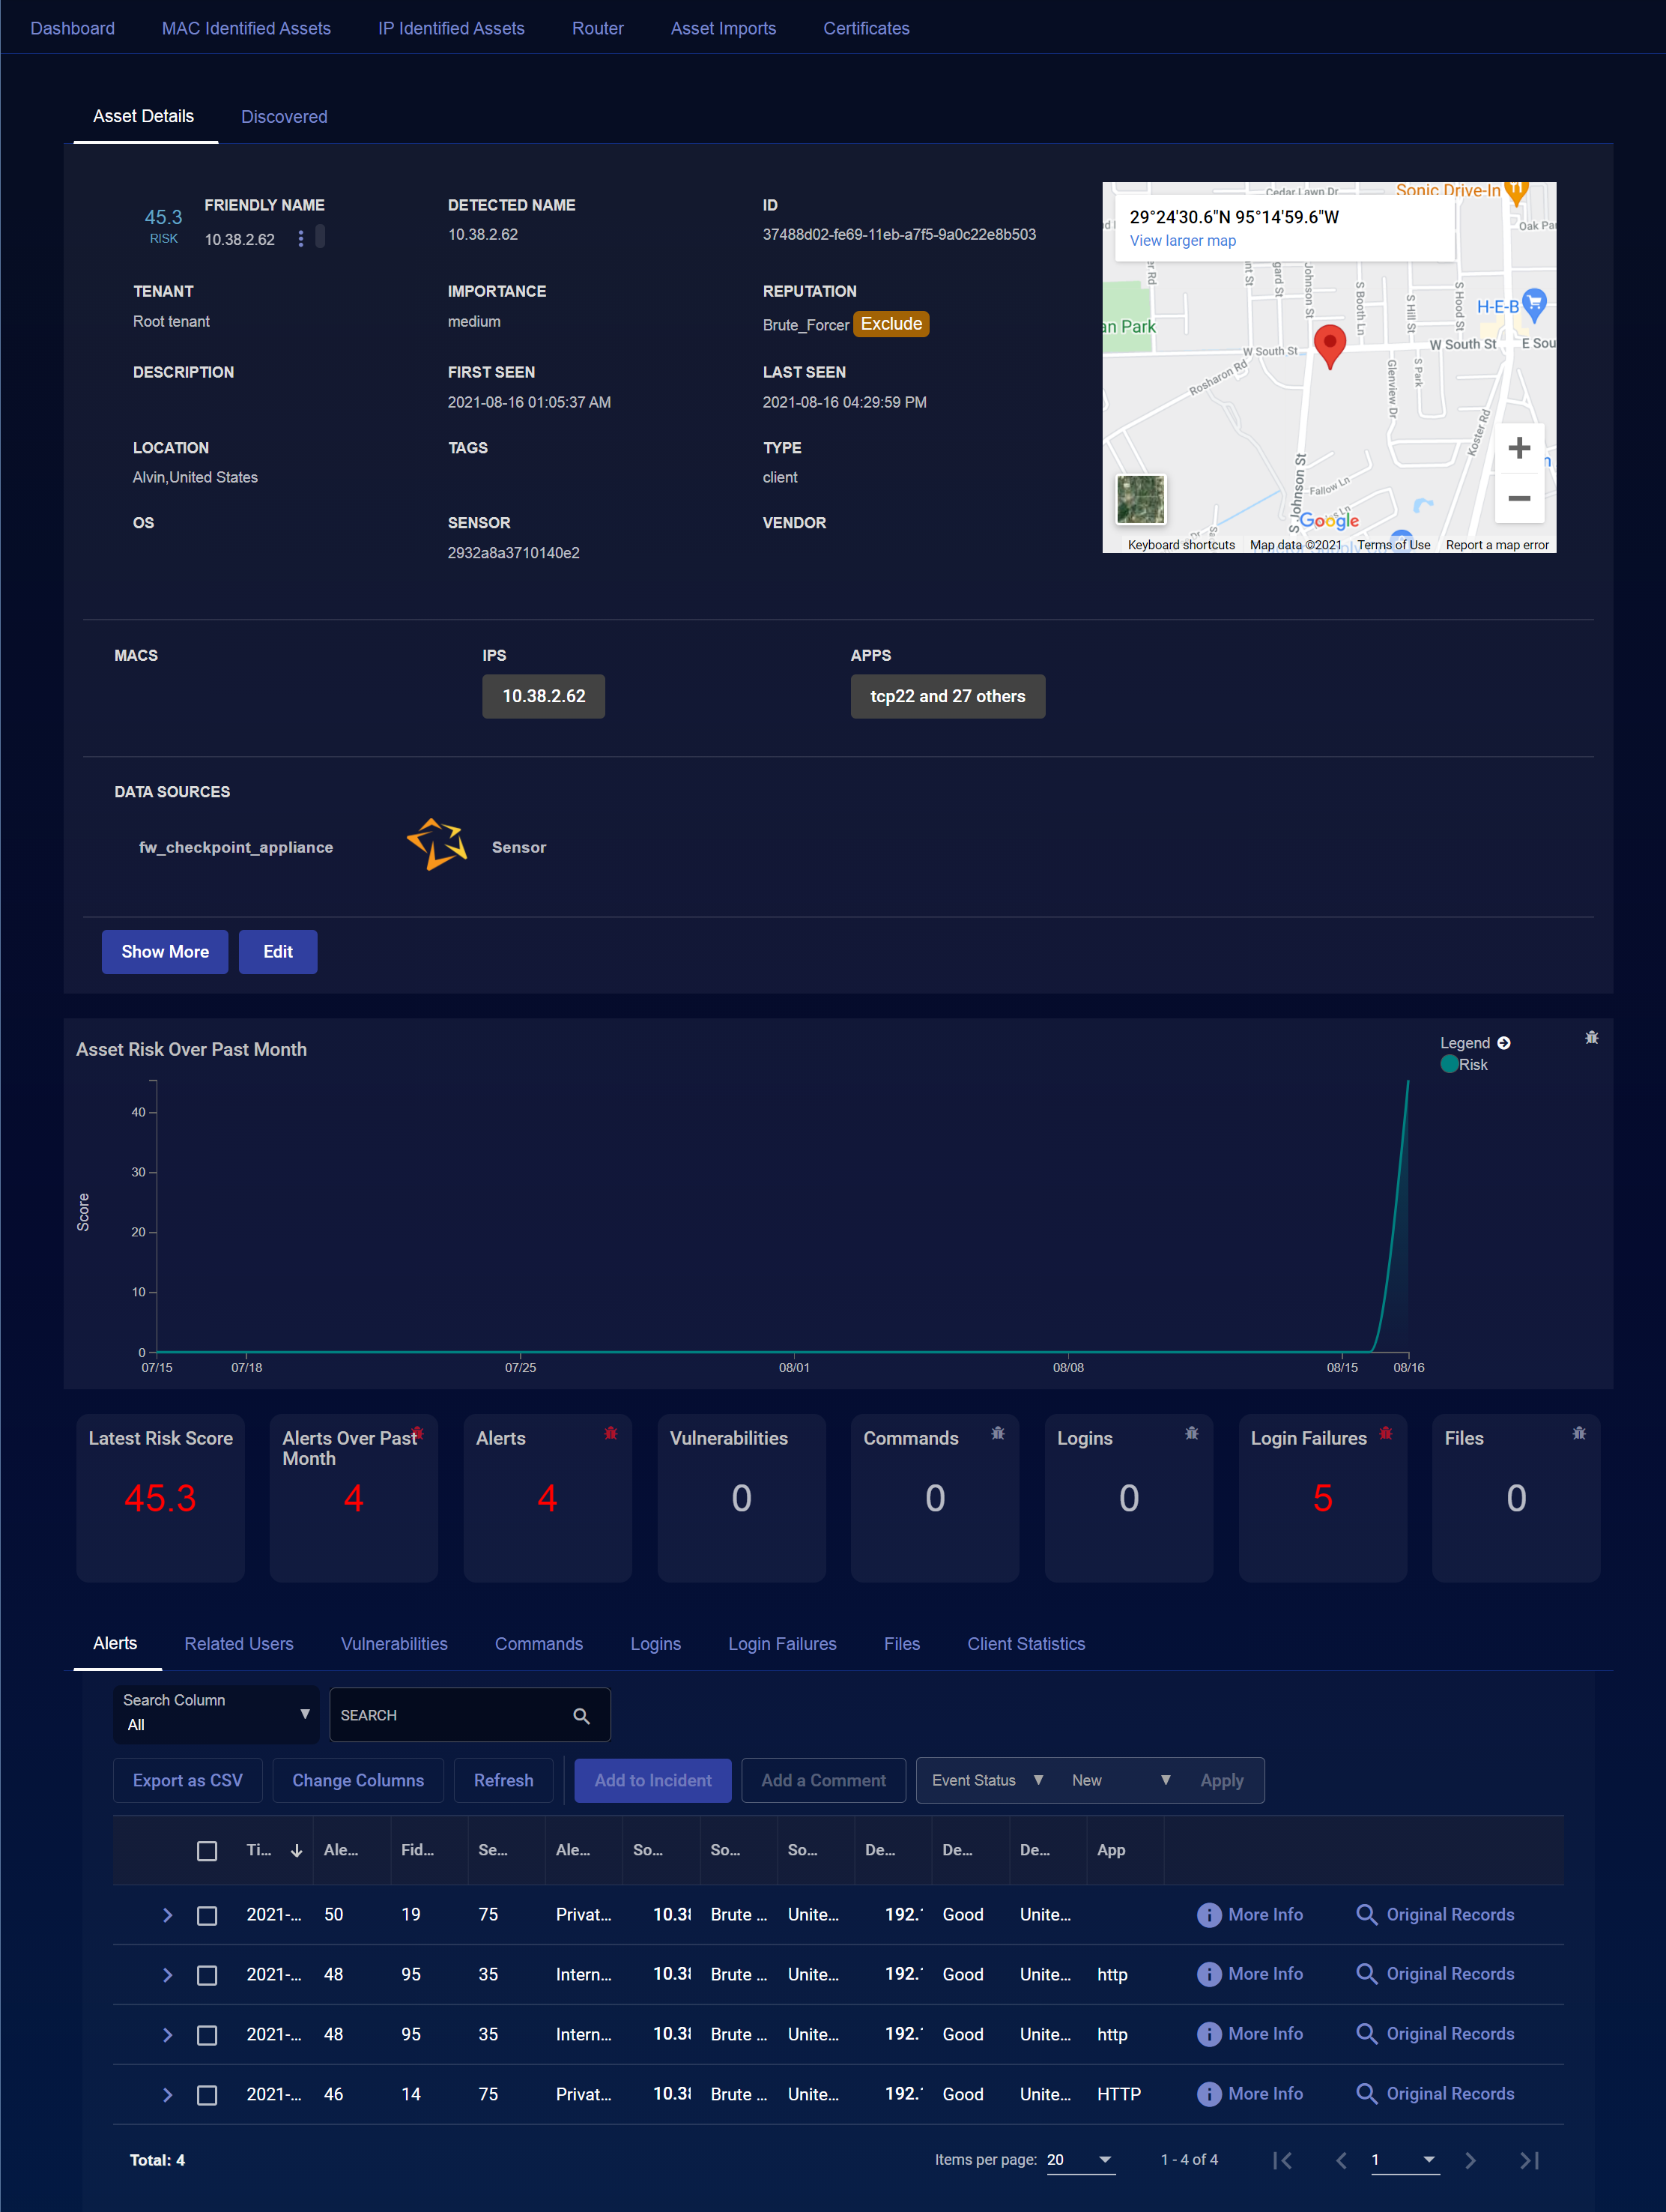
To see what Stellar Cyber has discovered about an asset, simply click Discovered. This tab displays all of the information that Stellar Cyber has gathered, as opposed to imported information. Following is an example of the Discovered tab for a MAC-identified asset:
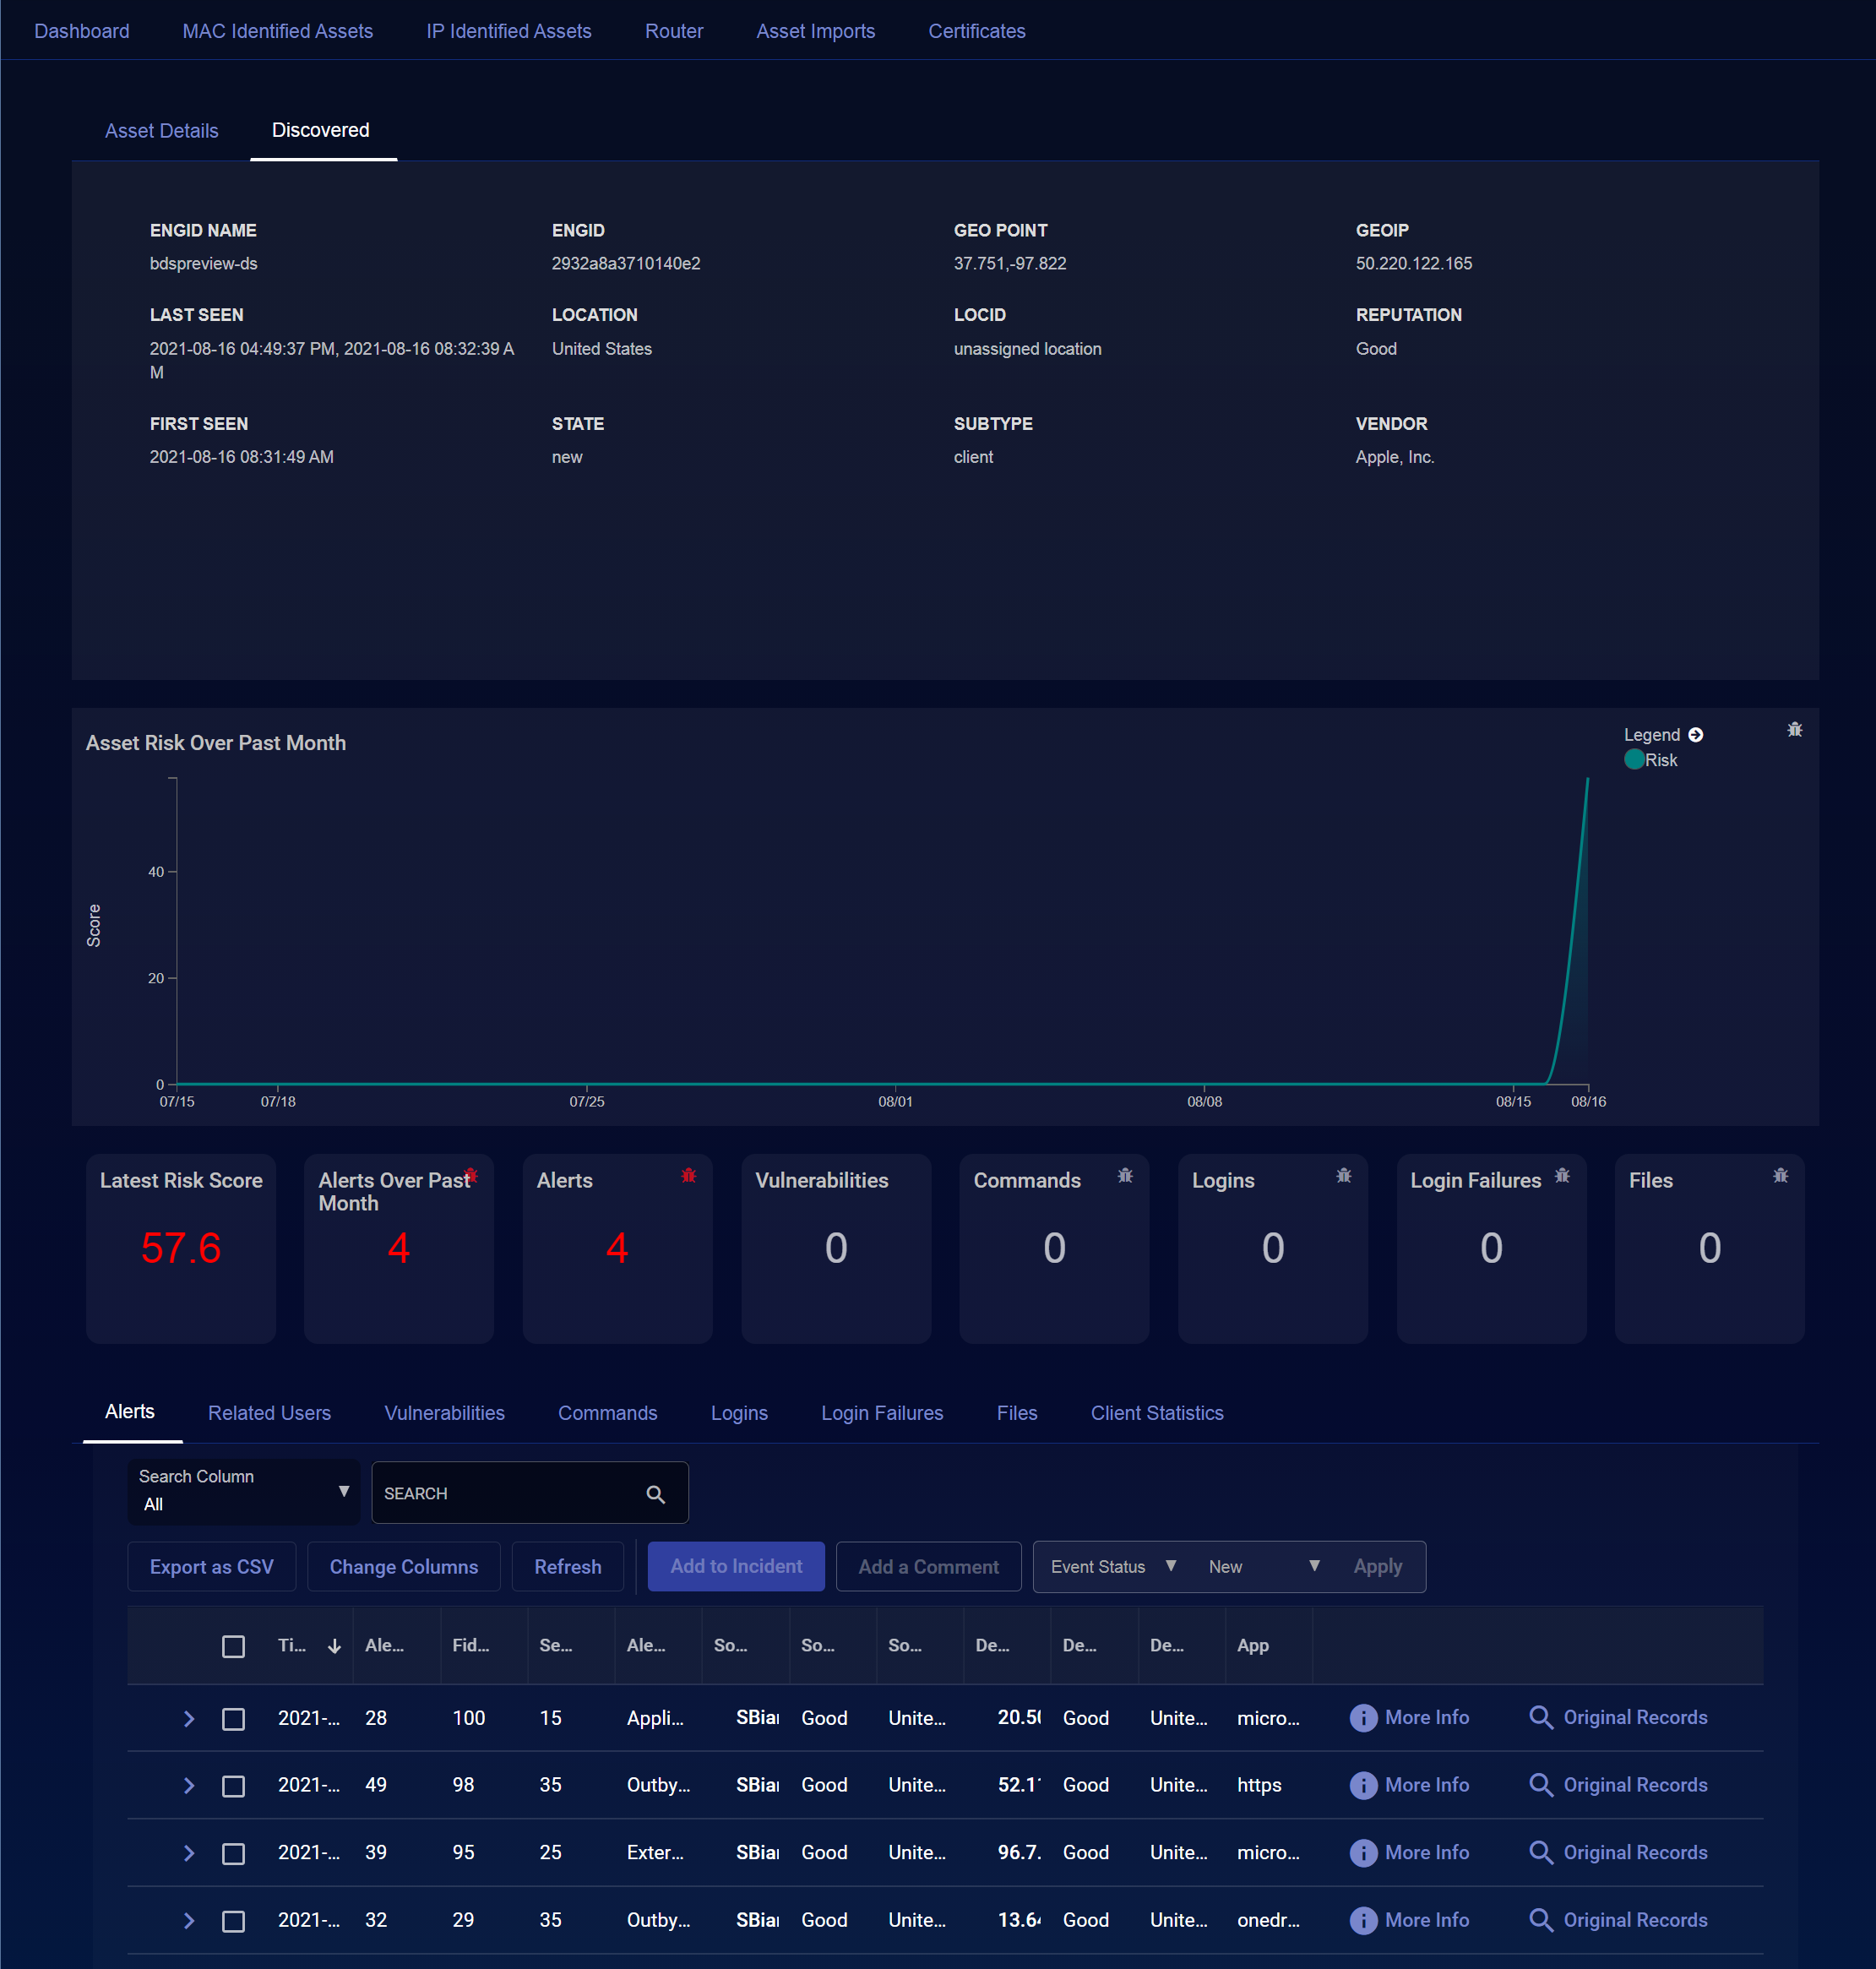
Following is an example of the Discovered tab for an IP-identified asset:
Viewing Asset Statistics
The lower section of the Asset Details page shows several counts, as well as the calculated risk score of the asset.
The calculated
- is calculated every 10 minutes
- includes open security events from the last 24 hours (if you close an event, it is removed from the next calculation)
- considers the
- weights many different alerts higher than large numbers of the same alert
Below the counts is a table listing events. This table is linked to the counts; you can click on one of the counts to display the associated events in the table. You can also click on the tabs above the table to change the display.
The available categories include:
- Alerts —This table contains a searchable list of alerts associated with the asset.
-
Vulnerabilities—This category provides a list of all detected vulnerabilities of the current asset. The table includes a column for accessing CVE records.
- Commands—Any captured commands of interest are listed in this section.
- Logins—Successful login events are shown in this table.
- Login Failures—Unsuccessful login events are shown in this table.
- Files—This table shows captured events involving files that might be associated with malware or exfiltration events.
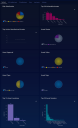
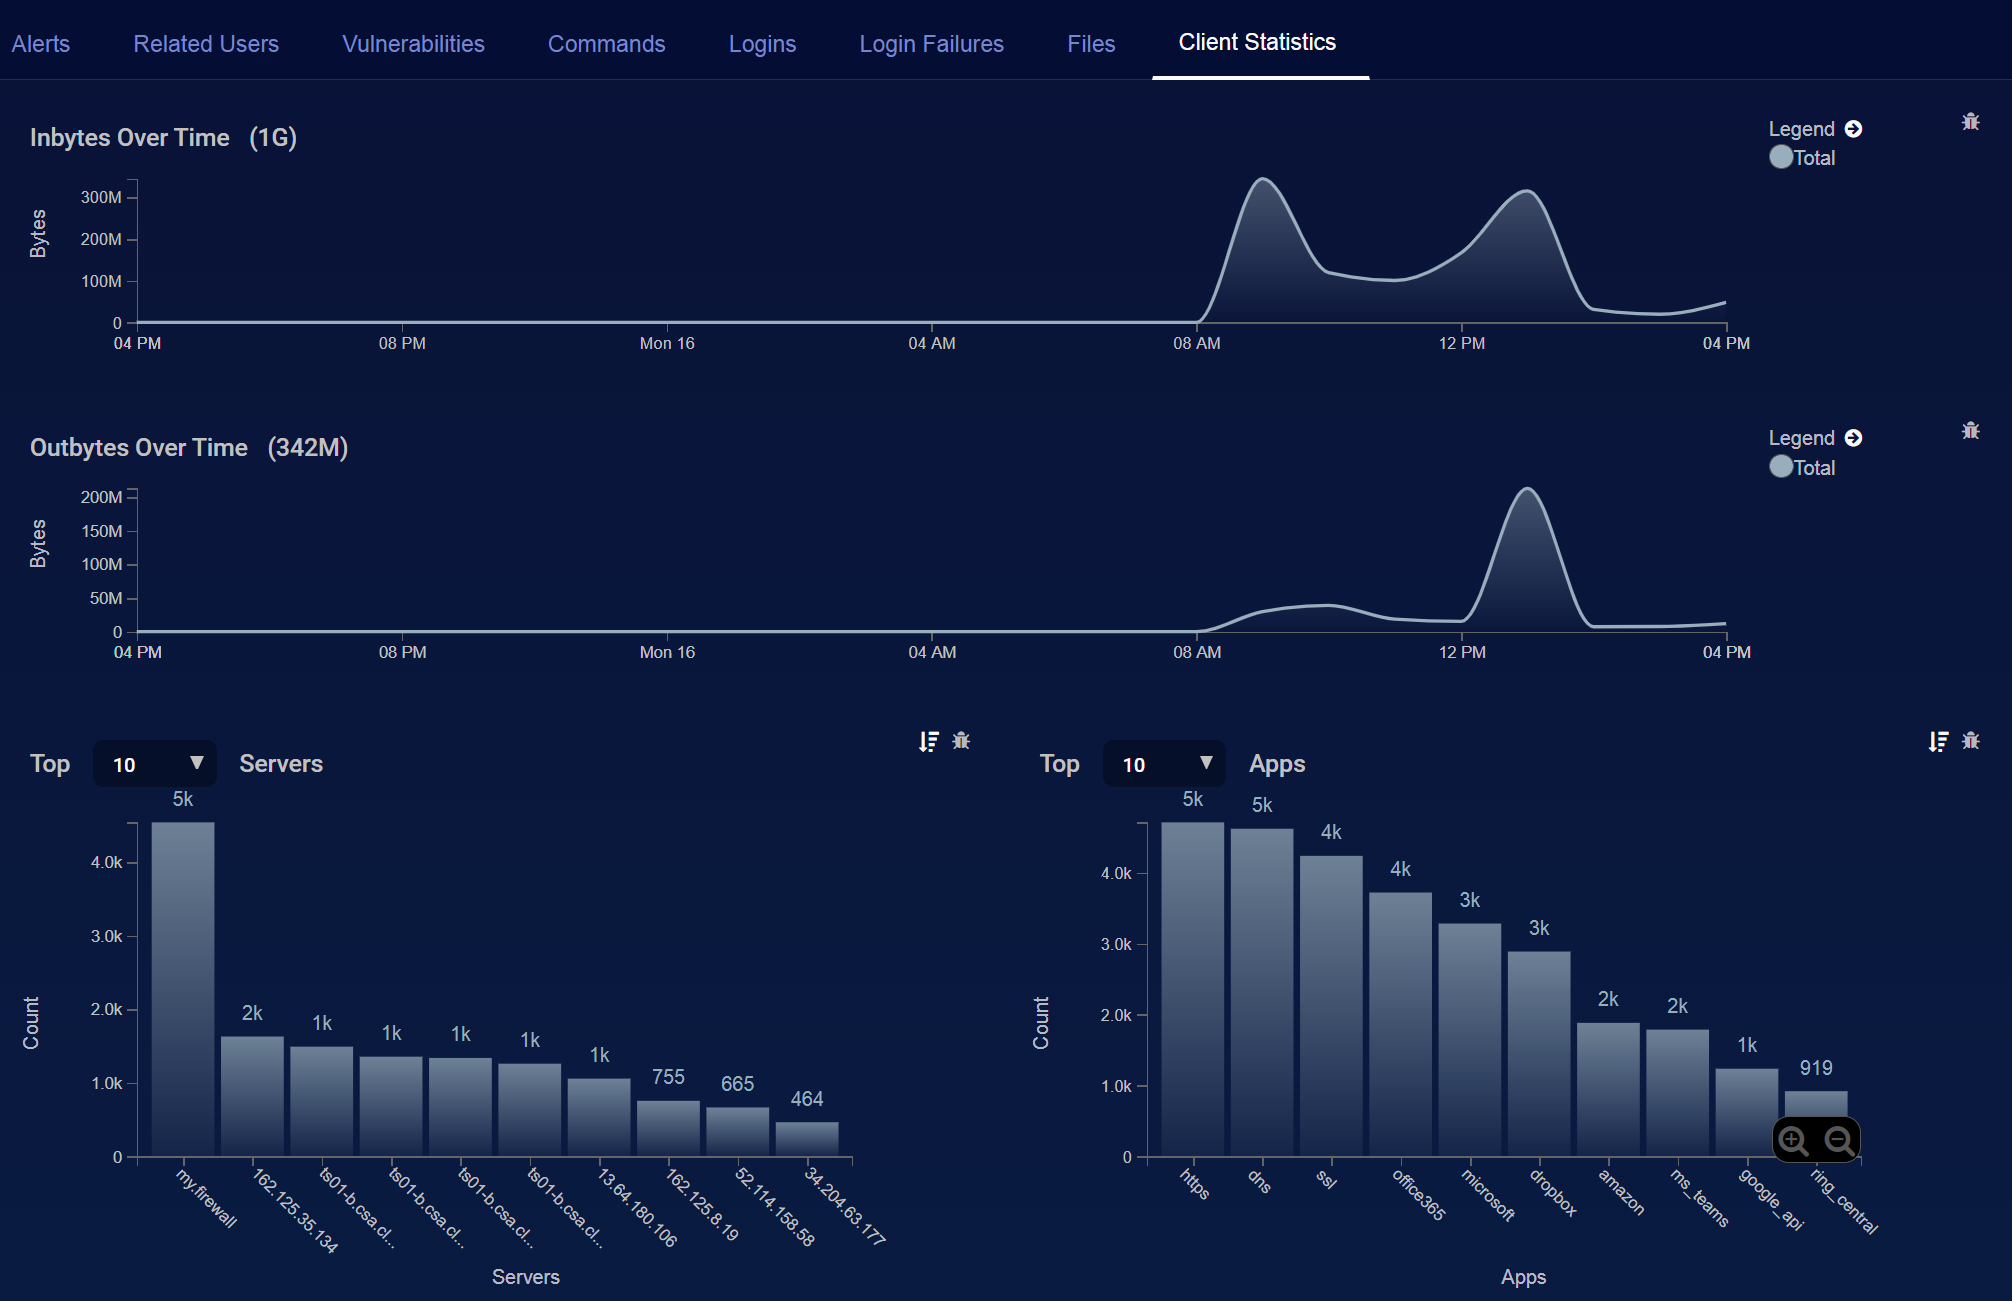
- Client Statistics—This category displays a set of graphics similar to the display in the image below. This provides a condensed assessment of the level of activity of the asset.
Excluding an Asset From a Stellar Assigned Reputation
If the asset has a Stellar assigned reputation, an Exclude button appears next to the Reputation.
Stellar Cyber monitors asset behavior, and if suspicious behavior is noted, can override an asset's reputation with a reputation assigned by Stellar Cyber. If the suspicious behavior was expected, simply click Exclude to remove the Stellar assigned reputation and exclude the asset from receiving a Stellar assigned reputation again. You can see a list of assets excluded from Stellar assigned reputations in the Excluded from Stellar Assigned Reputations table on the bottom of the Exclusions page.
Doing Further Analysis on the Friendly Name, Hostnames, and IP Addresses
To do further analysis on an asset using the friendly name:
-
Click the next to the name. The analysis menu appears.
- Select an option.
To do further analysis on an asset using the hostnames or IP addresses:
-
Click on the hostname or IP address. Additional hostname or IP addresses appear.
-
Click on one of the hostnames or IP addresses. The analysis menu appears.
-
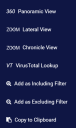
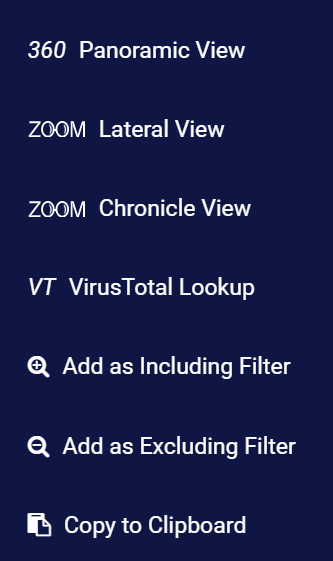
Select an option. Depending on the data displayed, the following options may be displayed:
-
Asset Detail View – Opens the Investigate | Asset Analytics | Asset Details tab for the selected friendly name, hostname, or IP address as the filter.
-
360 Panoramic View – Opens the Investigate | Panoramic view with the selected friendly name, hostname, or IP address as the filter.
-
ZOOM Lateral View – Opens Investigate | Threat Hunting to the ZOOM tab. The Lateral view displayed with the friendly name, hostname, or IP address as the focus.
-
ZOOM Chronicle View – Opens Investigate | Threat Hunting to the ZOOM tab. The Chronicle view displayed with the friendly name, hostname, or IP address as the focus.
The ZOOM feature is deprecated in 4.3.7 and will be removed in a future release.
-
VT VirusTotal Lookup – Performs a lookup on virustotal.com for the selected friendly name, hostname, or IP address.
-
Add as Including Filter – Creates a filter to display only those events containing the value in the field.
-
Add as Excluding Filter – Filters out those events containing the value in the field.
-
Copy to Clipboard – Copies the field value to the clipboard so it can be pasted elsewhere.
-
Related Alerts – Opens Investigate | Threat Hunting to the Interflow tab with a search performed on the corresponding entity.
-
Editing Asset Information
You can edit some asset information:
-
Click Investigate | Asset Analytics. The asset dashboard appears.
-
Click either MAC Identified Assets or IP Identified Assets. The associated table of assets appears.
- Click on the FRIENDLY NAME of the asset that interests you. The Asset Details appear.
-
Click Edit. You can now edit fields such as the friendly name, importance, tags, description, and others.

- Click Save.
Your changes are immediately saved.
