Sensor Details
You display the Sensor Details page by clicking on the name of any sensor in the sensor overview. In response, the Sensor Details page appears with detailed statistics on the selected sensor in the following broad categories:
-
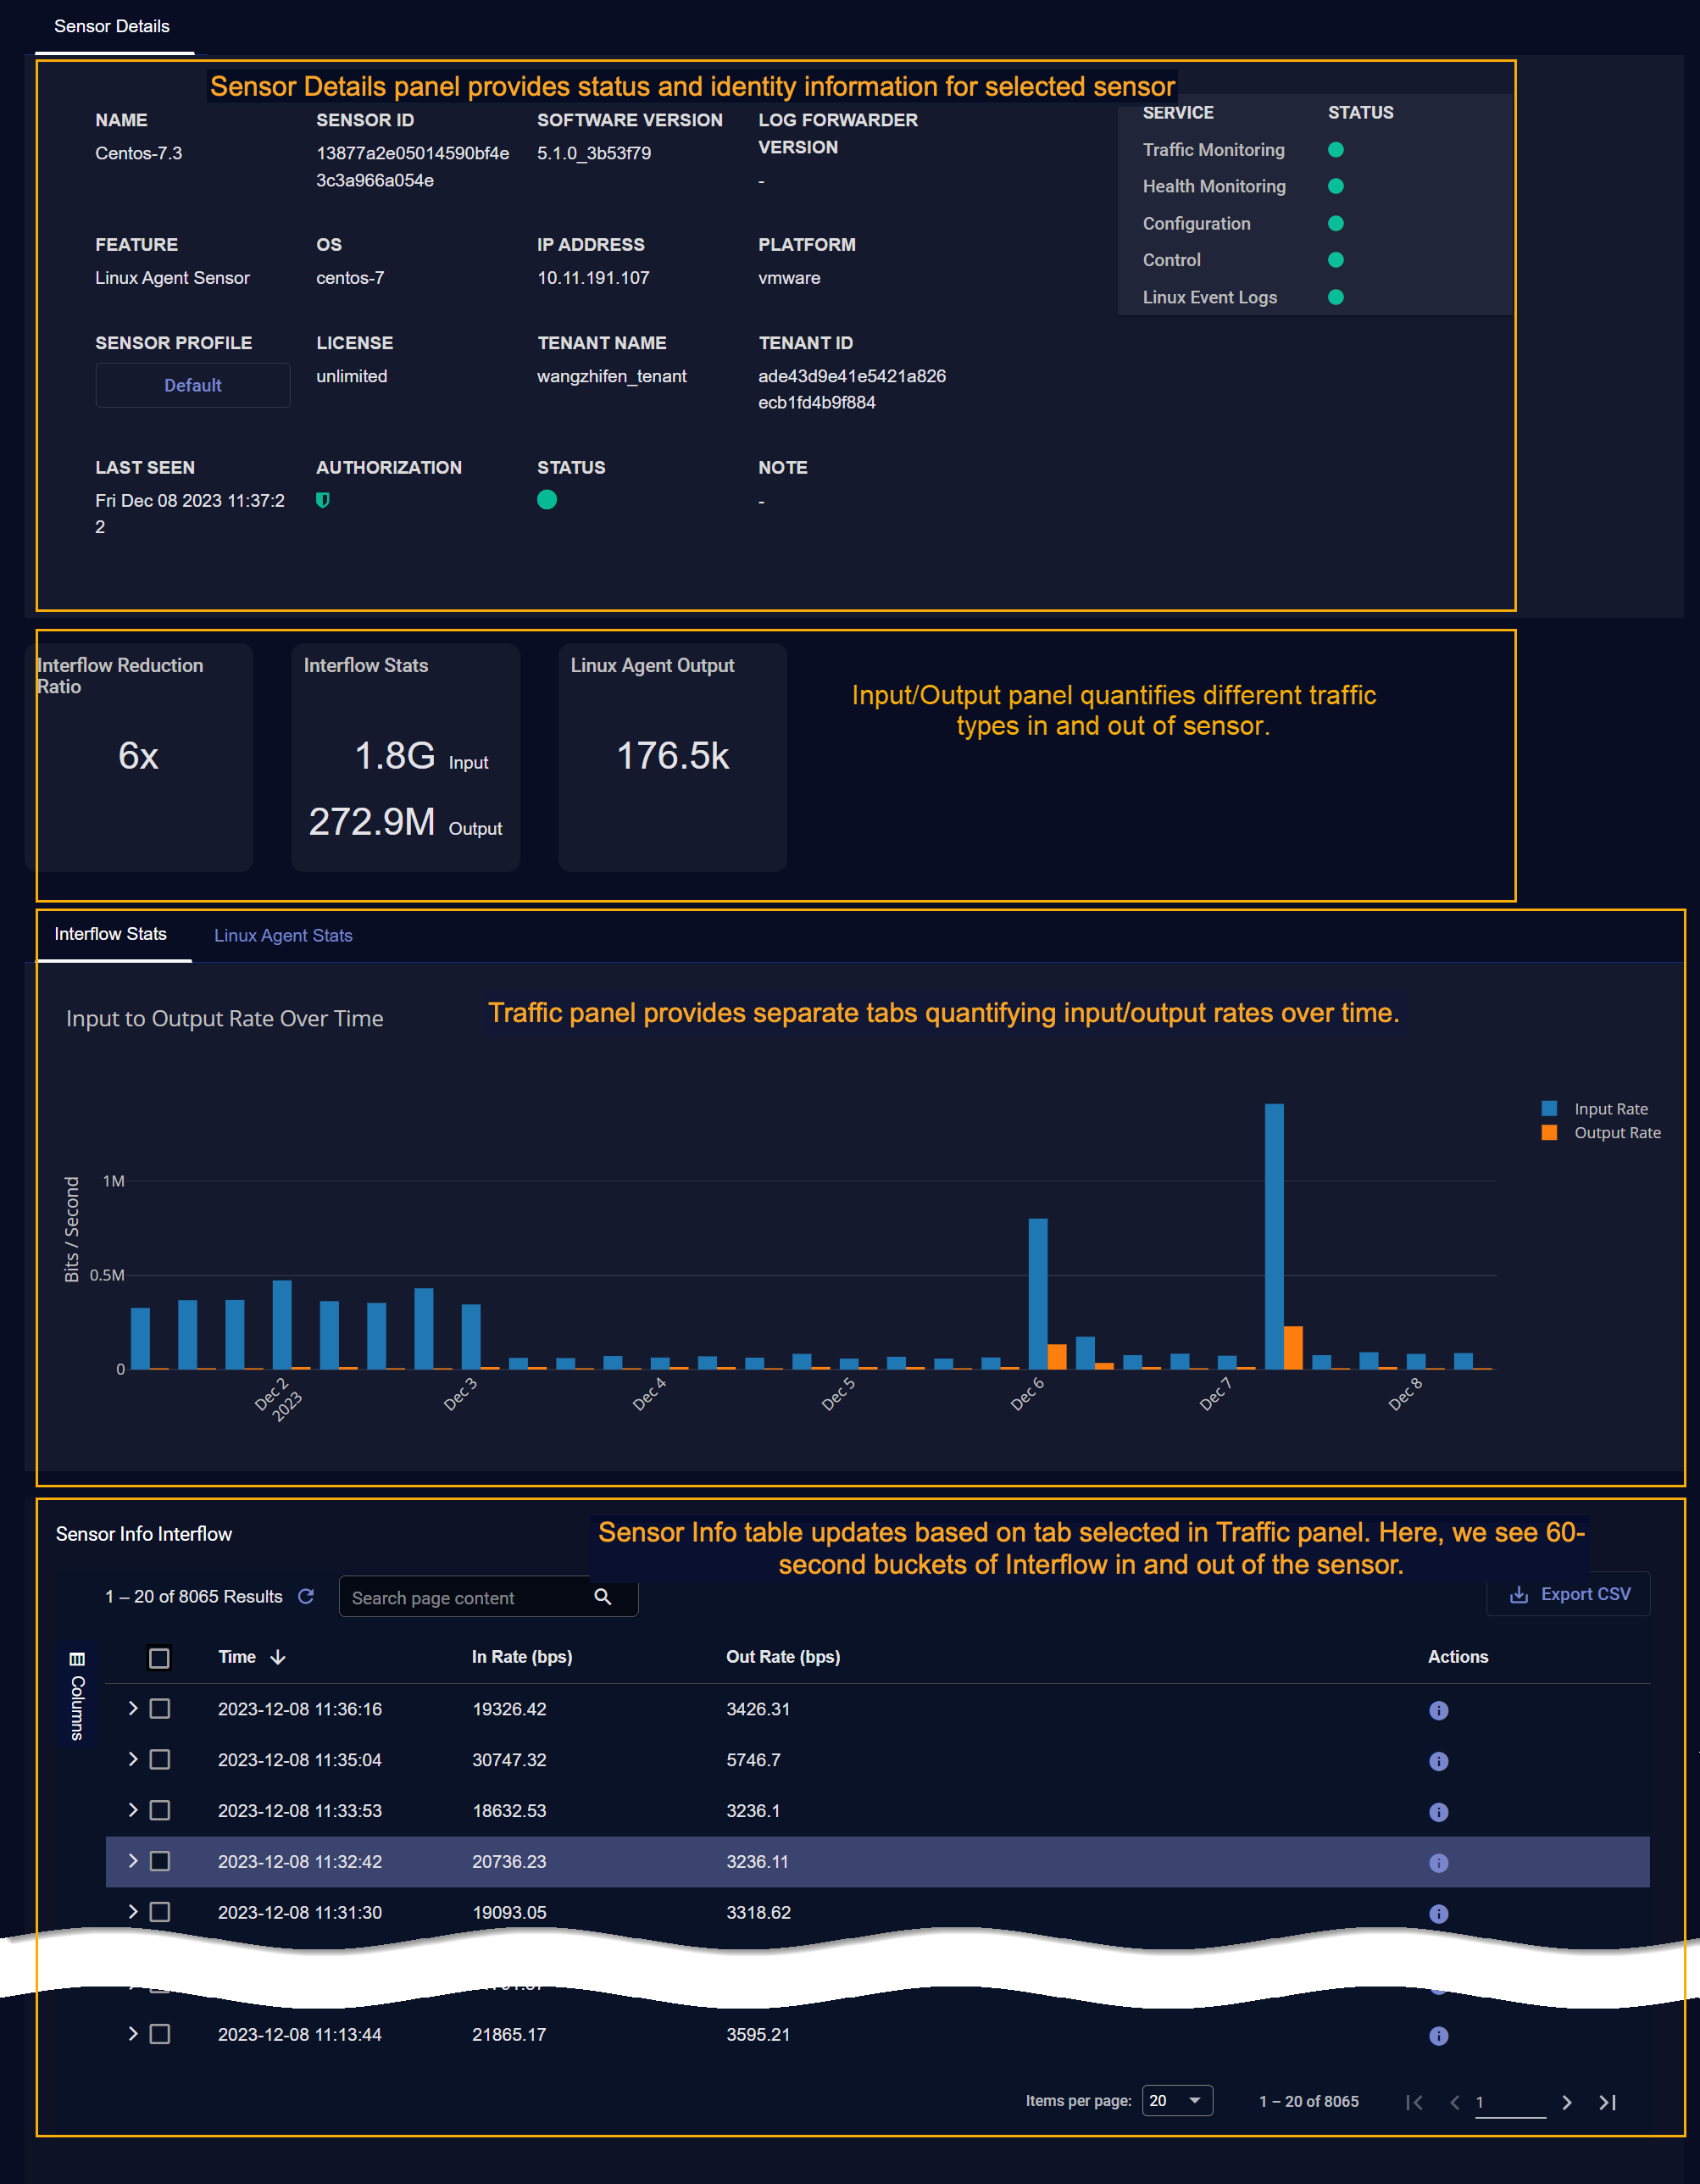
Sensor Details Panel provides identifying information for the selected sensor, including name, ID, version, OS, sensor profile, license, tenant information, and status.
-
Input/Output Panel breaks down traffic statistics for the sensor for different traffic types since the last time the sensor services were restarted. The exact traffic types shown depend on the sensor type and enabled features.
-
Traffic Graphs show input and output rate over time for Interflow Reduction Ratio and Interflow Stats in separate tabs. Other additional tabs appear depending on the sensor type and the features enabled in its sensor profile.
-
Sensor Info table is below the Traffic Graphs and displays different information based on the tab selected in the Traffic Graphs. For example, when the Interflow Stats tab is selected, the Sensor Info table provides a list of the one-minute buckets of Interflow data sent to the DP along with filterable metadata for those buckets.
-
The figure below illustrates the location of each of these components in the Sensor Details page.
Sensor Details Panel
The Sensor Details panel is located at the top of the page and provides the following information:
-
Name – The friendly name assigned to this sensor when it was added to the DP.
-
Sensor ID – The internal identifier for the sensor.
-
Software Version – The version of Stellar Cyber sensor software installed on the sensor.
-
Log Forwarder Version – The version of the log forwarder software installed on the sensor.
-
Feature – The type of sensor. For example, Modular Sensor, Linux Agent Sensor, and so on.
-
OS – The operating system in which the sensor is installed. For example, a specific Linux distribution or Windows operating system.
-
IP Address – The IP address assigned to the sensor's Manage port.
-
Platform – The virtualization platform in which the sensor is installed. For example, KVM, qemu, vmware, Amazon Web Services, and so on.
-
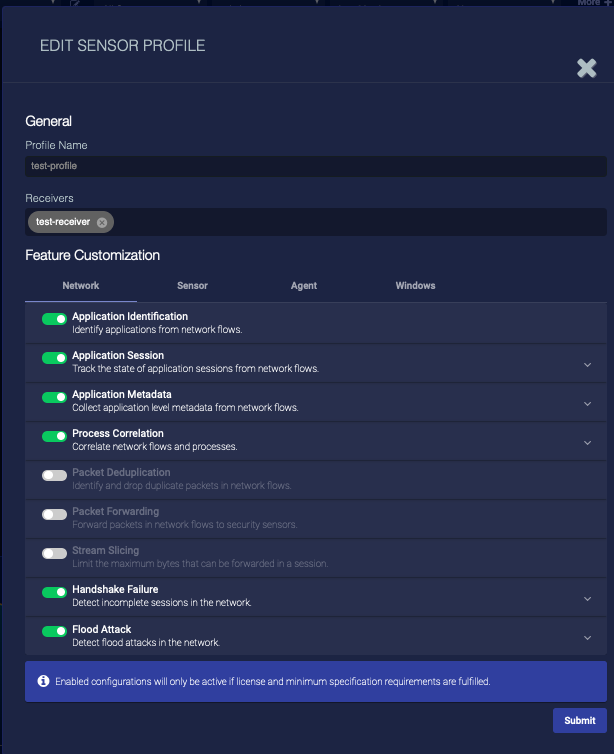
Sensor Profile – The sensor profile assigned to this sensor. You can click on this entry to edit the assigned profile.
-
License – The type of license applied to this sensor.
-
Tenant Name – The friendly name of the tenant to which this sensor is assigned.
-
Tenant ID – The system name of the tenant to which this sensor is assigned.
-
Last Seen – The last time at which this sensor was seen by the DP.
-
Authorization – An icon indicating whether this sensor is authorized or unauthorized.
-
Status – Sensor Status LEDs indicating a variety of possible error conditions on the sensor. If the icon is anything other than green, you can hover your mouse over the LED to see a tooltip listing the error condition.
-
Note – If a note has been assigned to the sensor in the Sensor Overview page, it appears here.
-
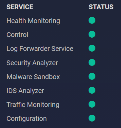
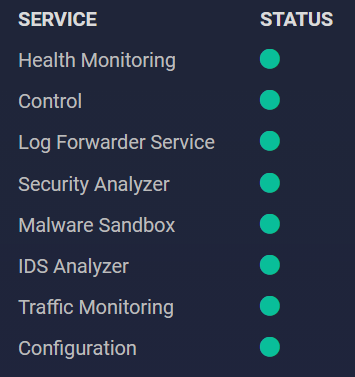
Service Status Panel – A set of color-coded buttons provide high-level visual status of key services, as illustrated below.
Input/Output Panel
The counters in the Input/Output panel provide a historical record of the data handled by the sensor since the last time its services were restarted.
The input/output statistics in this panel are initially reported in bytes, but increase to megabytes and then gigabytes as the quantity increases. The units in use are reported together with the counter; for example, 612.2M, 4.8G, and so on.
-
Interflow Reduction Ratio – The ratio of Interflow Input to Interflow Output for this sensor since it was last restarted. This value is calculated by dividing the input value by the output value.
-
Interflow Input – The total bytes of the Interflow records created by this sensor based on ingested raw data since it was last restarted.
-
Interflow Output – The total bytes of the Interflow records sent by this sensor to the DP since it was last restarted. The Output value is less than the Input value after records are summarized and deduplicated.
-
Log Forwarder Output – The total bytes of log forwarder data sent by this sensor to the DP since it was last restarted. Note that the value shown for Log Forwarder Output is typically larger than the corresponding Input value because of parsing and enriching performed by the sensor.
-
Log Forwarder Input – The total bytes of log forwarder data ingested by this sensor since it was last restarted.
-
ML-IDS/Malware Sandbox Output – The total bytes of data sent by this sensor to the Malware Sandbox for analysis since it was last restarted.
Note that the values shown in the Input/Output panel are all counted since the time the sensor services were last restarted. They are unaffected by the standard time filters at the top of the display.
Traffic Graphs
The Traffic Graphs panel provides the tabs described in the following sections:
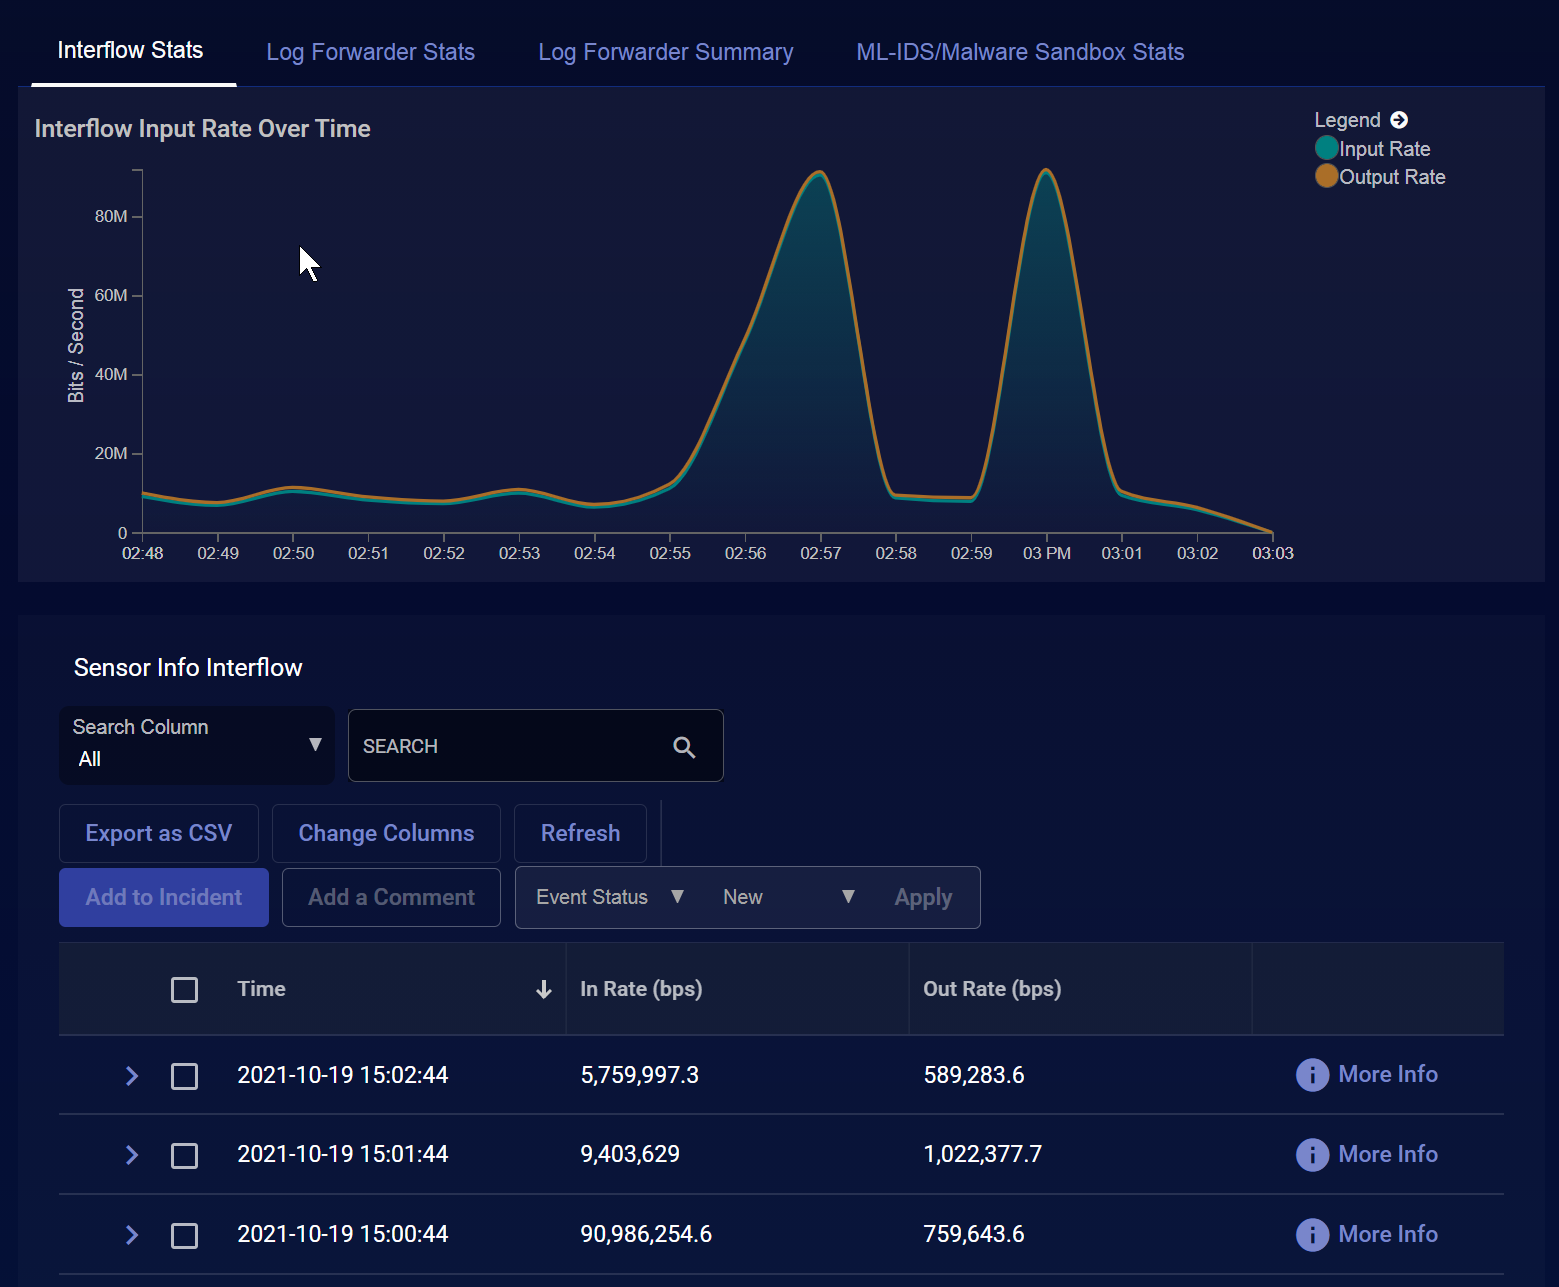
Interflow Stats
The Interflow Stats tab shows the rate of Interflow input and output over the time interval selected using the standard filter controls at the top of the page. Separate
When the Interflow Stats tab is displayed, you can also see the Sensor Info Interflow table below the graph. This table provides separate entries with metadata for each one-minute bucket of Interflow statistics processed and output to the DP. In addition to the standard table controls, you can also use an entry's More Info button to open the Event Details panel for the corresponding entry.
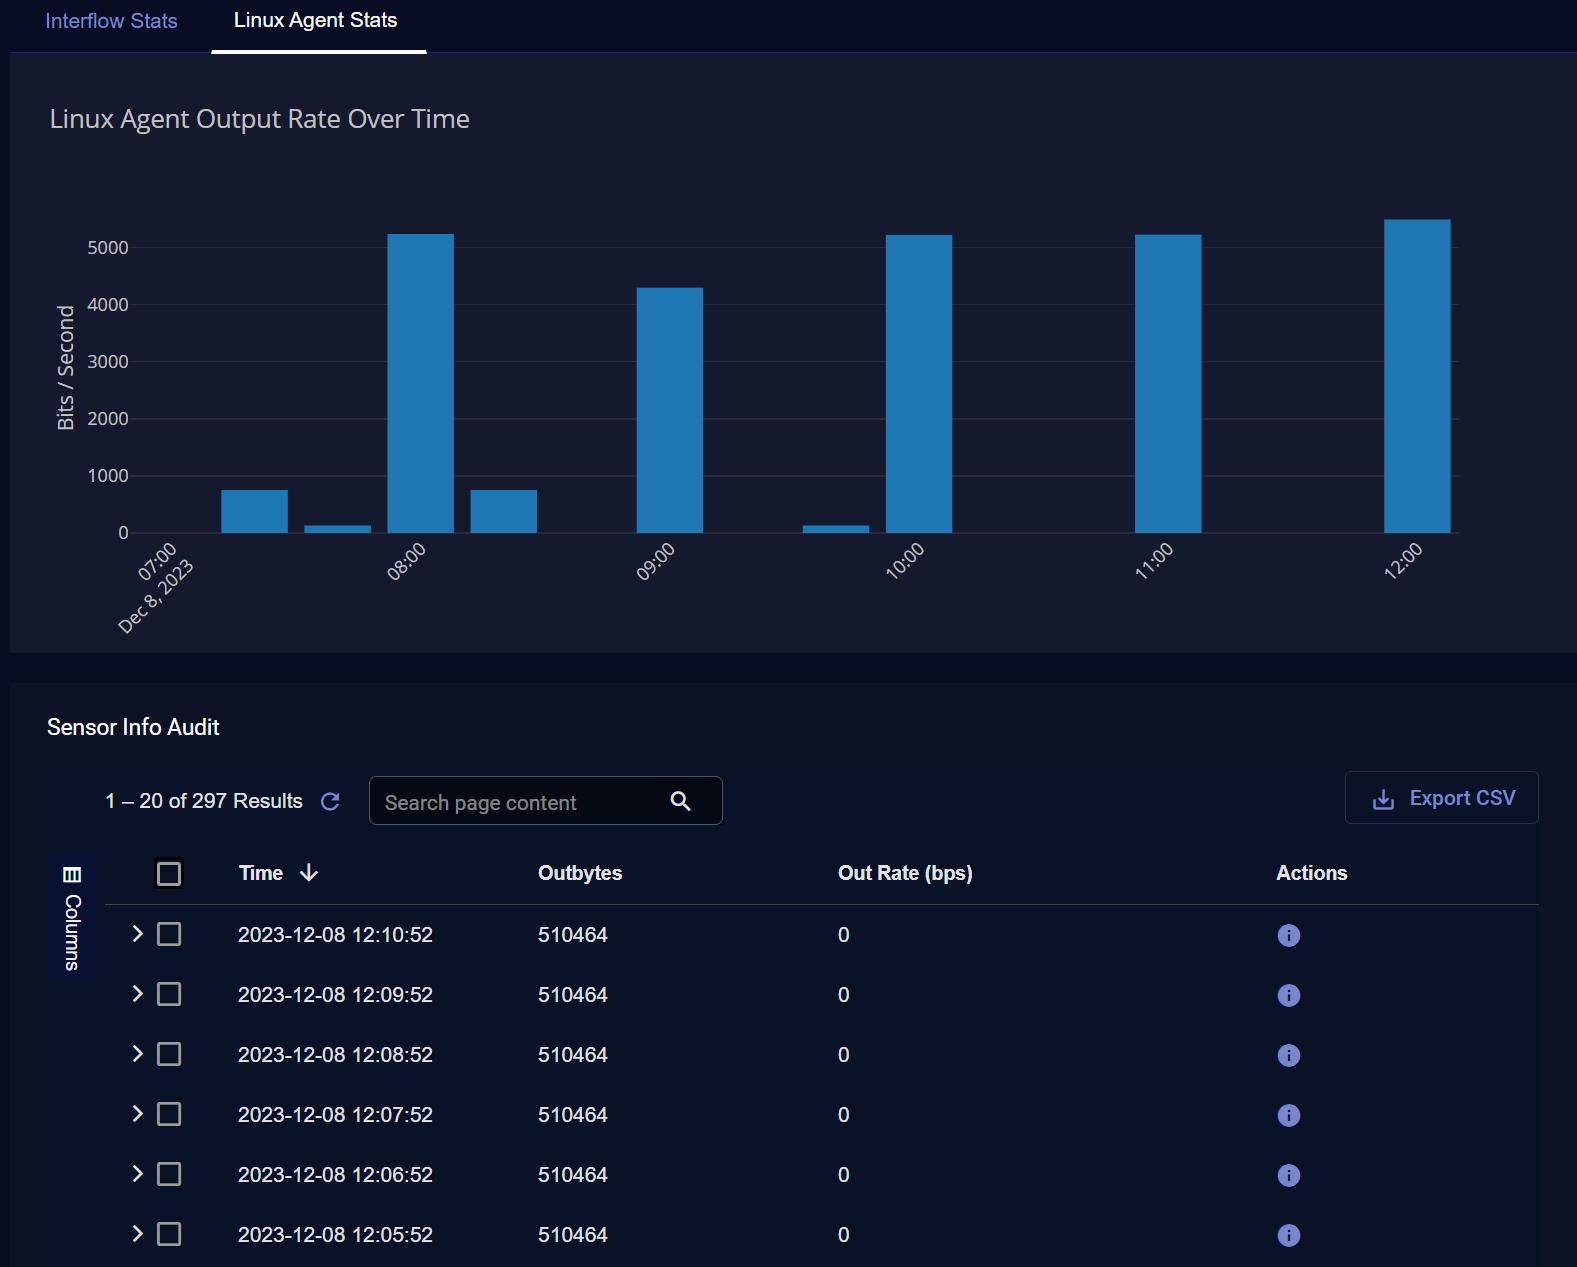
Linux Agent Stats
The Linux Agent Stats tab shows the output rate of the selected Linux Server Sensor over the time interval selected using the standard filter controls at the top of the page.
When the Linux Agent Stats tab is displayed, you can also see the Sensor Info Audit table below the graph. This table provides separate entries with metadata for the one-minute buckets of logs sent by the Linux Server Sensor.
In addition to the standard table controls, you can also use an entry's More Info button to open the Event Details panel for the corresponding entry.
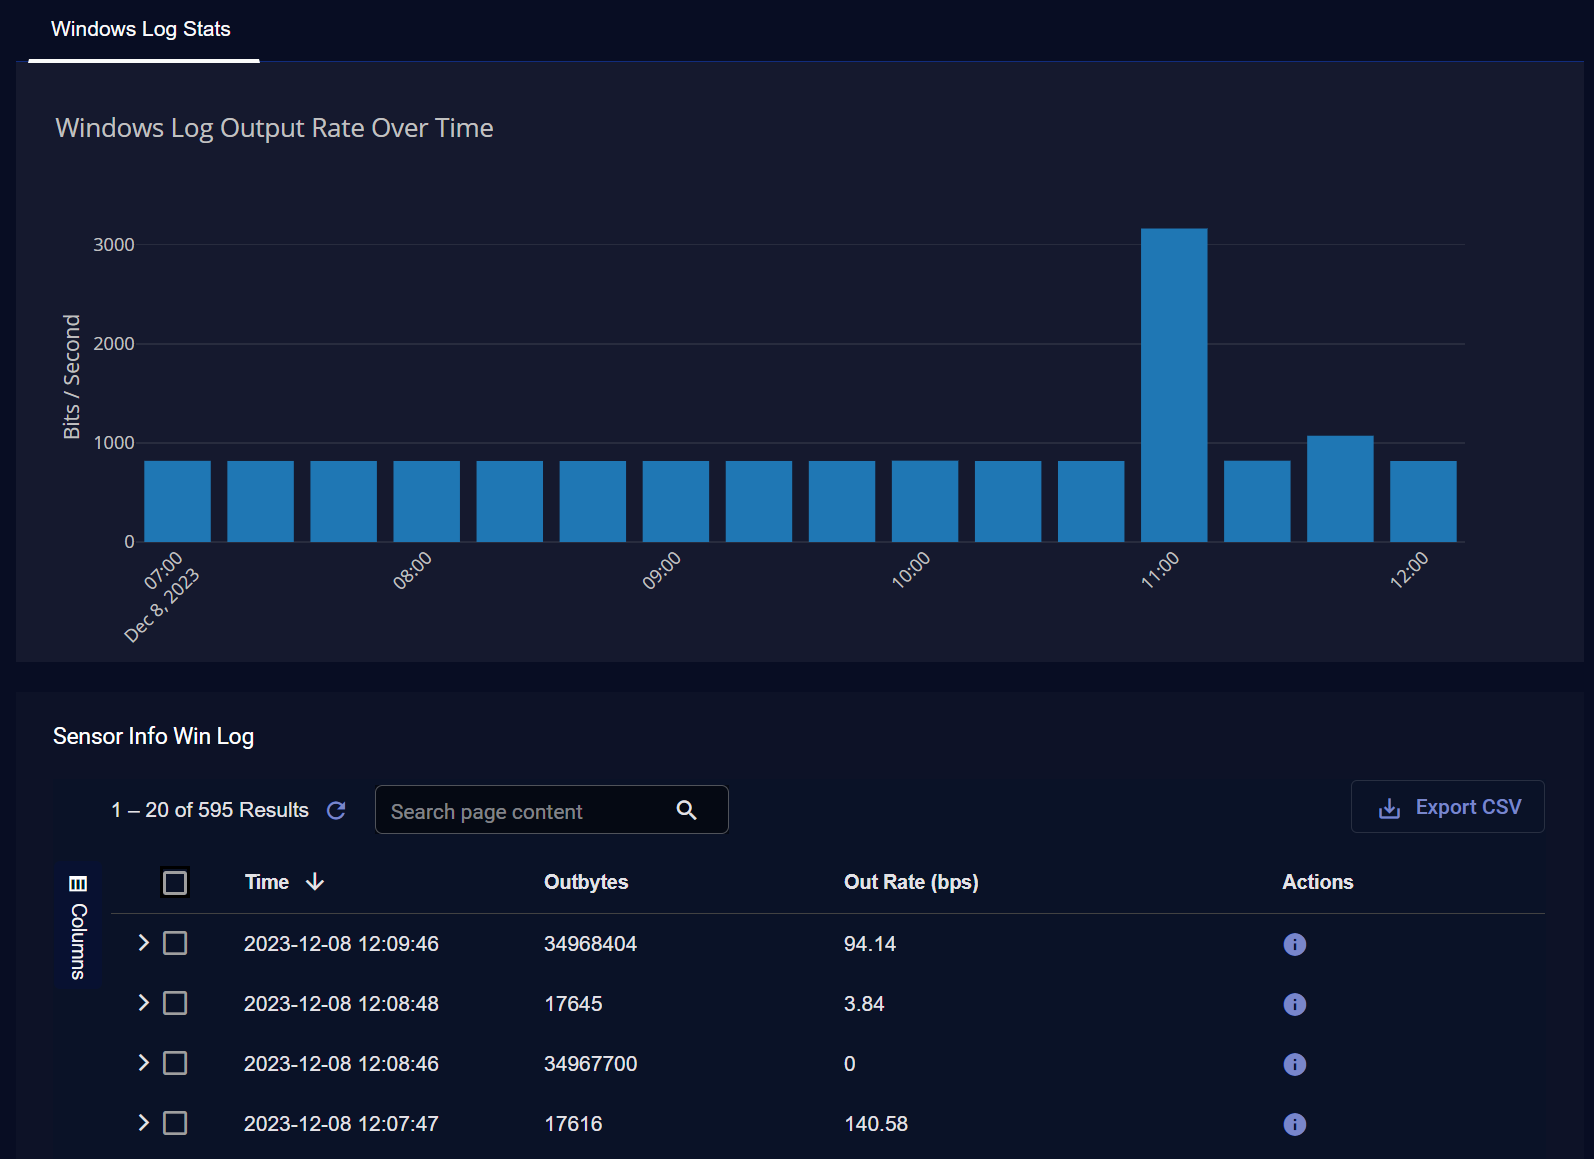
Windows Log Stats
The Windows Log Stats tab shows the output rate of the selected Windows Server Sensor over the time interval selected using the standard filter controls at the top of the page.
When the Windows Log Stats tab is displayed, you can also see the Sensor Info Win Log table below the graph. This table provides separate entries with metadata for the one-minute buckets of logs sent by the Windows Server Sensor.
In addition to the standard table controls, you can also use an entry's More Info button to open the Event Details panel for the corresponding entry.
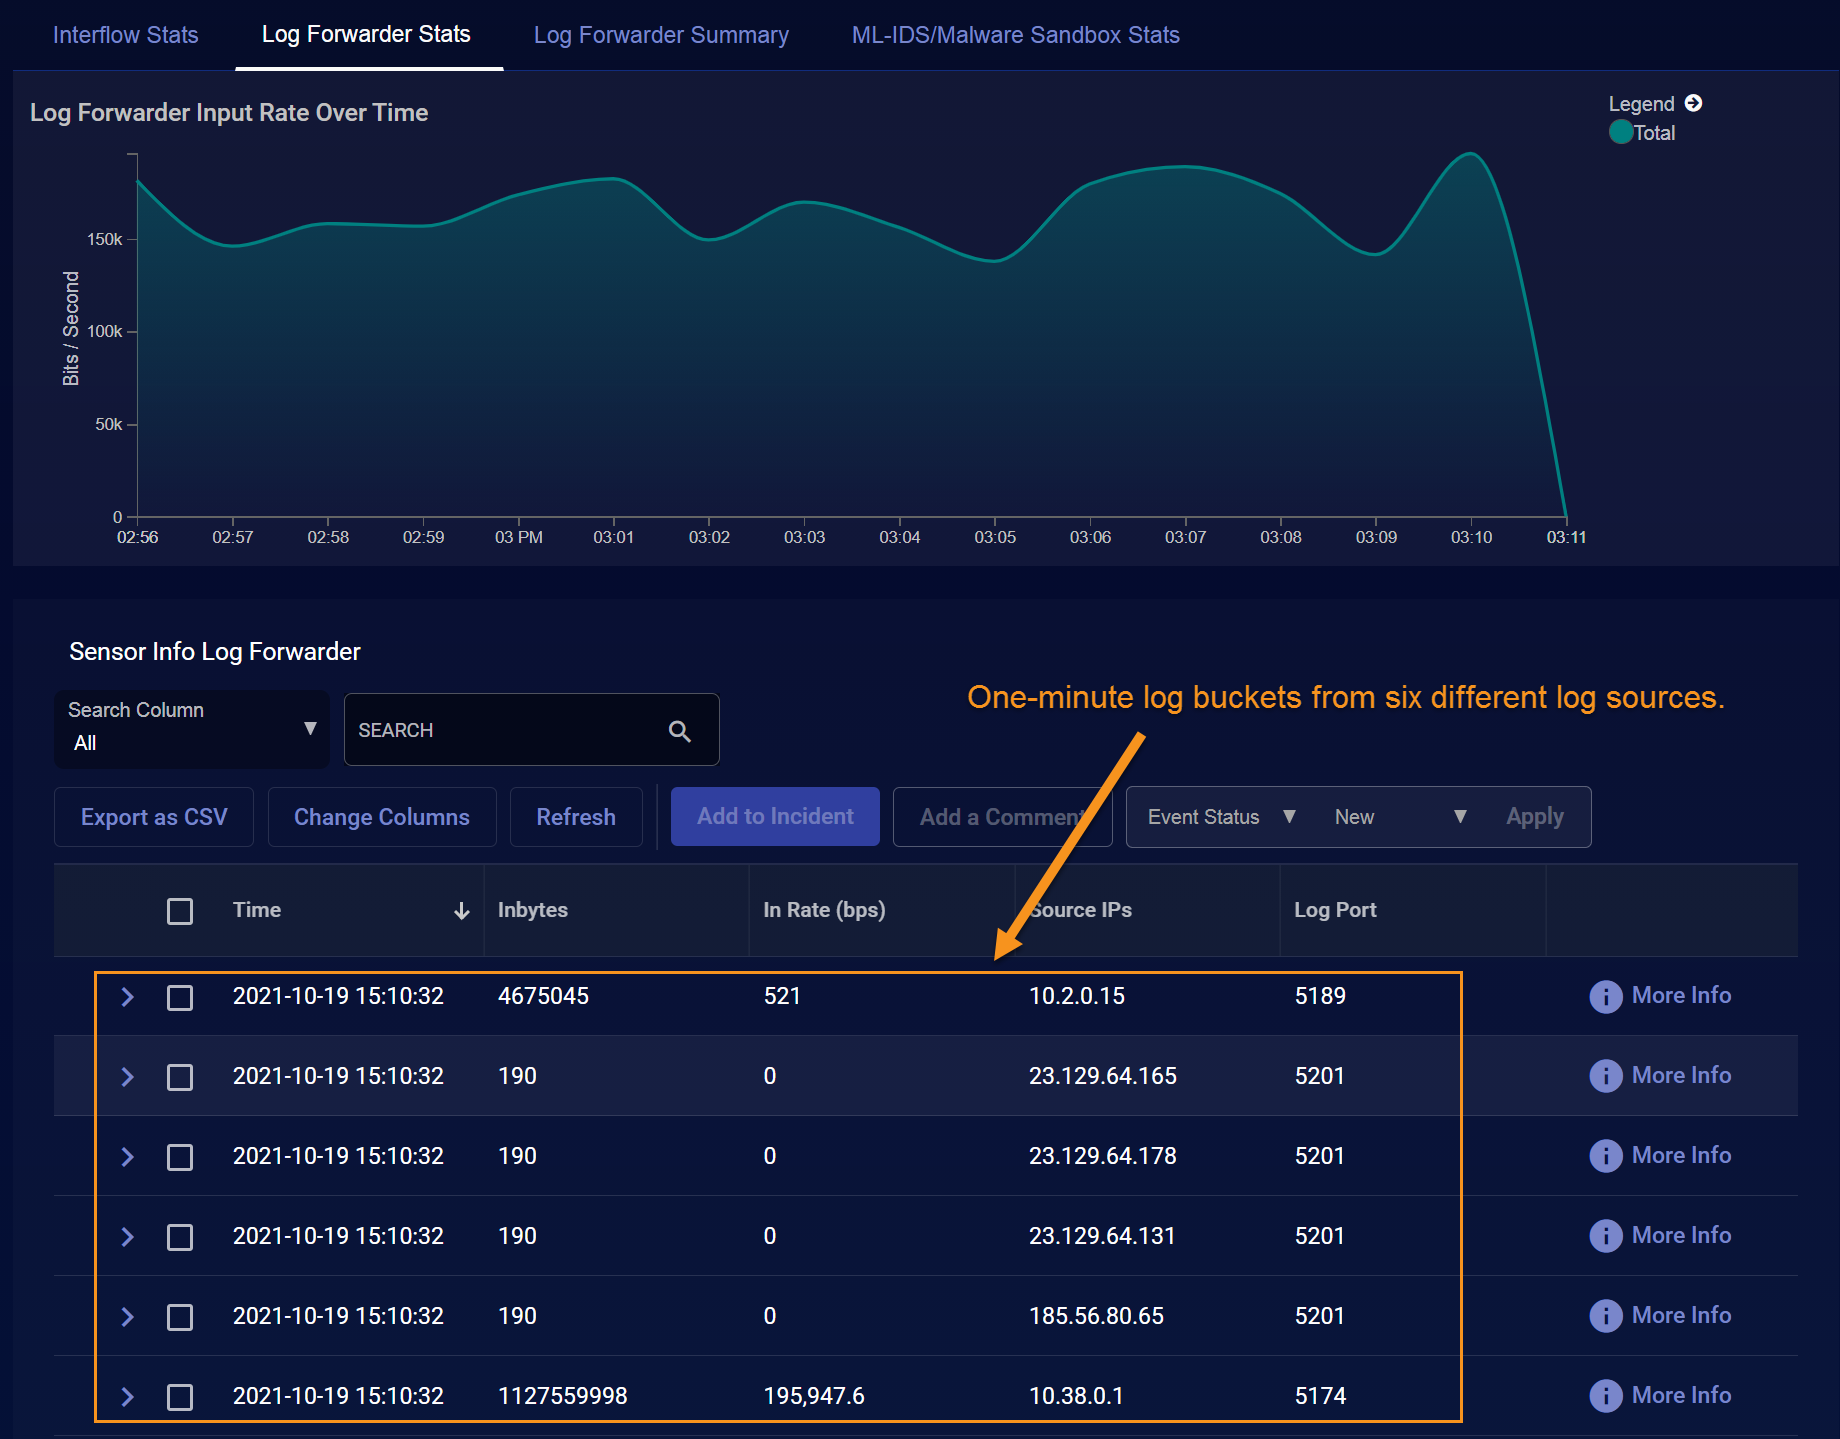
Log Forwarder Stats
The Log Forwarder Stats tab shows the rate of log input over the time interval selected using the standard filter controls at the top of the page.
When the Log Forwarder Stats tab is displayed, you can also see the Sensor Info Log Forwarder table below the graph. This table provides separate entries with metadata for the one-minute buckets of logs received by the sensor from each log source.
In addition to the standard table controls, you can also use an entry's More Info button to open the Event Details panel for the corresponding entry.
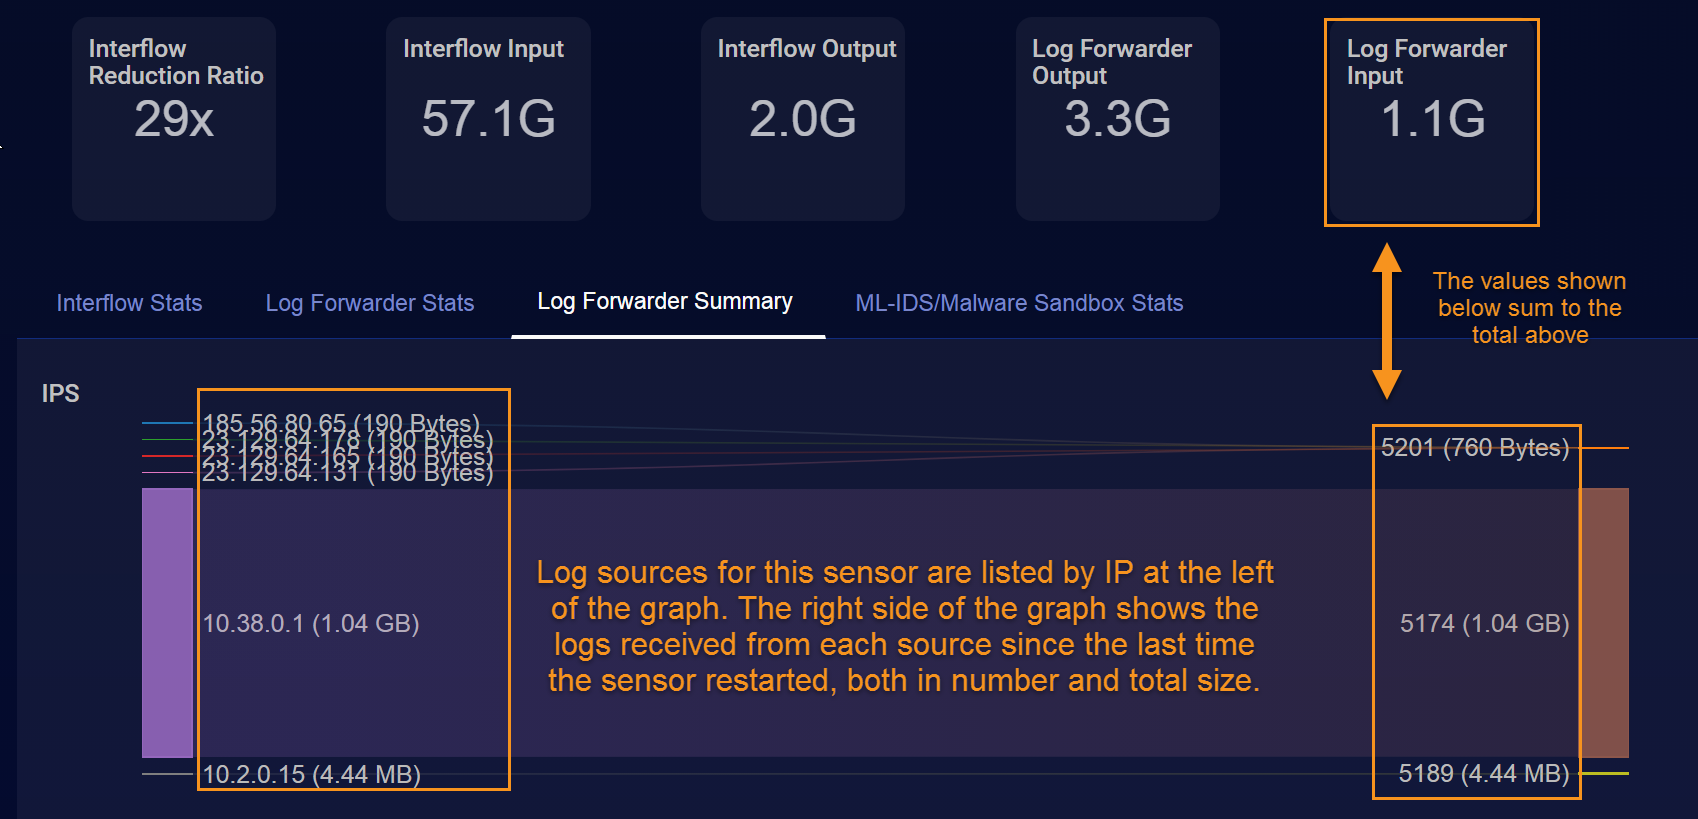
Log Forwarder Summary
The Log Forwarder Summary tab shows a historical record of logs received since the last time the sensor was restarted, broken out by IP address of the different log sources. For example, in the figure below, you can see the relative quantity of logs contributed by each of six separate sources, both in quantity and total size. Note that the total size of all logs received sums to the total shown in the Log Forwarder Input block in the Input/Output Panel above the graph.
Note that there is no table associated with the Log Forwarder Summary tab.
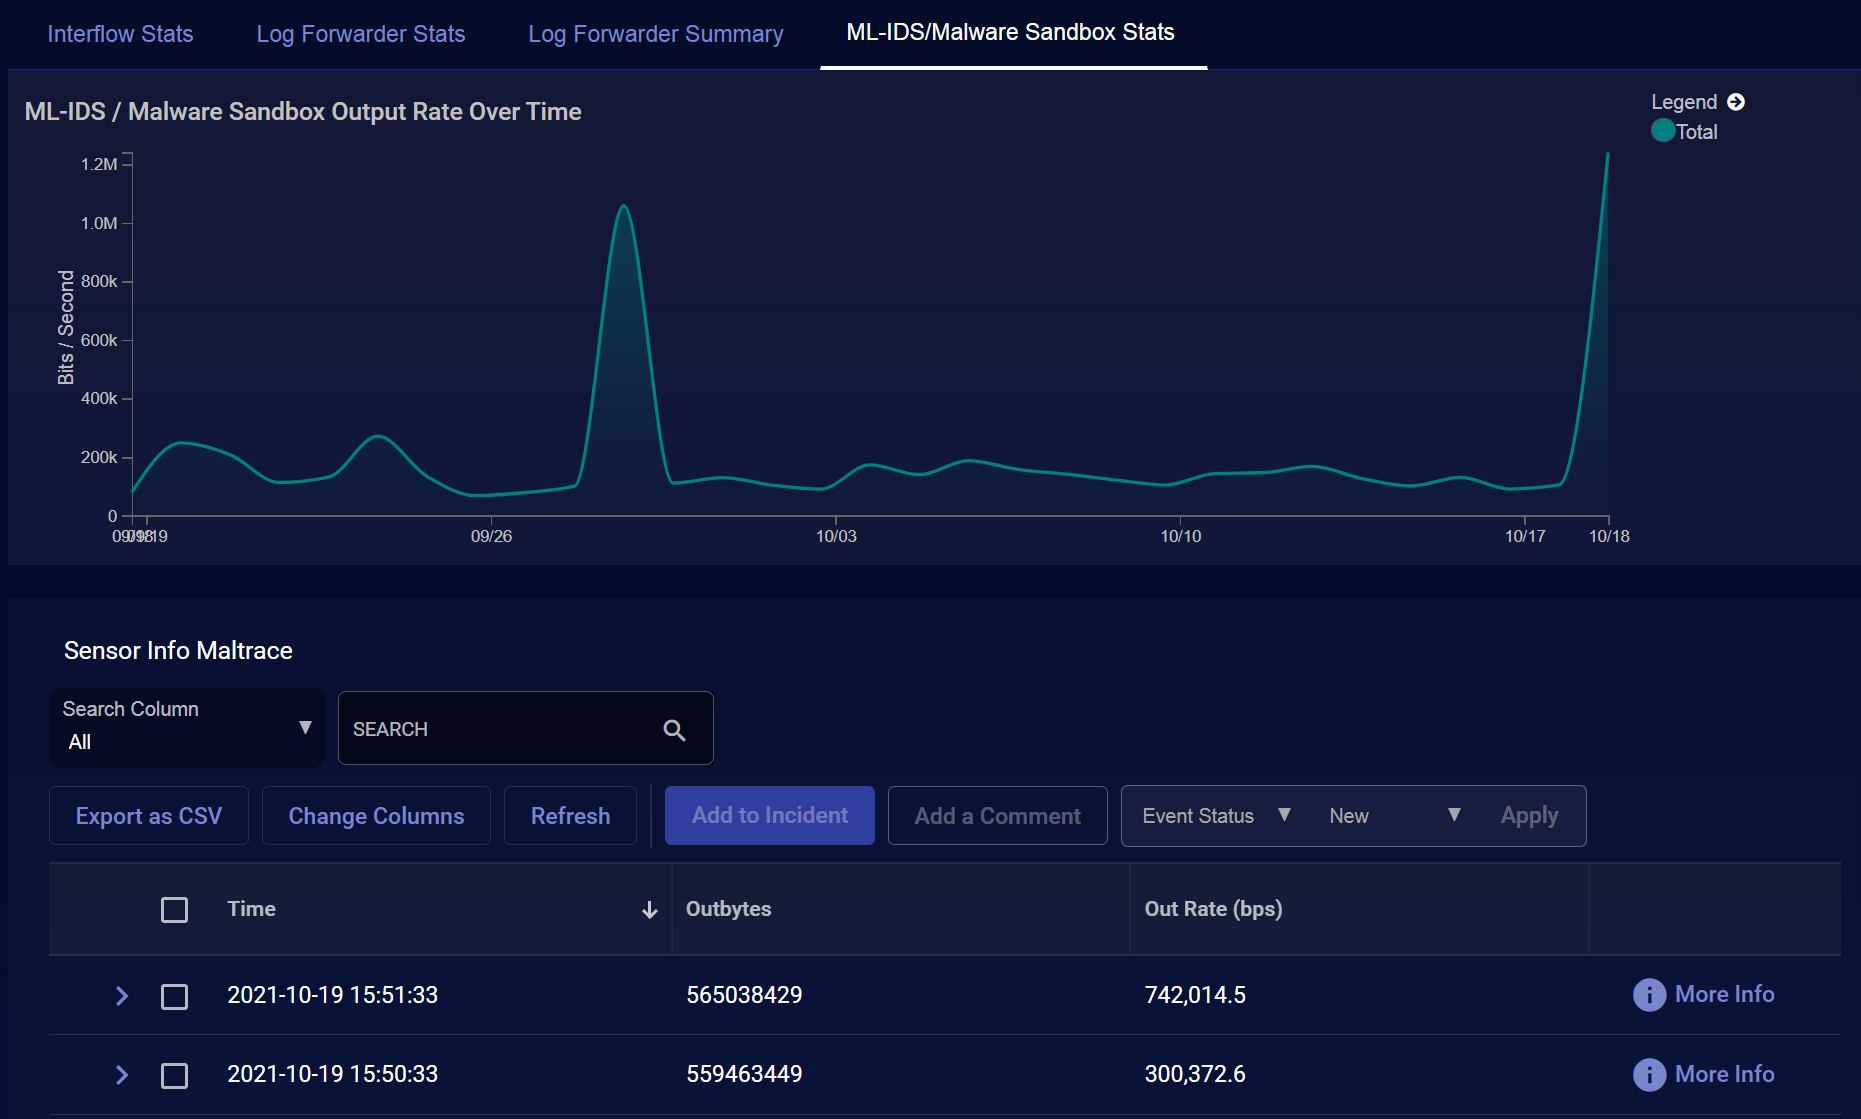
ML-IDS/Malware Sandbox Stats
The ML-IDS/Malware Sandbox Stats tab shows the rate of output to a Malware Sandbox over the time interval selected using the standard filter controls at the top of the page.
When the ML-IDS/Malware Sandbox Stats tab is displayed, you can also see the Sensor Info Maltrace table below the graph. This table provides separate entries with metadata for the one-minute buckets of maltrace data sent by the sensor.
In addition to the standard table controls, you can also use an entry's More Info button to open the Event Details panel showing detailed Interflow information for the corresponding entry.