ML & IDS
The intrusion detection system (IDS ) augmented with machine learning (ML) is a core feature of Stellar Cyber. You can use the Visualize | Predefined | ML-IDS page to work with this feature.
Stellar Cyber uses unsupervised ML to reduce the number of events. An IDS typically triggers an alert every time a signature is matched, even if that signature is normal network behavior. In contrast, ML-IDS learns the rate of signature matching for your network, and only generates an event when that rate changes.
Each tab at the top of the screen represents an available display mode with Critical, Total, and Raw event counters. The currently selected tab is underlined. When you select a tab, the page below shows the data corresponding to that mode. These include:
-
Overview—(default) Shows the total of all ML-IDS exploits.
-
Private-to-Private Exploit Attempts—Selects events where both the aggressor and target systems are in the private network.
-
Private-to-Public Exploit Attempts —Selects events where the aggressor host is in a private network and the target system is in a public network.
-
Public-to-Private Exploit Attempts —Selects events where the aggressor host is in the public network and the target system is in the private network.
-
Public-to-Public Exploit Attempts —Selects events where both aggressor and target are in the public network.
Dashboard Actions
You can perform the following actions on this dashboard:
-
Edit
-
Clone
-
Export as PDF / CSV
See the Dashboard Actions page for details on each action.
Investigate Panel
In the overview mode, the display just below the header tabs appears if there are any anomalies to report. An example is in the following image:
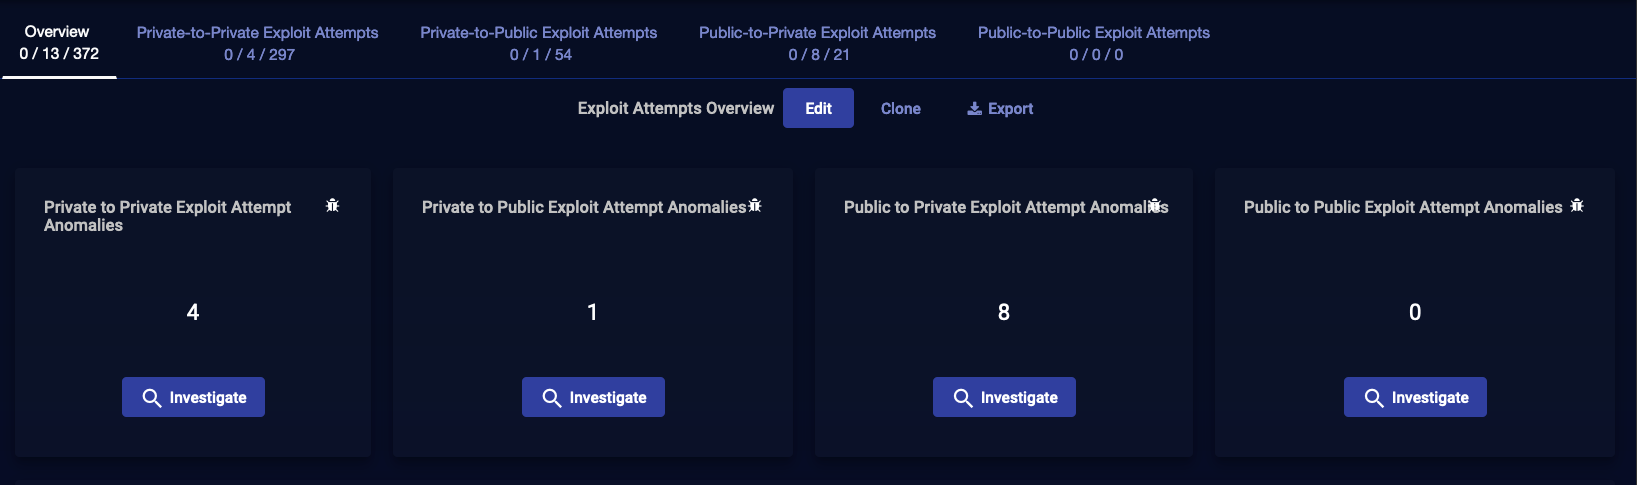
Click the Investigate button to go to the Kill Chain page, which provides a drill-down view of the same data.
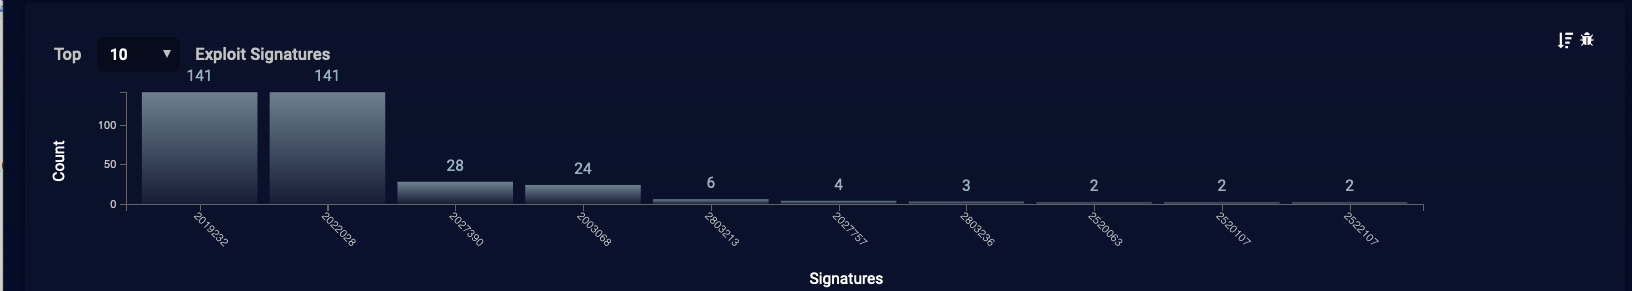
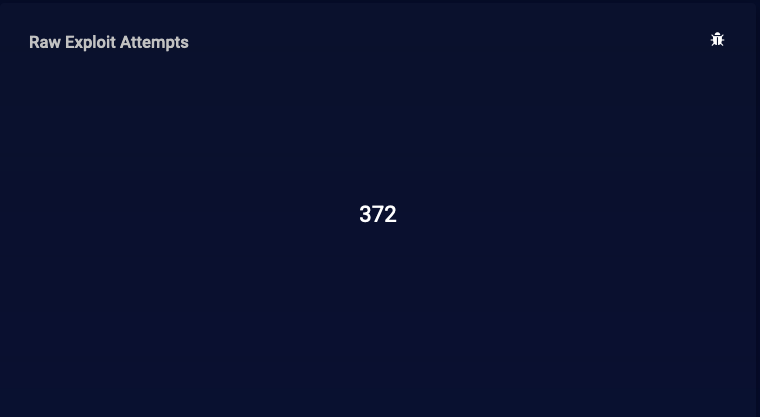
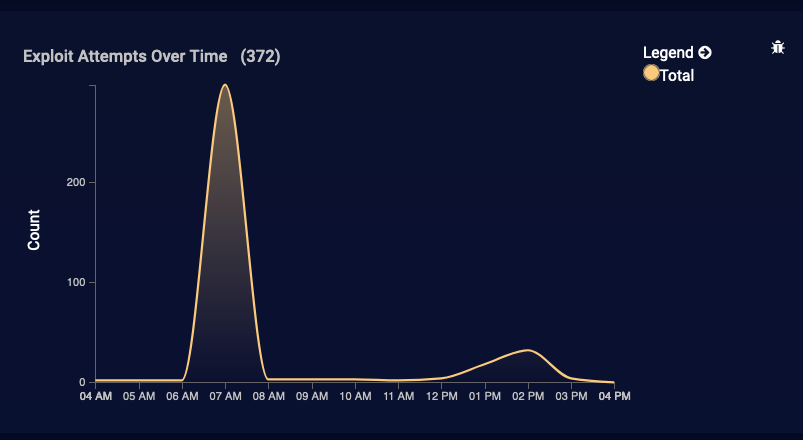
Exploit Overview Graphs
In the Overview mode, the next region of the page includes the following data display elements.
The first element shows the top exploit signatures seen in the current search results. The exploit signature data base is maintained by Stellar Cyber.
This display component shows the total number of exploit attempts discovered in the current search results.
This graph provides a timeline view of the exploit attempts. The x-axis is time and the y-axis is the count.
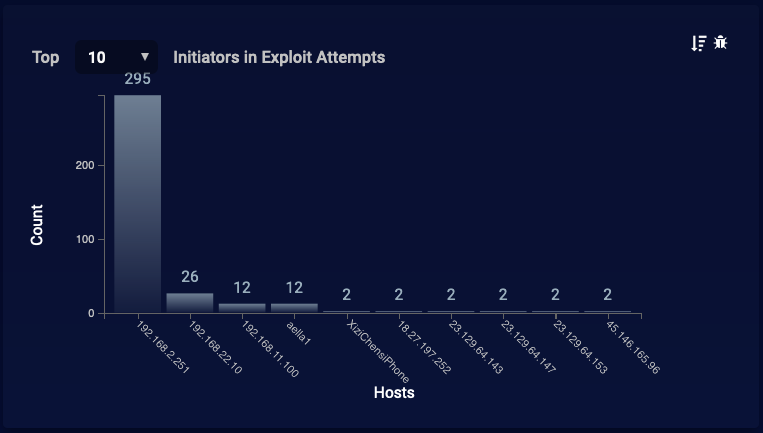
This display component details the top hosts that are seen as aggressors (initiators) in exploit attempts.
This display component details the top hosts that appear as targets in exploit attempts.
Event Table
At the bottom of the ML-IDS screen a table of the events currently selected is shown. An example is provided in the following image:
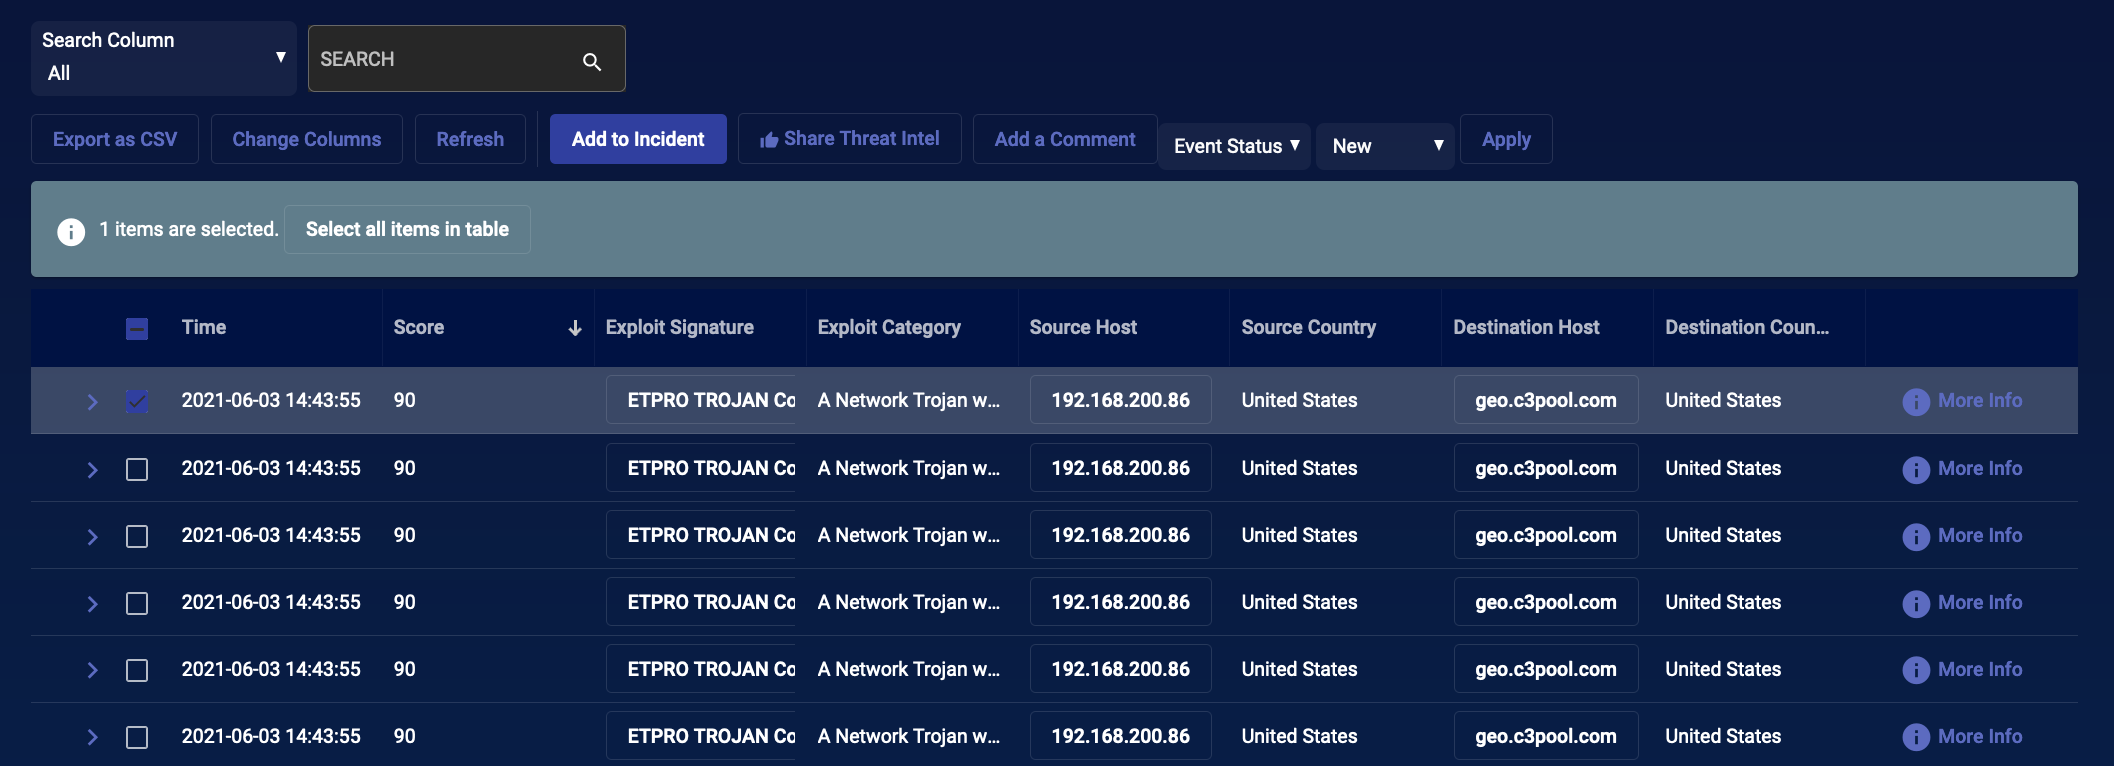
From a table level, you can perform the following actions:
-
Search the event records
-
Export all or selected records (CSV)
-
Customize the displayed columns
Each row in the table provides an overview of each security event. After selecting one or more events using the left-most checkbox of a row (or the select all option), you can:
-
Change event attributes such as Status, Tags, or Assignee
-
Add a Comment
You can also expand an individual row to view the Interflow record for the event , or click the More Info button on the far right of the record for more details. The More Info option displays a panel that organizes the event details and allows you to perform the row level tasks on the event (such as changing Status or Assignee). The panel also includes:
-
A map illustrating the location of the activity
-
A snapshot of the most relevant details from the Interflow record
-
An evidence block containing the Interflow record in table and JSON format.
See the Event Display page for more information on working with events.
See the Tables page for more information on working with tables.
