Malware Sandbox
![]() Learn more at Stellar Cyber Academy.
Learn more at Stellar Cyber Academy.
The following link takes you to a course on the Stellar Cyber Academy technical training portal where you can learn more about this topic by watching the suggested lessons.
M03 Modular Sensor Concepts and Configuration (08h:56m)
Learn to configure the malware sandbox module on Modular Sensors and understand how sandboxing enhances threat detection by analyzing suspicious files in an isolated environment. Explore how the Stellar Cyber Platform ingests sandbox data into the data lake alongside Interflow records to enrich threat intelligence and support machine learning-driven analysis. Discover how to navigate the malware sandbox interface to review file metadata, sandbox actions, and malware categorizations, and follow a demonstration using toolbar filters and the search tool to detect patterns in file analysis results. See how to interpret sandbox findings and integrate them into threat investigations and Case Management workflows for a more complete response to potential malware activity.
Learn how to validate and use the Malware Sandbox in the Stellar Cyber Platform and Modular Sensor. See how to confirm that the Malware Sandbox is functioning correctly, monitor malware-related events, and use Stellar Cyber tools to investigate suspicious activity and potential threats.
The first time you access a link on the portal during a session, you must log in to access content.
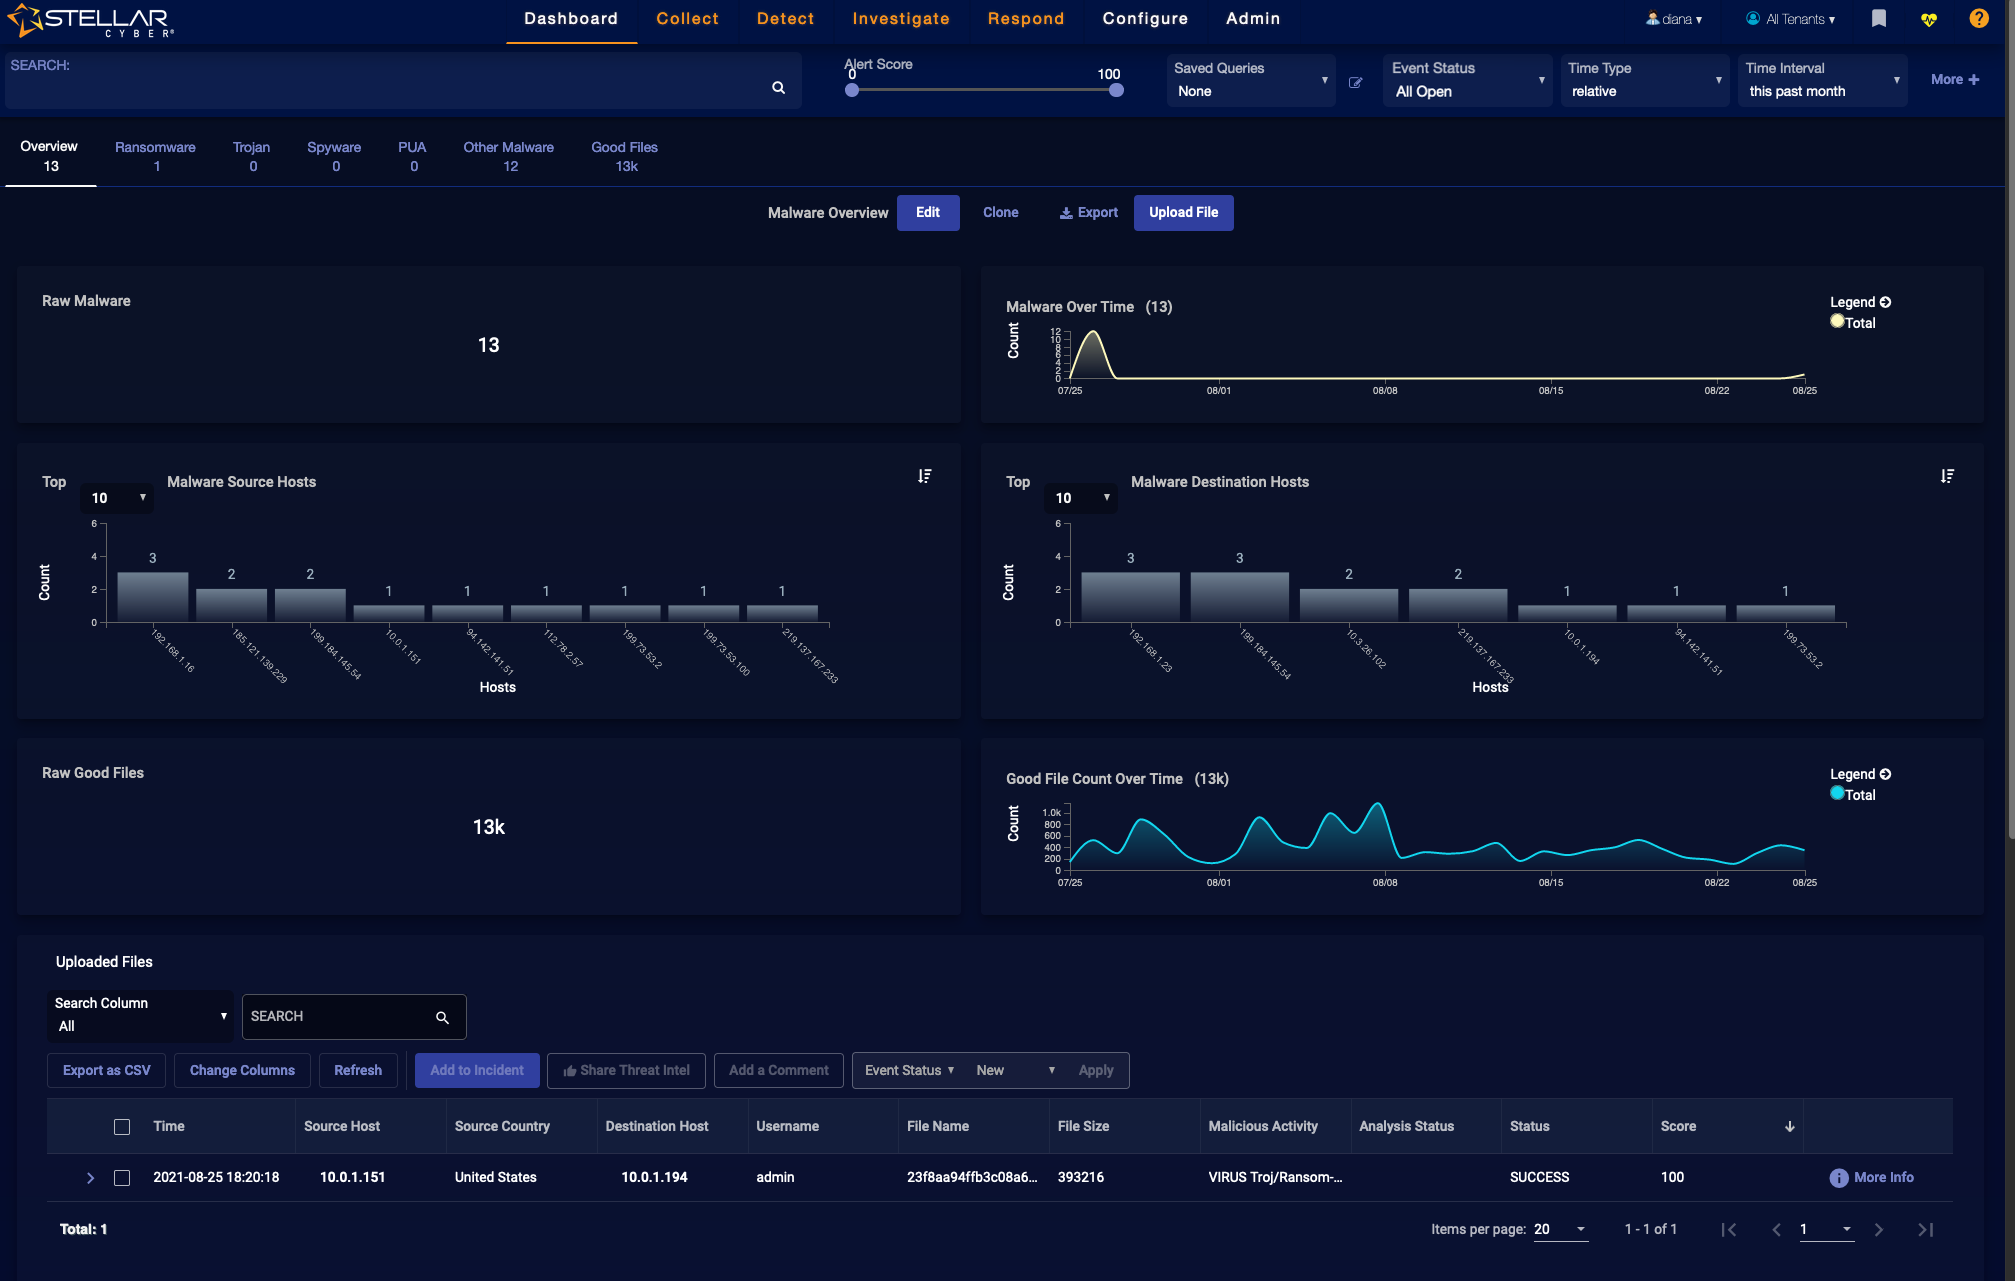
Stellar Cyber sensors can identify malware traveling through the network and arriving at specific hosts. You can use the Dashboards | PREDEFINED | Malware Sandbox Overview page to see and analyze these observations. Use the category tabs at the top of this page to filter for specific malware types; the tabs have a count of event records for that category.
-
Overview – (Default) This category is the sum of all the other categories of malware
-
Ransomware – Malware that demands payment to undo damage
-
Trojan – Malware that appears as legitimate software
-
Spyware – Malware that is intended to reveal secret information
-
PUA – Potentially unwanted applications, such as adware
-
Other Malware – Uncategorized malware
-
Good Files – Files that were detected but are known to be benign
For details on alert types and actions you may consider, review the Alert Types. Stellar Cyber provides Coverage Analyzer and Detections & Response tools that let you look up alert types by sensor, data source, application, alert name, alert type, or by XDR attributes such as kill chain stage, tactic, or technique. You can also view alert types by index in Machine Learning Alert Types by Index, which provides links to descriptions of the alert types that can appear in each available index.
By default, the predefined dashboards show All Open alerts. You can use the filters at the top of the page to change which alerts are displayed.
Dashboard Actions
You can perform the following actions on this dashboard:
-
Edit
-
Clone
-
Export as PDF/CSV
See the Dashboard Actions page for details on each action.
In addition, from the Overview tab, you can upload files for analysis.
The file upload is described in the File Upload section.
Data Graphs
The center portion of the screen shows graphic summaries of the events currently selected. An example of this is shown in the following images.
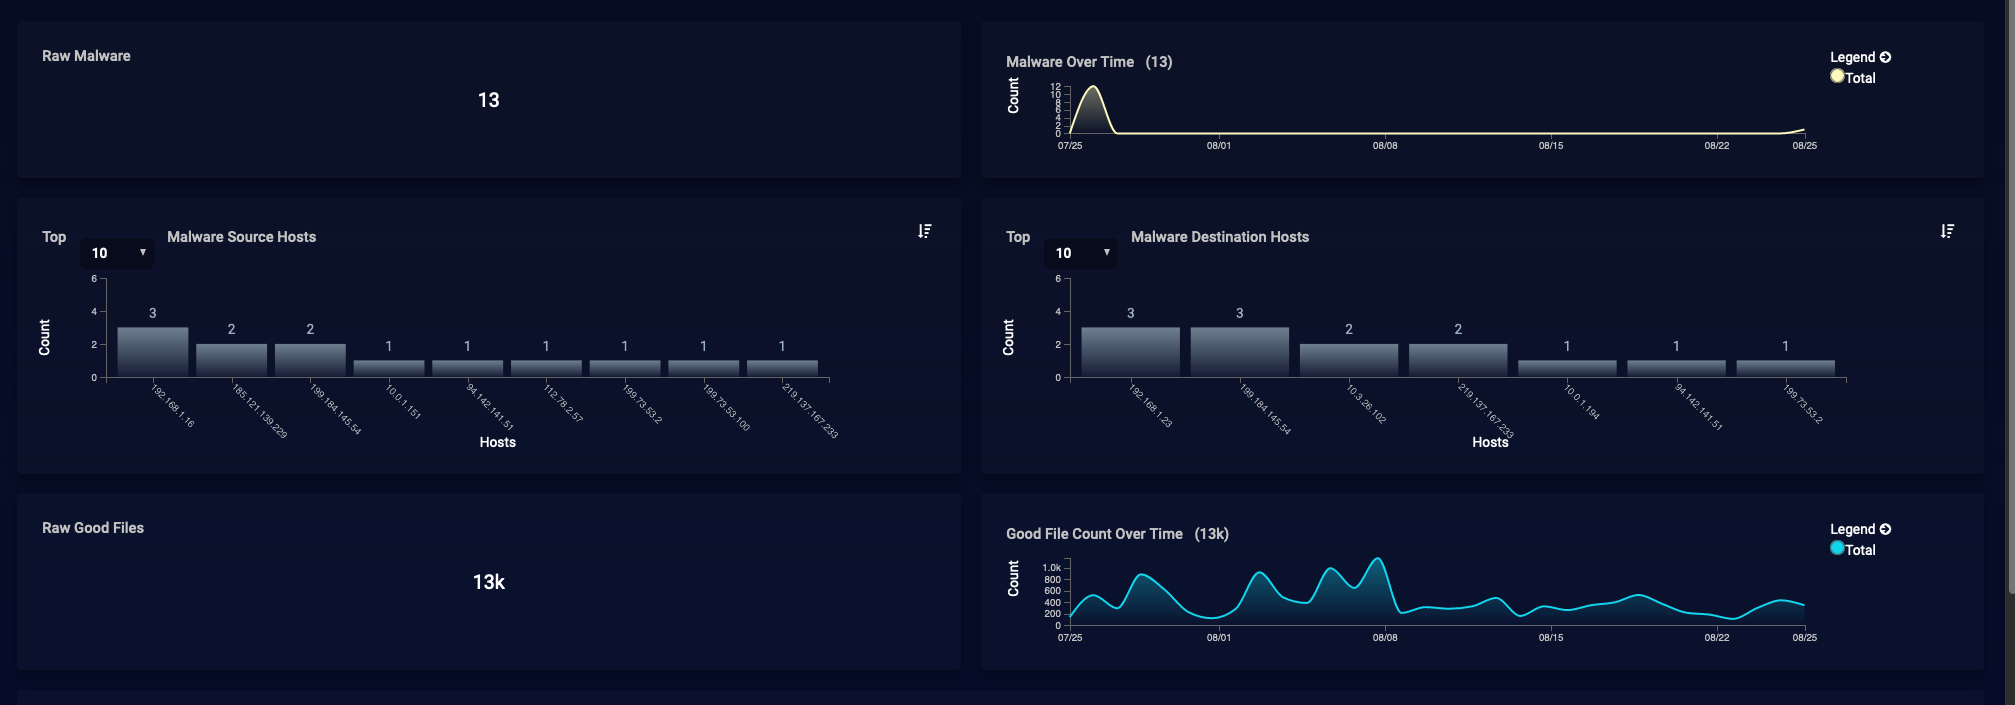
The information in this section includes:
-
Raw Malware – A count of all malware events for the current category and search results settings
-
Malware Over Time – A line graph that plots the time that malware was detected
-
Malware Source Hosts – A bar graph of the top hosts that deliver malware
-
Malware Destination Hosts – A bar graph of the top hosts that receive malware
-
Raw Good Files – A count of all good files seen within the current search results
-
Good File Count Over Time – A graph showing when the files were detected
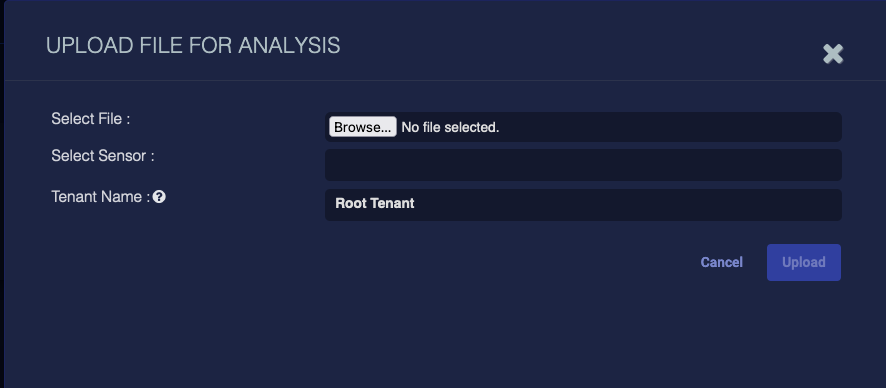
File Upload
To upload files to be analyzed:
-
Select Upload File in the list of actions near the top of the page next to "Malware Overview": Edit, Clone, Export, Upload File.
The Upload File for Analysis panel appears.
-
In the Select File field, click or tap Choose File to choose the file to be uploaded to Stellar Cyber.
This field does not support multibyte or special characters. For example, the filename cannot include any of the following characters – (, ^, &, %, ^, &, $, %, ^, #.
-
From the Select Sensor drop-down list, choose the sensor that will do the analysis.
-
From the Tenant Name drop-down list, choose the tenant that will be identified in the JSON.
Uploaded records are tagged with the selected tenant's name, which is useful if you're a root admin uploading a file for a tenant.
Note that the Tenant Name selected here does not need to be the same as the sensor's tenant. The drop-down lists all available tenants.
-
Select Upload.
The file is uploaded to Stellar Cyber.
-
A green file upload was successful message appears when the upload finishes.
The results appear in the Uploaded Files table.
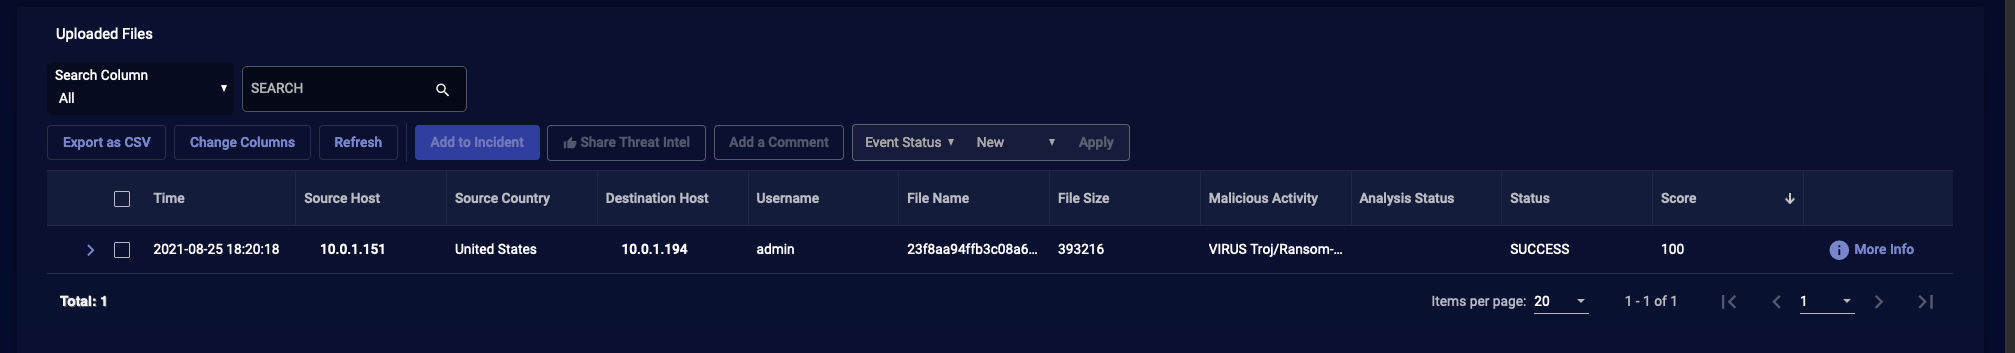
Depending on the files you uploaded and the sensor workload, it can take up to 10 minutes to complete the analysis.
See the Tables page for more information on working with tables.
