Working with Cases 
The Cases view lets you manage cases generated by Stellar Cyber. A case is a set of multiple correlated alerts and entities constituting a potential unified security attack, ranked by a dynamically updated score indicating the severity of the attack. Stellar Cyber uses its machine-learning capabilities to generate cases automatically, grouping related alerts into a unified case for improved attack resolution. In addition, you can also create your own cases from any table that includes alerts (for example, Investigate | Threat Hunting or Visualize | Predefined | Analyst View).
Cases offer the following benefits:
-
Streamlined workflows matching standard security analyst procedures.
-
Enact case-specific responses recommended by Stellar Cyber (for example, blocking an IP address) directly within the Case interface.
-
Evidence Locker lets you store emails, PDFs, CSV files, and links to bolster your case.
-
Full export capabilities let you share cases with executive staff.
-
Case Activity log tracks all events related to a case, providing a detailed audit trail.
-
Optional integration with ServiceNow lets you use Stellar Cyber's cases and alerts together with your existing help desk and ticket management solution.
Cases evolve in real time as new alerts are discovered and associated with an attack, either automatically by machine learning or manually by a user. You can use Cases as part of your standard SOC workflows to direct a proactive response to ongoing security issues, ensuring they are assessed, assigned, tracked, and resolved.
Refer to Understanding Cases for a detailed discussion of how cases are created and correlated.
Once a case's status has been changed to either Resolved or Cancelled, Stellar Cyber no longer associates new alerts with it. Instead, new alerts are either used to create a new case or associated with a different open case.
Cases vs. Incidents
Previous releases of Stellar Cyber referred to cases as incidents. The transition to cases improves their usability and accompanies other changes to both their presentation in the user interface and the underlying architecture.
Introducing the Cases Display
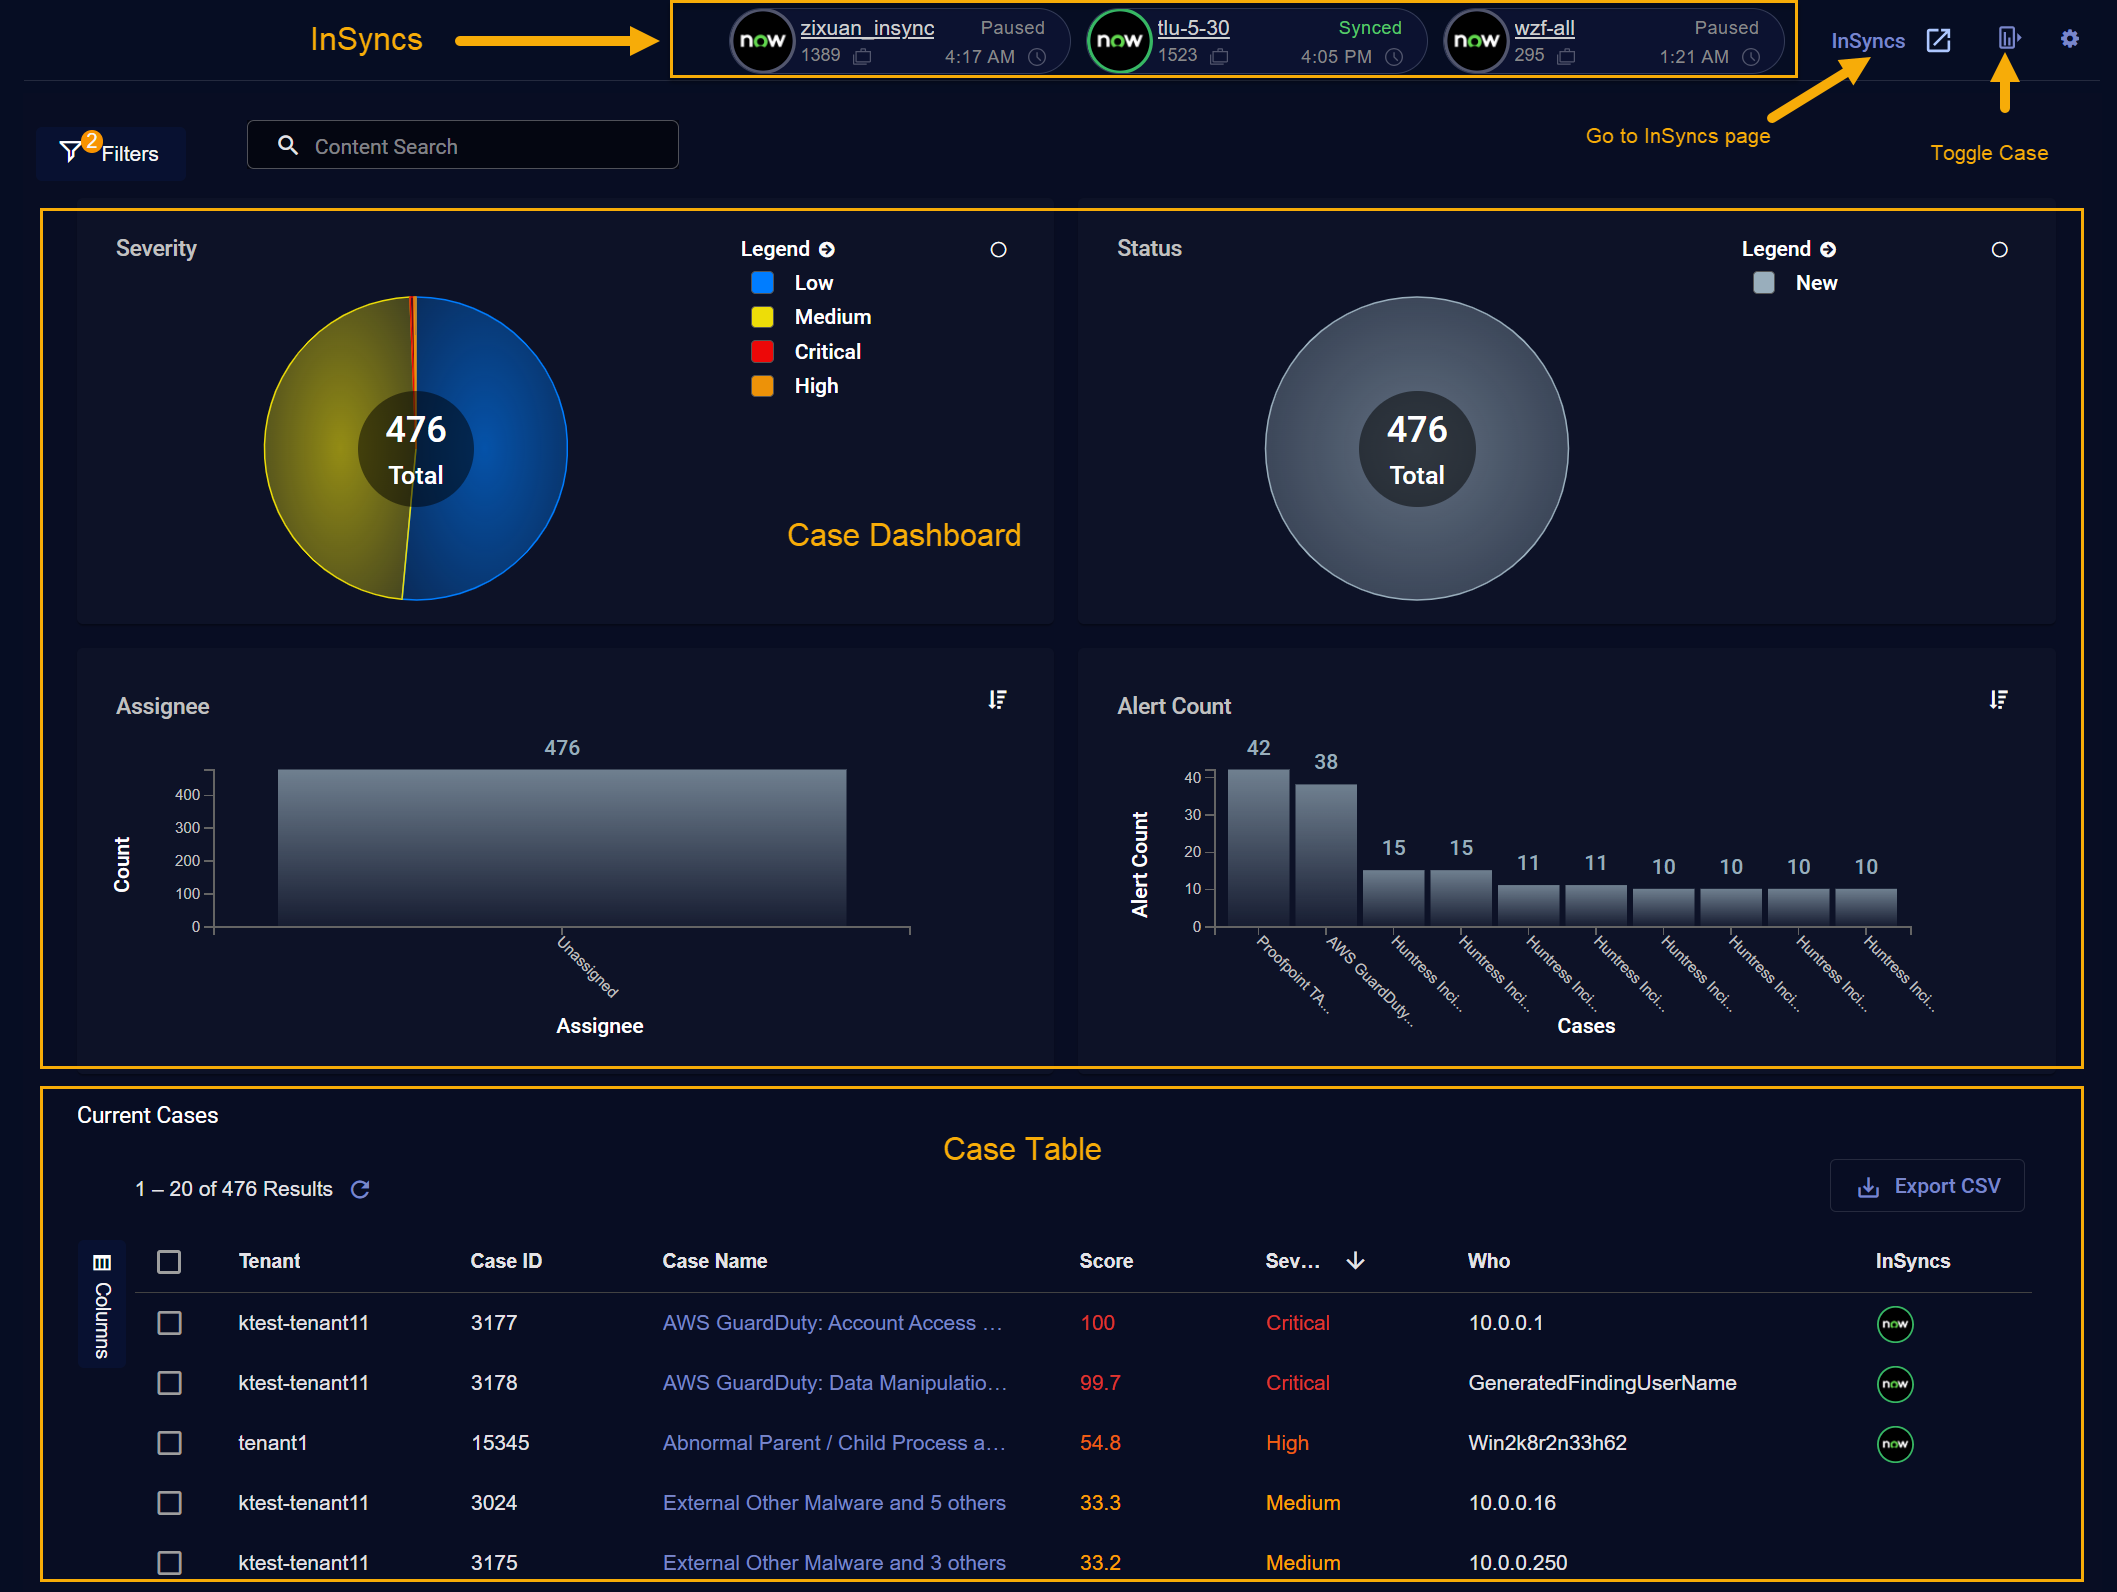
The Cases display consists of the following main components:
-
Case Dashboard – The Case Dashboard is at the top of the Cases display and includes high-level charts that help you understand the overarching status of all cases passing the current filters.
-
Case Table – The Case Table is below the Case Dashboard and provides a sortable table of all cases passing the current display filters with customizable columns. You can click any case to drill to its detail page. You can also use the filters at the left of the page to focus your work on cases that meet specified criteria.
-
Active InSyncs – Active InSyncs appear as separate icons above the Case Dashboard, as illustrated below. An InSync is an "integration synchronization" between Stellar Cyber and a third-party help desk or ticket management system, such as ServiceNow. InSyncs provide bidirectional exchange of alerts and cases between Stellar Cyber and the third-party application.
InSyncs are not available for all customers yet. See Early Access Program Features and Topics Under Development.
The figure below illustrates the organization of the Cases Display:
Using the Case Dashboard
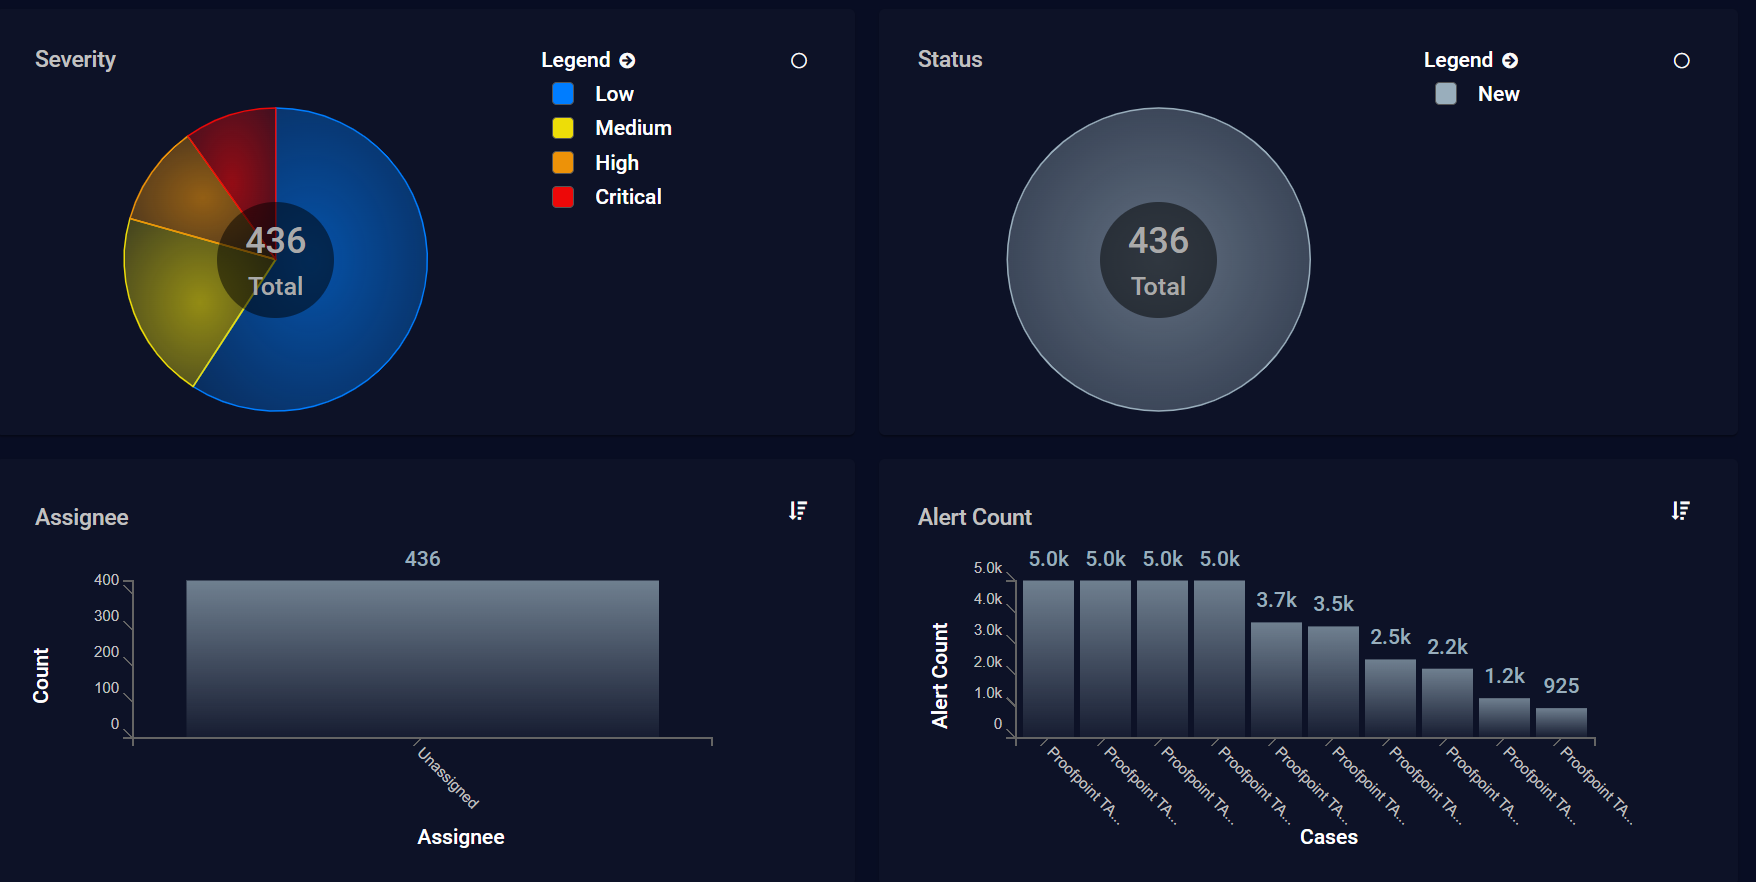
High-level charts at the top of the Case display let you see the following information at a glance:
-
Cases by Severity
-
Cases by Status
-
Cases by Assignee
-
Cases by Alert Count
Circular charts (Severity and Status) can be viewed in either donut or pie mode using the controls at the top right of the individual charts and are color-coded using the supplied legend. Bar charts (Assignee and Alert Count) can be viewed in either horizontal or vertical mode using the controls at the top right of the individual charts.
Keep in mind that charts only display data for those cases passing the current Case filters. So, for example, if you set a Case filter that limits the display to just those cases with a Severity of High, similarly, the Cases by Severity chart will only show cases with a Severity of High.
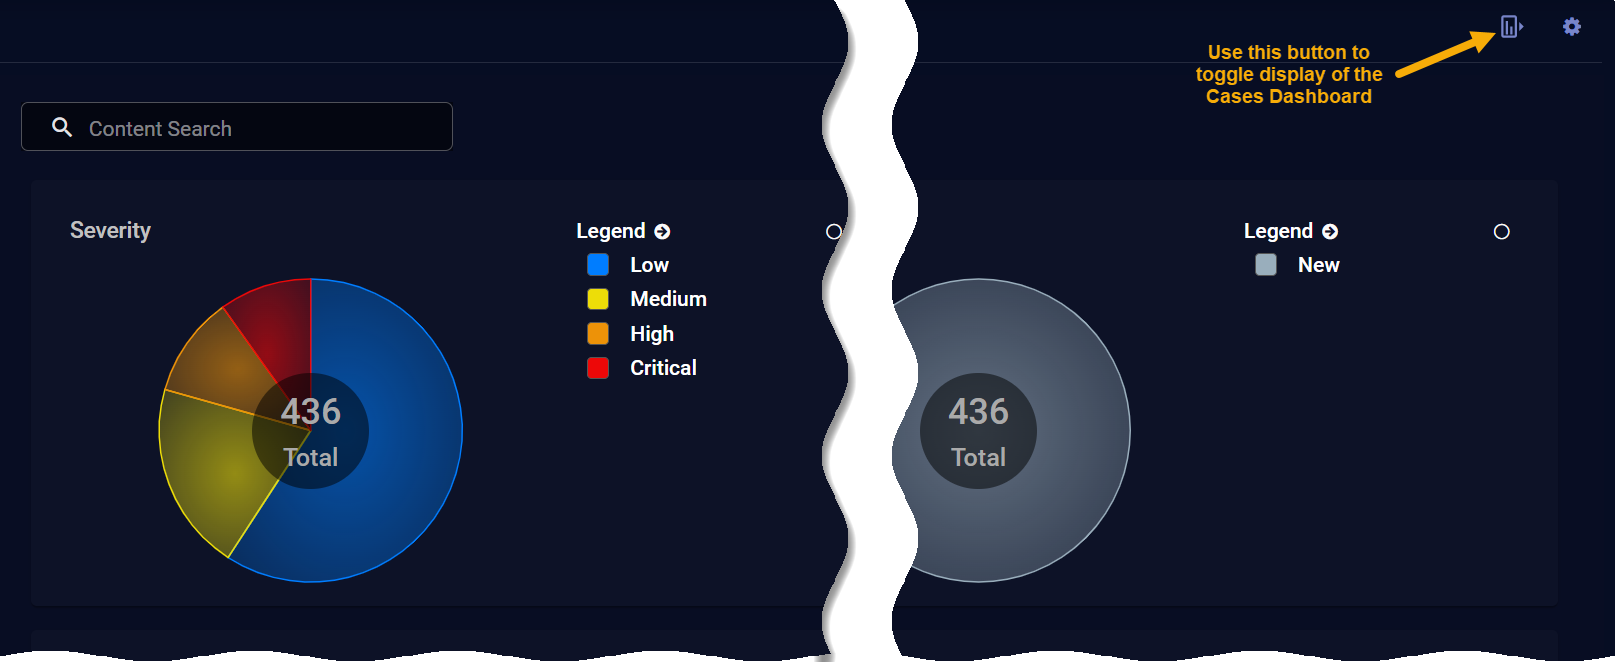
Toggling the Case Dashboard Open and Closed
The Case Dashboard is displayed by default, but you can toggle it closed to optimize your available screen space with the button at the upper right of the Cases view:
InSync Indicators in the Cases Page 
If there are any InSyncs configured, they appear as separate indicators at the top of the Cases page with high level status indicators for the health of the sync. In addition, there is also an InSyncs button that you can click to navigate to the InSyncs page where the integrations are configured. For example:

An InSync is an "integration synchronization" between Stellar Cyber and a third-party help desk or ticket management system, such as ServiceNow. InSyncs provide bidirectional exchange of alerts and cases between Stellar Cyber and the third-party application. Once an InSync is in place, changes made to an alert or case on one side of the InSync are reflected on the other; for example, if you change the name of a synced case in Stellar Cyber, the name change is also reflected in the synchronized table in ServiceNow.
InSyncs are not available for all customers yet. See Early Access Program Features and Topics Under Development.
The illustration above shows indicators for two sample integrations with ServiceNow. Each indicators provides the following information:
-
Name – Each indicator shows the name of the InSync, as configured in the InSyncs page. You can click the InSync name to navigate to the InSyncs page.
-
InSync Status – The status of the InSync is indicated both with text and the color of the circle around the NOW icon:
-
A green circle indicates a Synced status.
-
A gray circle indicates a Paused status.
-
A red circle indicates an Error status.
-
-
Case Count – There is a count of the number of cases that have been synced using this InSync.
If the synced case count is less than the total number of cases shown in the Case Table, you probably have a display filter set that is limiting the number of cases displayed. You can use the tools under the Filters icon at the top left of the page to adjust your display filters, if you like.
-
Timestamp – Each indicator includes a timestamp of the last synchronization, expressed in the browser's time zone.
See Using InSyncs for more information on working with InSyncs.
Using the Case Table
Cases are initially shown in a sortable table with customizable columns. You can click any case to drill to its detail page. You can also use the filters at the left of the page to focus your work on cases that meet specified criteria.
The tabular view lists each case on its own row with the following default columns:
-
Tenant – The tenant with which this case is associated.
-
Case ID – The system-assigned number for the case.
-
Case Name – Stellar Cyber automatically assigns a name to each case it reports. You can either accept the default name or supply your own in the Case Detail view.
-
Score – Stellar Cyber assigns scores to cases based on how critical they are. A case's score updates in real time as events and entities are added to or removed from the case. Scores are color-coded to indicate the seriousness of the case.
-
Severity– The severity of the case (Critical, High, Medium, or Low). Severity automatically changes with a case's score until it is changed manually in the Case Detail view. Once you manually edit a case's severity, it no longer updates automatically based on the case's score. Severity indicators are color-coded to direct your attention to more serious cases.
-
Creator – The user account that created the case. Cases created by Stellar Cyber are listed with a creator of System.
-
What – The Tactic or Technique for the alert with the highest severity associated with this case.
-
Who – The user(s) and/or host(s) associated with the case. You can find details on the observables for the case in the Case Detail page's Analysis tab.
-
Assignee – The assignee for the case, if any. Cases can be assigned to resources in the Case Detail view or by checking a case's box at the left of the table and using the bulk edit controls that appear at the top of the table.
Working with the Case Table
The Case Table supports standard Stellar Cyber table functionality. You can change the columns in the Case Table by clicking the vertical Columns button at the left of the table to toggle open a panel where you can choose the columns to display.
You can add any of the following additional columns:
-
Acknowledged At – The time at which the case was acknowledged. A case is considered acknowledged when a user makes a change to its Severity, Status, or Assignment.
-
Alerts – A count of the alerts associated with the case.
A case can have a maximum of 5,000 associated alerts.
-
Closed At – The time at which the case was closed. Cases are closed when their status is set to either Resolved or Cancelled.
-
Created At – The time at which the case was created.
-
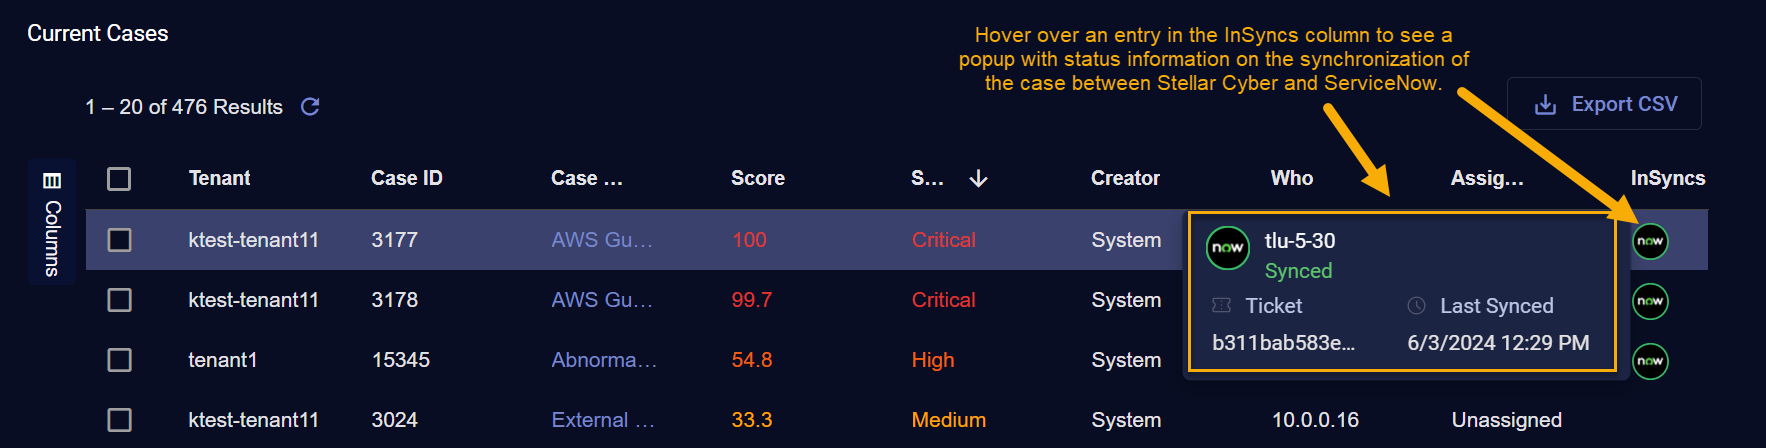
InSyncs
– For cases that are synchronized with an associated ServiceNow installation using an InSync, you can hover over mouse over the NOW icon in the InSyncs column and see the following information on the synchronization for the case:-
The name of the InSync performing the synchronization between Stellar Cyber and the third-party application (ServiceNow in this release).
-
The status of the InSync (Synced, Paused, or Error).
-
The ticket number for the synchronized case in ServiceNow.
-
The last time the case was synchronized, expressed in the browser's time zone.
InSyncs are not available for all customers yet. See Early Access Program Features and Topics Under Development.
-
-
Last Modified – The last time the case was modified. A case is considered to have been modified whenever there are changes to its alerts, severity, status, comments, or evidence.
-
Modified By – The user account that last modified the case.
-
Status – The status associated with this case. Can be either New, In Progress, Resolved, Cancelled, or Escalated. Changing a case's status helps you track your team's response to a case over time. You can change a case's status in the Case Detail view or by checking a case's box at the left of the table and using the bulk edit controls that appear at the top of the table.
-
Tags – The tags assigned to the case, if any. You can assign tags to a case in the Case Detail view or by checking a case's box at the left of the table and using the bulk edit controls that appear at the top of the table.
Not All Columns Supported for Sorting
-
Assignee
-
Tenant
-
Creator
-
Modified By
-
Tags
-
Who
-
What
Using Case Filters
The Cases page provides a Filters panel that lets you focus the display on just those cases matching the criteria you supply. By default, you can filter the Cases page by Score, Severity, Assignee, Created At date, Last Modified date, Status, or Tags. You can also use the Add new filter feature to add filters based on Case Name, Creator, Alerts, Closed At, Modified By, Tenant, or Ticket ID (the same criteria available as columns for the Case table).
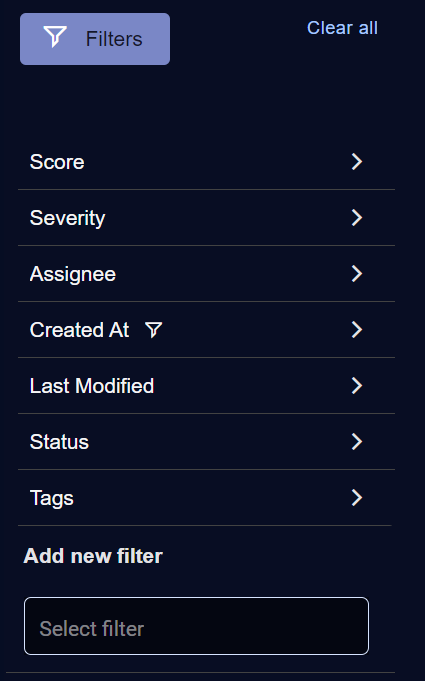
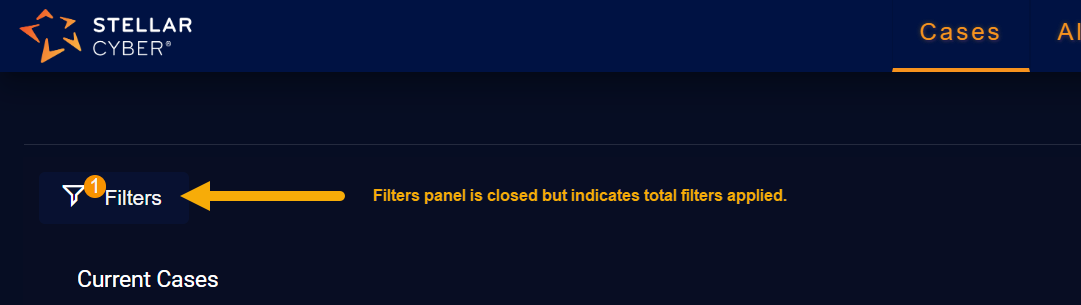
The Filters panel indicates which filters are currently applied with a special  icon in the entry for each filter type. For example, in the figure above, we can see that there is currently a Created At filter applied. Similarly, when the Filters panel is cascaded closed, its entry updates to show the total filters applied, as in the example below.
Use Case filters as follows:
-
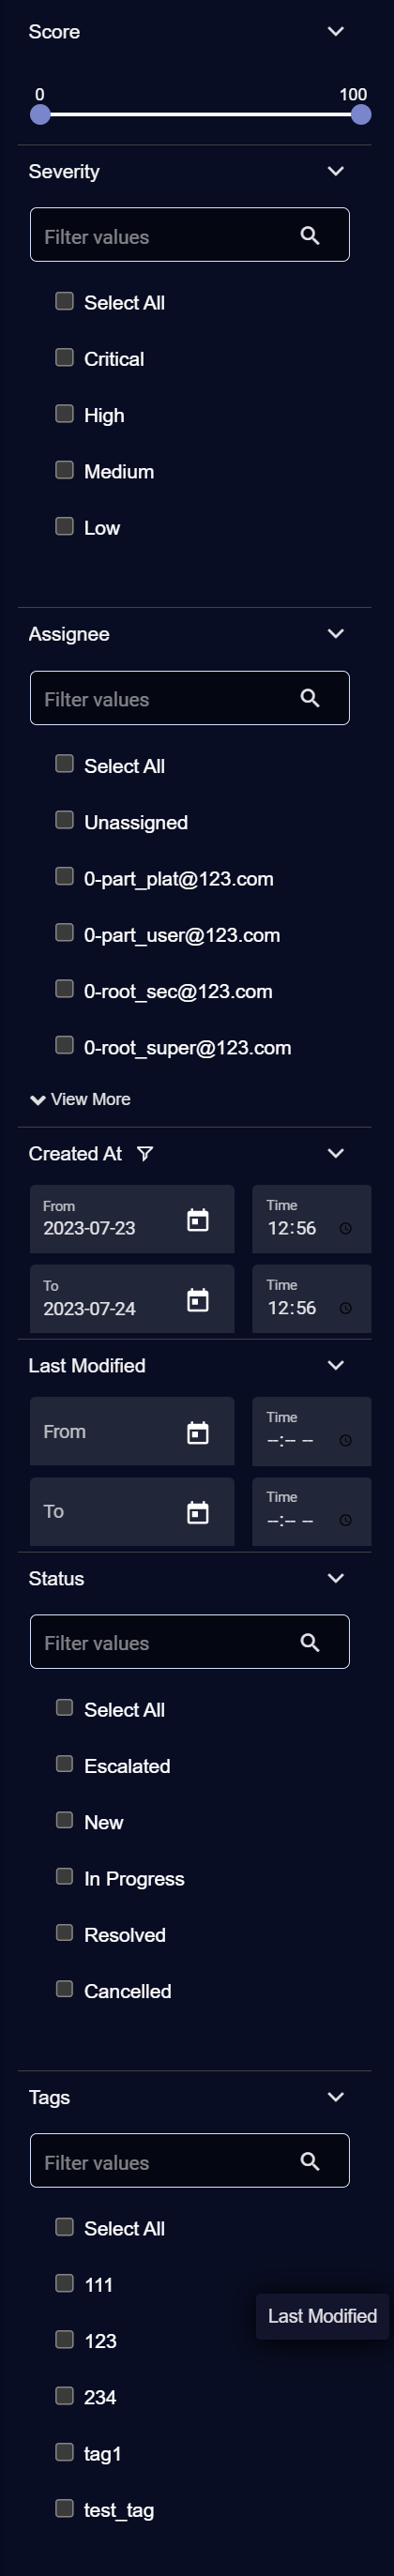
Score – Use the slider bar to specify the range of case scores from 0-100 to display.
-
Severity– Check the boxes for the case priorities to display (Critical, High, Medium, and/or Low).
-
Assignee – Start typing in the Search field to see a list of matching user accounts that can be selected as a filter or choose one of the listed users. Users only appear for selection if they have the Edit Cases privilege assigned in Role-Based Access Control and belong to the logged-in tenant. You can select multiple users for the filter.
-
Created At– Use the date controls to specify a range for the creation dates of the cases to display.
-
Last Modified – Use the date controls to specify a range for the modification dates of the cases to display. Modifications include changes to a case's alerts, severity, status, comments, or evidence.
The dates you specify for both the Created and Last Modified filters are specified in terms of the browser's local time zone.
-
Status – Check the boxes for the case statuses to display (Escalated, New, In Progress, Resolved, and/or Cancelled).
By default, the Cases page has the Escalated, New, and In Progress Status filters enabled. You can deselect these filters and/or add additional Status filters. However, if you deselect all the Status filters, the page automatically enables the default Escalated, New, and In Progress filters again.
-
Tags – Start typing in the Search field to see a list of matching tags that can be selected as a filter or choose one of the listed tags. You can select multiple tags for the filter.
The figure below shows the Case Filters panel with all default filter criteria cascaded open:
Searching the Case Table
The Case table includes a Search tool at the top of the display that lets you perform a text-based search using Lucene syntax for a specified value. Keep in mind the following when searching Cases:
-
The data returned by the search is limited to just those entries that pass the current Case filters.
-
The search is performed across all available pages of cases, not just the currently displayed page. For example, if there are three pages of 20 cases available in the Case table, matches can be found on any of the three available pages, regardless of the sort order.
Not All Fields Supported for Searching
-
Assignee
-
Tenant
-
Creator
-
Modified By
-
Who
-
What
Performing Bulk Actions in the Case Table
The Case Table supports bulk edits to the Status, Tags, or Assignee of multiple cases. Use the following procedure:
-
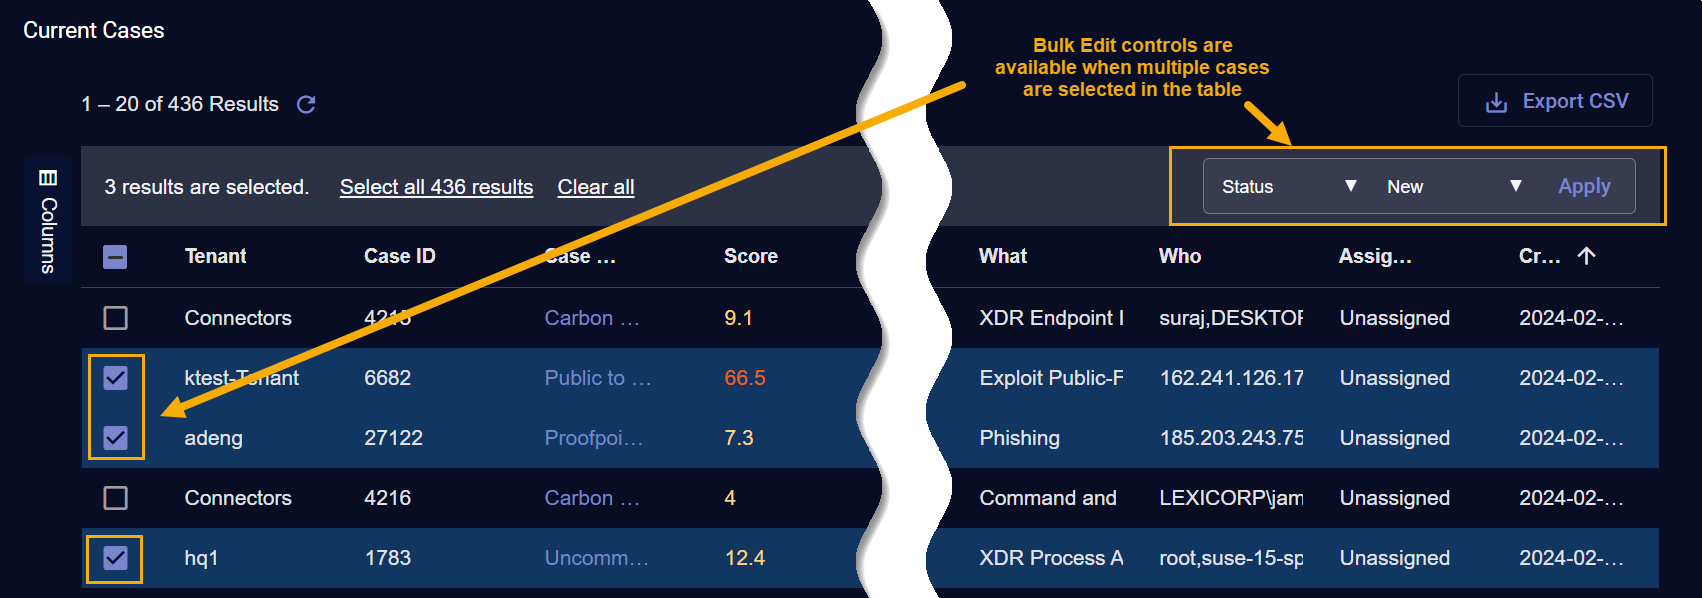
Select one or more cases in the Case Table by checking their boxes at the left of the table.
New Bulk Edit controls appear at the top of the table, as illustrated below:
-
Select the type of Bulk Action want to perform from the dropdown:
-
Status – The adjacent dropdown lets you select any of the standard Case statuses (Escalated, New, In Progress, Resolved, or Cancelled).
-
Tags – The adjacent dropdown lets you select from any existing tags. You can also type in a new tag.
-
Assignee – The adjacent dropdown lets you select any existing user available to your tenancy.
-
-
Click the Apply button to apply your bulk action to the selected cases.
Keeping Track of Bulk Actions
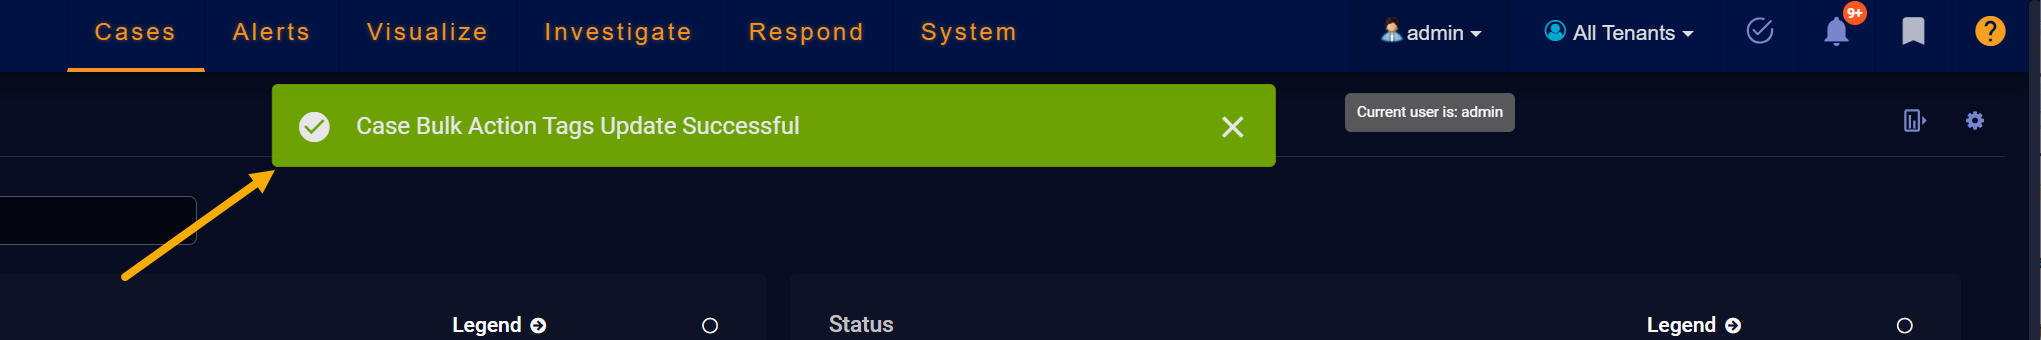
Once you apply a bulk action to one or more cases, Stellar Cyber displays a success or failure message at the top of the display and keeps track of its progress in the Task List.
Here's an example of a Bulk Action that was successfully applied:
You can display the Task List using its icon at the top of the display, as illustrated below. The Task List keeps track of the progress, success, or failure of any bulk actions performed from the Case Table. Depending on the number of cases affected by a bulk action, it make take a few seconds for the action to complete. The Task List is useful in these situations, letting you see the progress of the action. Here's how you display the Task List, complete with some successful bulk actions:
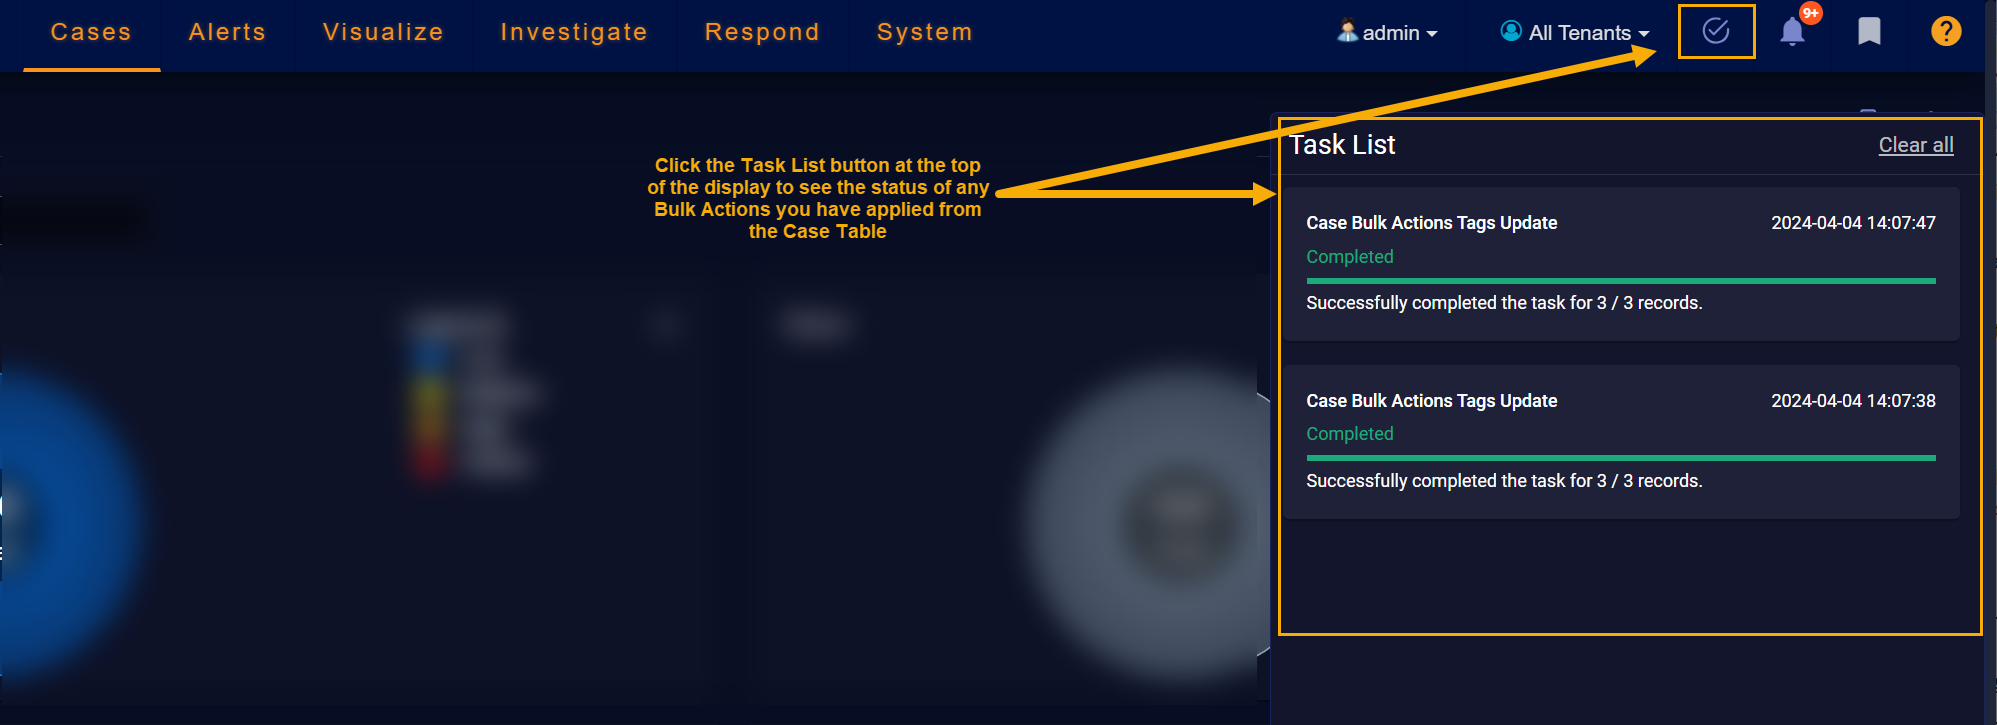
You can clear individual tasks from the list using the standard close button at the upper right of their entries in the list. Clear all of the tasks using the Clear all link at the top of the list.
Standard Case Table Functionality
The Case table offers standard table functionality, including the ability to sort on a column, pin columns, autosize columns, reset column sizes, Export as CSV, or Change Columns.
Setting Global Case Settings
Users with a User Scope of root and RBAC privileges to change user interface settings can click the Settings  button at the upper right of the Case table to change Global Case Settings, as illustrated below:
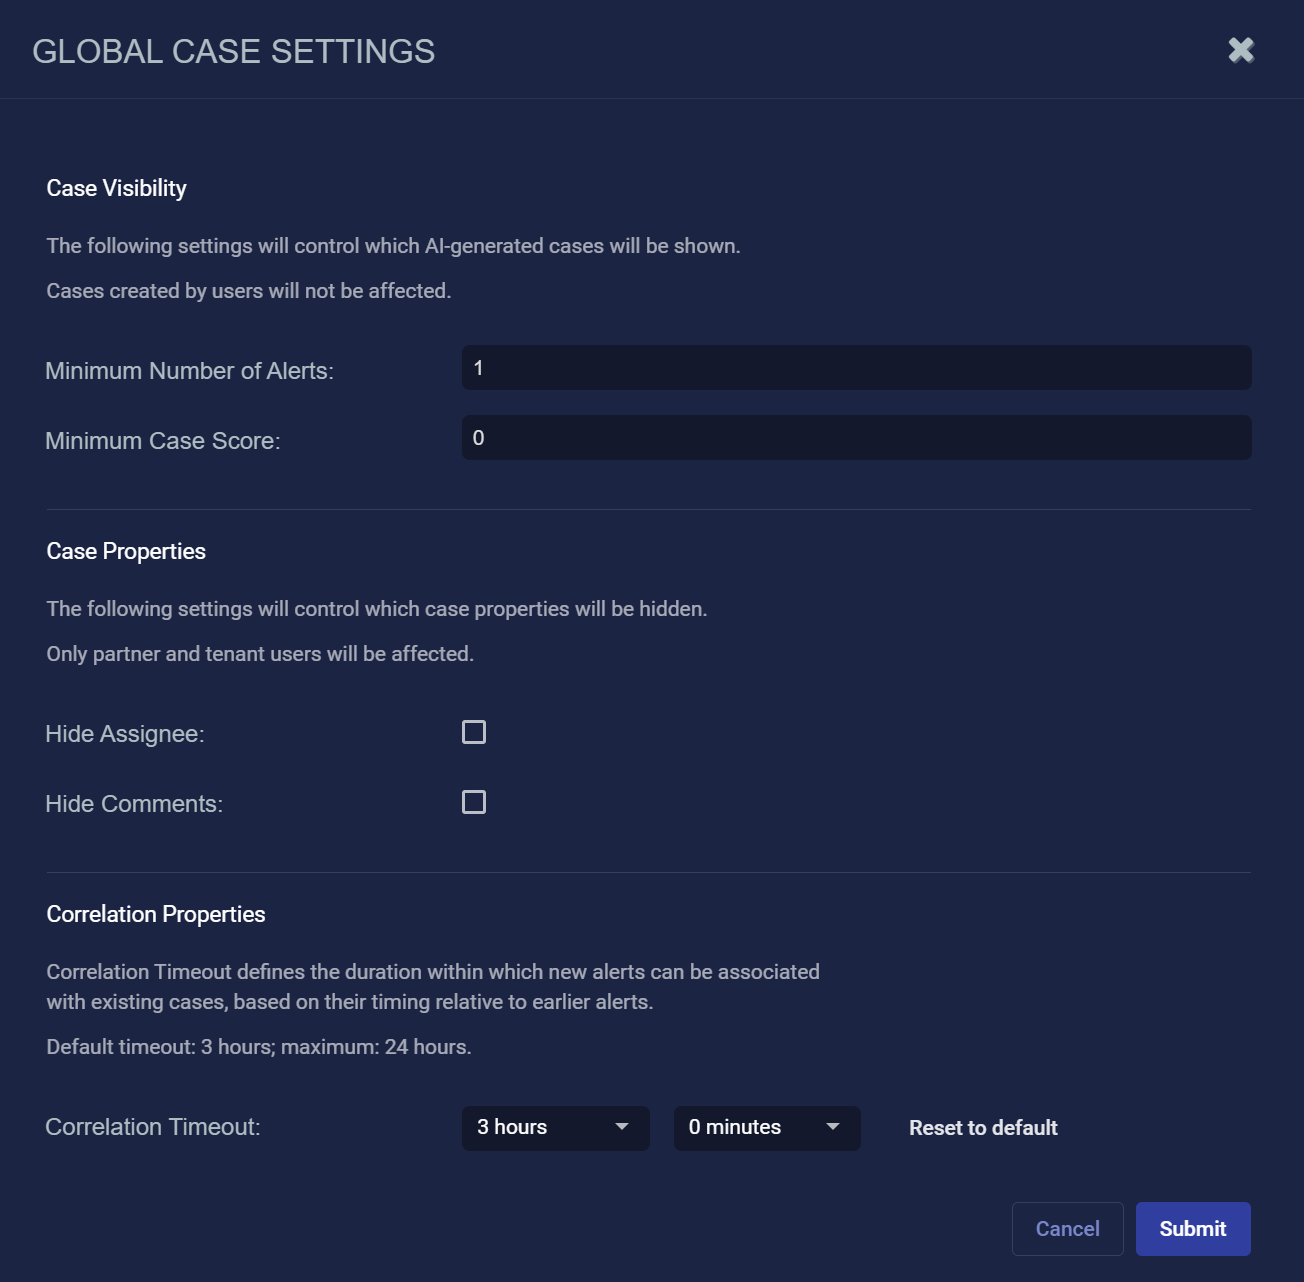
See the sections below for information on configuring Global Case Settings.
Setting the Case Visibility Options
The Case Visibility options let root users specify the minimum number of alerts and case score for system-generated cases to be displayed.
Note that these settings only apply to system-generated cases. They do not apply to cases created by users. In addition, they are display filters. They control whether cases meeting the criteria are displayed, not whether they are created. Refer to Understanding Cases for more information on when cases are created.
Default/Minimum/Maximum Settings
The default, minimum, and maximum settings are as follows:
-
Minimum Number of Alerts – Default value of two, minimum value of one, no maximum. A case must have at least the minimum number of alerts specified here to be displayed. Cases with fewer alerts are still created but are not displayed.
-
Minimum Case Score – Default value of one, minimum value of zero, maximum of 100. A case must have at least the minimum score specified here to be displayed. Cases with lower scores are still created but are not displayed.
This means that with the default settings, a system-generated case must have at least two associated alerts and a minimum score of one to be displayed.
Changing either of these settings will typically reveal or hide more cases.
Scope of Case Visibility Settings
The settings made with these options affect the display of cases in both the XDR Kill Chain Dashboard and all case displays. They do not, however, affect the display of cases in the Cases tab of the Event Detail display for an alert. That tab displays all associated cases, regardless of the number of associated alerts.
Ensuring All Alerts Appear in Case Displays
Depending on your environment, you may want to ensure that all alerts appear in cases. Set the options in the Global Case Settings dialog box as follows to ensure that all alerts appear in case displays:
- Minimum Number of Alerts – 1
-
Minimum Case Score – 0
About Single-Alert Cases
Starting with the 5.2.0 release, Stellar Cyber creates cases for all alerts, including those without any observables. Only the following alerts are not correlated into cases:
-
Alerts from the Sensor index (Data Ingestion Anomaly and Sensor Status Anomaly).
In contrast to previous releases, this means that Stellar Cyber now creates single-alert cases for the following situations:
-
Alerts where no user or asset can be found.
-
Alerts from third-party cloud alert integrations, such as AWS GuardDuty.
-
Alerts from automated threat hunting with only raw data.
Note that you will only see single-alert cases if you change the Minimum Number of Alerts option in Global Case Settings from its default value of two to one. The single-alert cases are created regardless of how Minimum Number of Alerts is set; this option only controls whether they are displayed.
This approach ensures that users who rely on a case-driven approach to managing security events can see all alerts surfaced as cases in Stellar Cyber.
All alerts that can be correlated to cases can also be synchronized to ServiceNow via an active InSync, when configured.
Cases created for alerts without any observables may not be able to display values for all fields, including the Who field in the Case Detail display, as well as the Case Graph in the Analysis tab. If you'd prefer not to see single-alert cases, you can leave the Minimum Number of Alerts option in Global Case Settings set to two (the default) or higher. With this setting, Stellar Cyber still creates single-alert cases, but does not display them. Refer to Setting Global Case Settings for details.
Searching for Alerts Without Correlated Cases
You can use the following search in the Lucene Search bar in either the Alerts or Threat Hunting page to see alerts that have not been correlated to cases in the current time window:1
(NOT ( (_exists_:(xdr_event.name OR event_name) AND _exists_:orig_index) OR (stellar.ath.type:raw AND stellar.ath.to_incident:true))) OR xdr_event.name: (ade_outbytes_anomaly OR ade_outbytes_anomaly_flip)
Setting Case Properties
The Case Properties options let root users specify whether partner and tenant users can see case assignees and comments:
-
Hide Assignee – Check this box to hide case assignees from partner and tenant users.
-
Hide Comments – Check this box to hide case comments from partner and tenant users.
Users with root scope can still see case assignees and comments regardless of the settings of these options.
Setting the Correlation Timeout
The Correlation Properties settings let you specify a global Correlation Timeout for your organization. The Correlation Timeout specifies the time window within which new alerts are considered for correlation into both new and currently open cases.
An alert can be correlated into an existing case if it occurs within a specific time window of the case. This time window is determined by Correlation Timeout, which is the amount of time that has passed after the latest alert that was correlated into the case or before the case's earliest correlated alert. The figure below illustrates how this works:
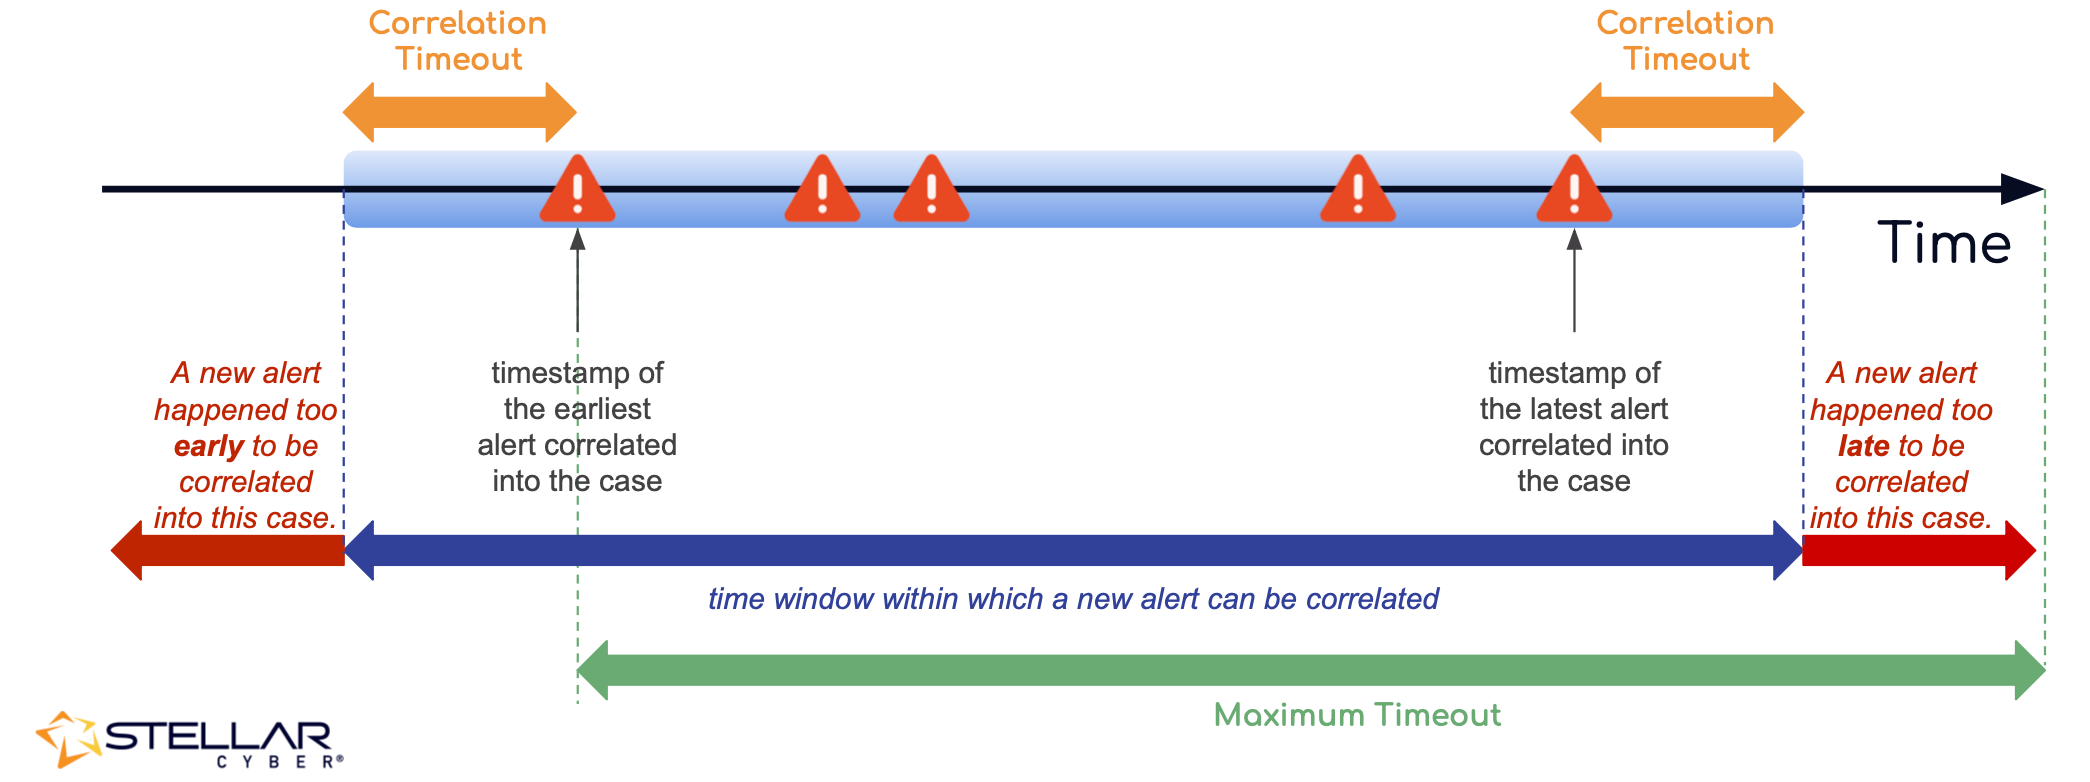
As summarized in the figure above:
-
A new alert is not considered for correlation if it occurs after the amount of time specified by the Correlation Timeout has passed since the last correlated alert for the case. An alert such as this has occurred too late for correlation.
-
A new alert is not considered for correlation if it occurs earlier than the amount of time specified by the Correlation Timeout before the earliest alert associated with the case. An alert such as this has occurred too early for correlation into the case.
The default Correlation Timeout is three hours; the maximum is 24 hours.
Use the dropdowns to specify the Correlation Timeout for your organization in hours and minutes. The user interface does not let you specify a value greater than 24 hours. You can always use the Reset to default option to restore the default value.
Changes to the Correlation Timeout apply only to open and new cases. Closed cases are not updated with additional alerts based on a change to the Correlation Timeout. However, it is possible that a change to the Correlation Timeout can result in additional alerts being correlated to an open case that took place before the previously reported earliest alert.
Refer to Understanding Cases for a detailed discussion of how cases are created and correlated.
Drilling to the Case Detail Page
You can click on a case's entry in the Case table to drill to the Case Detail view for the corresponding Case.
Displaying Cases from Event Details
In addition to accessing the Case table from the Cases menu, you can also display a filtered Case table from the Cases list in an alert's Event Details view.
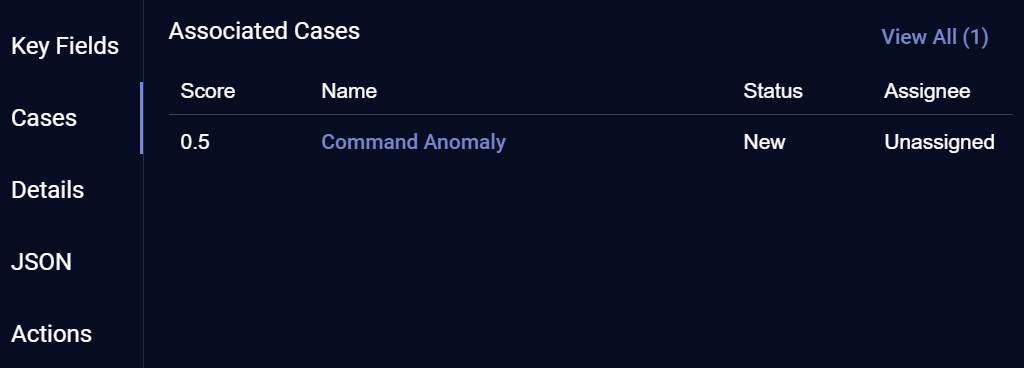
The Cases list shows cases associated with the selected alert in descending order by score, up to a maximum of five. You can click the View All (x) link at the upper right of the list to open a new tab with a filtered view of the Case summary page showing just those cases associated with the selected alert. You can also click an individual case's entry in the list to open its associated Case details page. The figure below shows the Cases list for a sample alert's Event Details view:
About Case Data Retention
To control the number of stored cases and improve the overall performance of case queries, Stellar Cyber stores a case for a maximum of one year from the time of its last update.
