Threat Hunting
Use this screen to examine network events of interest with an emphasis on security anomalies. There are 4 tabs:
-
Interflow Search: The default tab, an overview of all events. From here, you can use the following query tools:
-
Main Search Field: Use keywords to search the data lake
-
Visual Dictionary: Select keywords from a list, then filter values from chart legends
-
Table Search Field: Use keywords to search within the displayed results
-
-
Correlation Search: Visualize alert type correlations
-
Threat Hunting Library: Use an alert type to narrow your hunt
Each of these tabs is described in a following section.
As with other Stellar Cyber pages that display event information, the data shown is subject to the filter controls at the top of the screen. See the Queries page for more details.
Interflow Search
The Investigate | Threat Hunting interface uses the Interflow Search tab as its default display, as shown in the figure below.
All results in this screen are additionally filtered according to the parameters at the top of the screen, such as Time Interval. If you select multiple indices, the interval may be automatically adjusted to a smaller duration for efficiency.
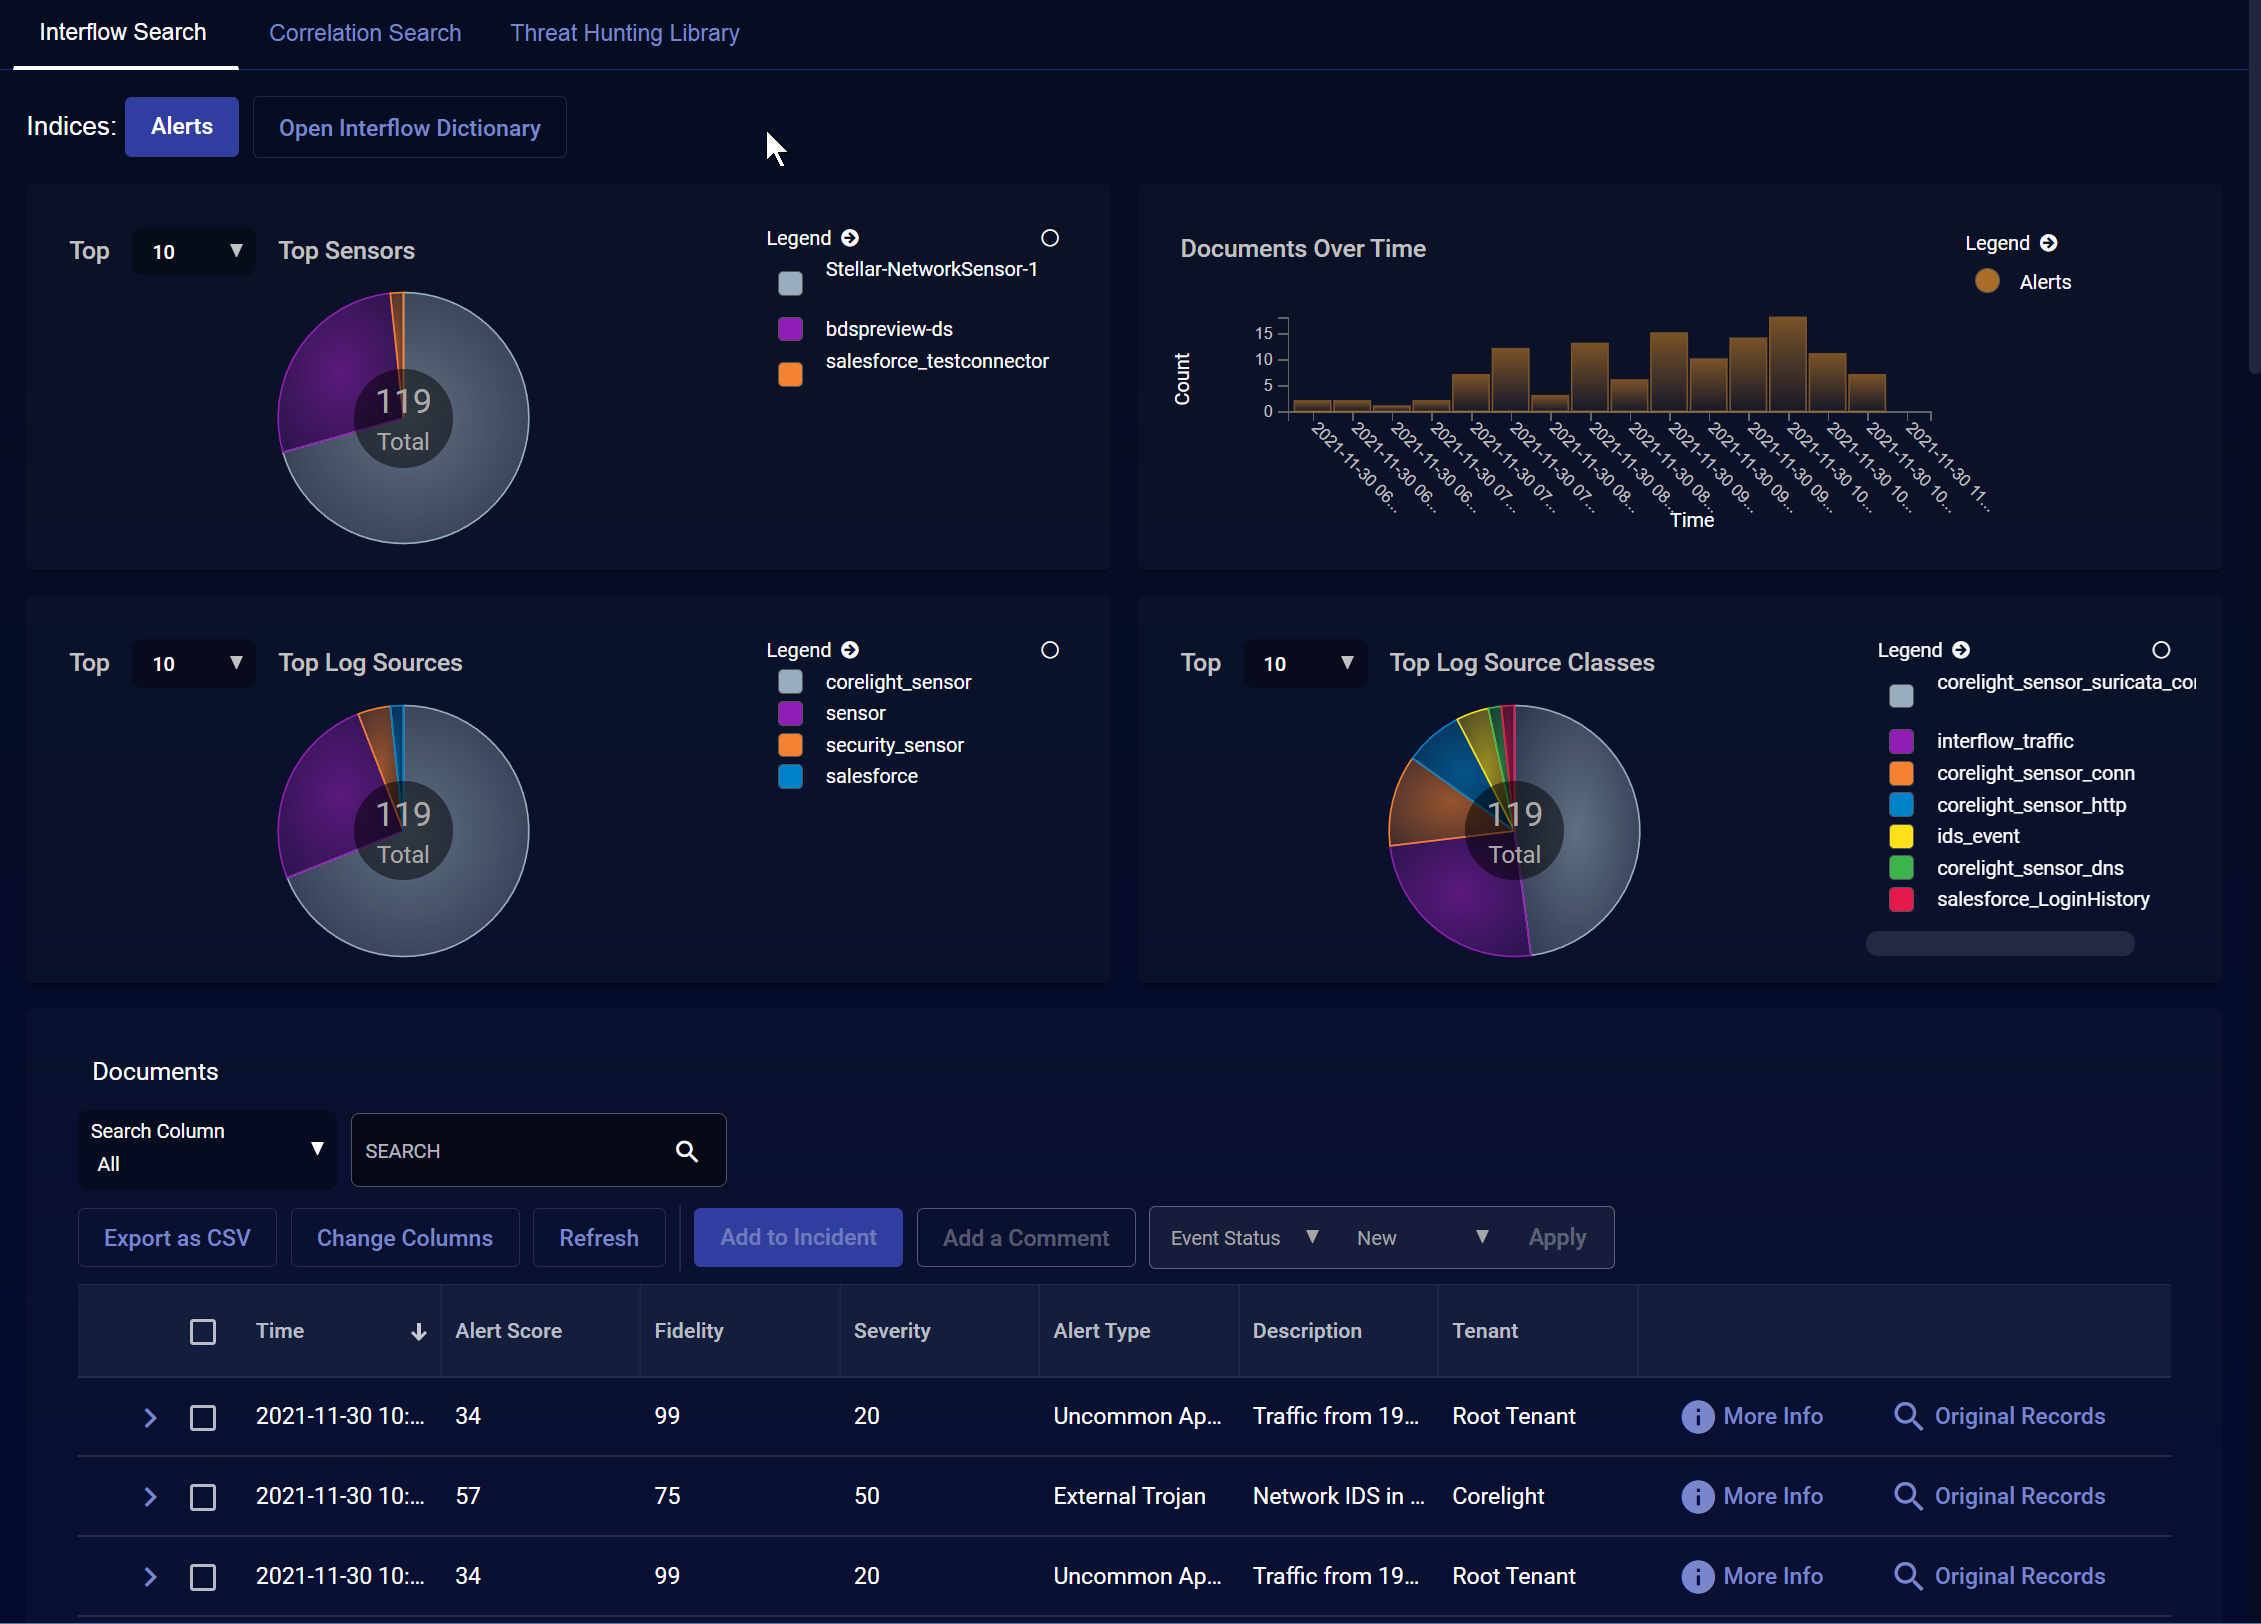
The most important control on this screen is the Indices selector. The Stellar Cyber data lake supports the following indices:
- Alerts (default)
- Assets
- AWS Events
- DP Monitoring
- IDPS/Malware Sandbox Events
- Linux Events
- Scans
- Sensor Monitoring
- Signals
- Syslog
- Traffic
- Users
- Windows Events
You can choose a single index, multiple indices, or even all indices.
Searches through multiple indices can be resource intensive, so Stellar Cyber will restrict the time interval to reduce the performance impact.
Interflow Search Using the Search Field
Use the same search syntax in this field as you use elsewhere in the Stellar Cyber UI to isolate specific records. Ideally, you set the index first and then search for a specific pattern, such as srcip:10.20.25.119. (You can start with the Visual Dictionary to learn more about the fields to query, if needed.)
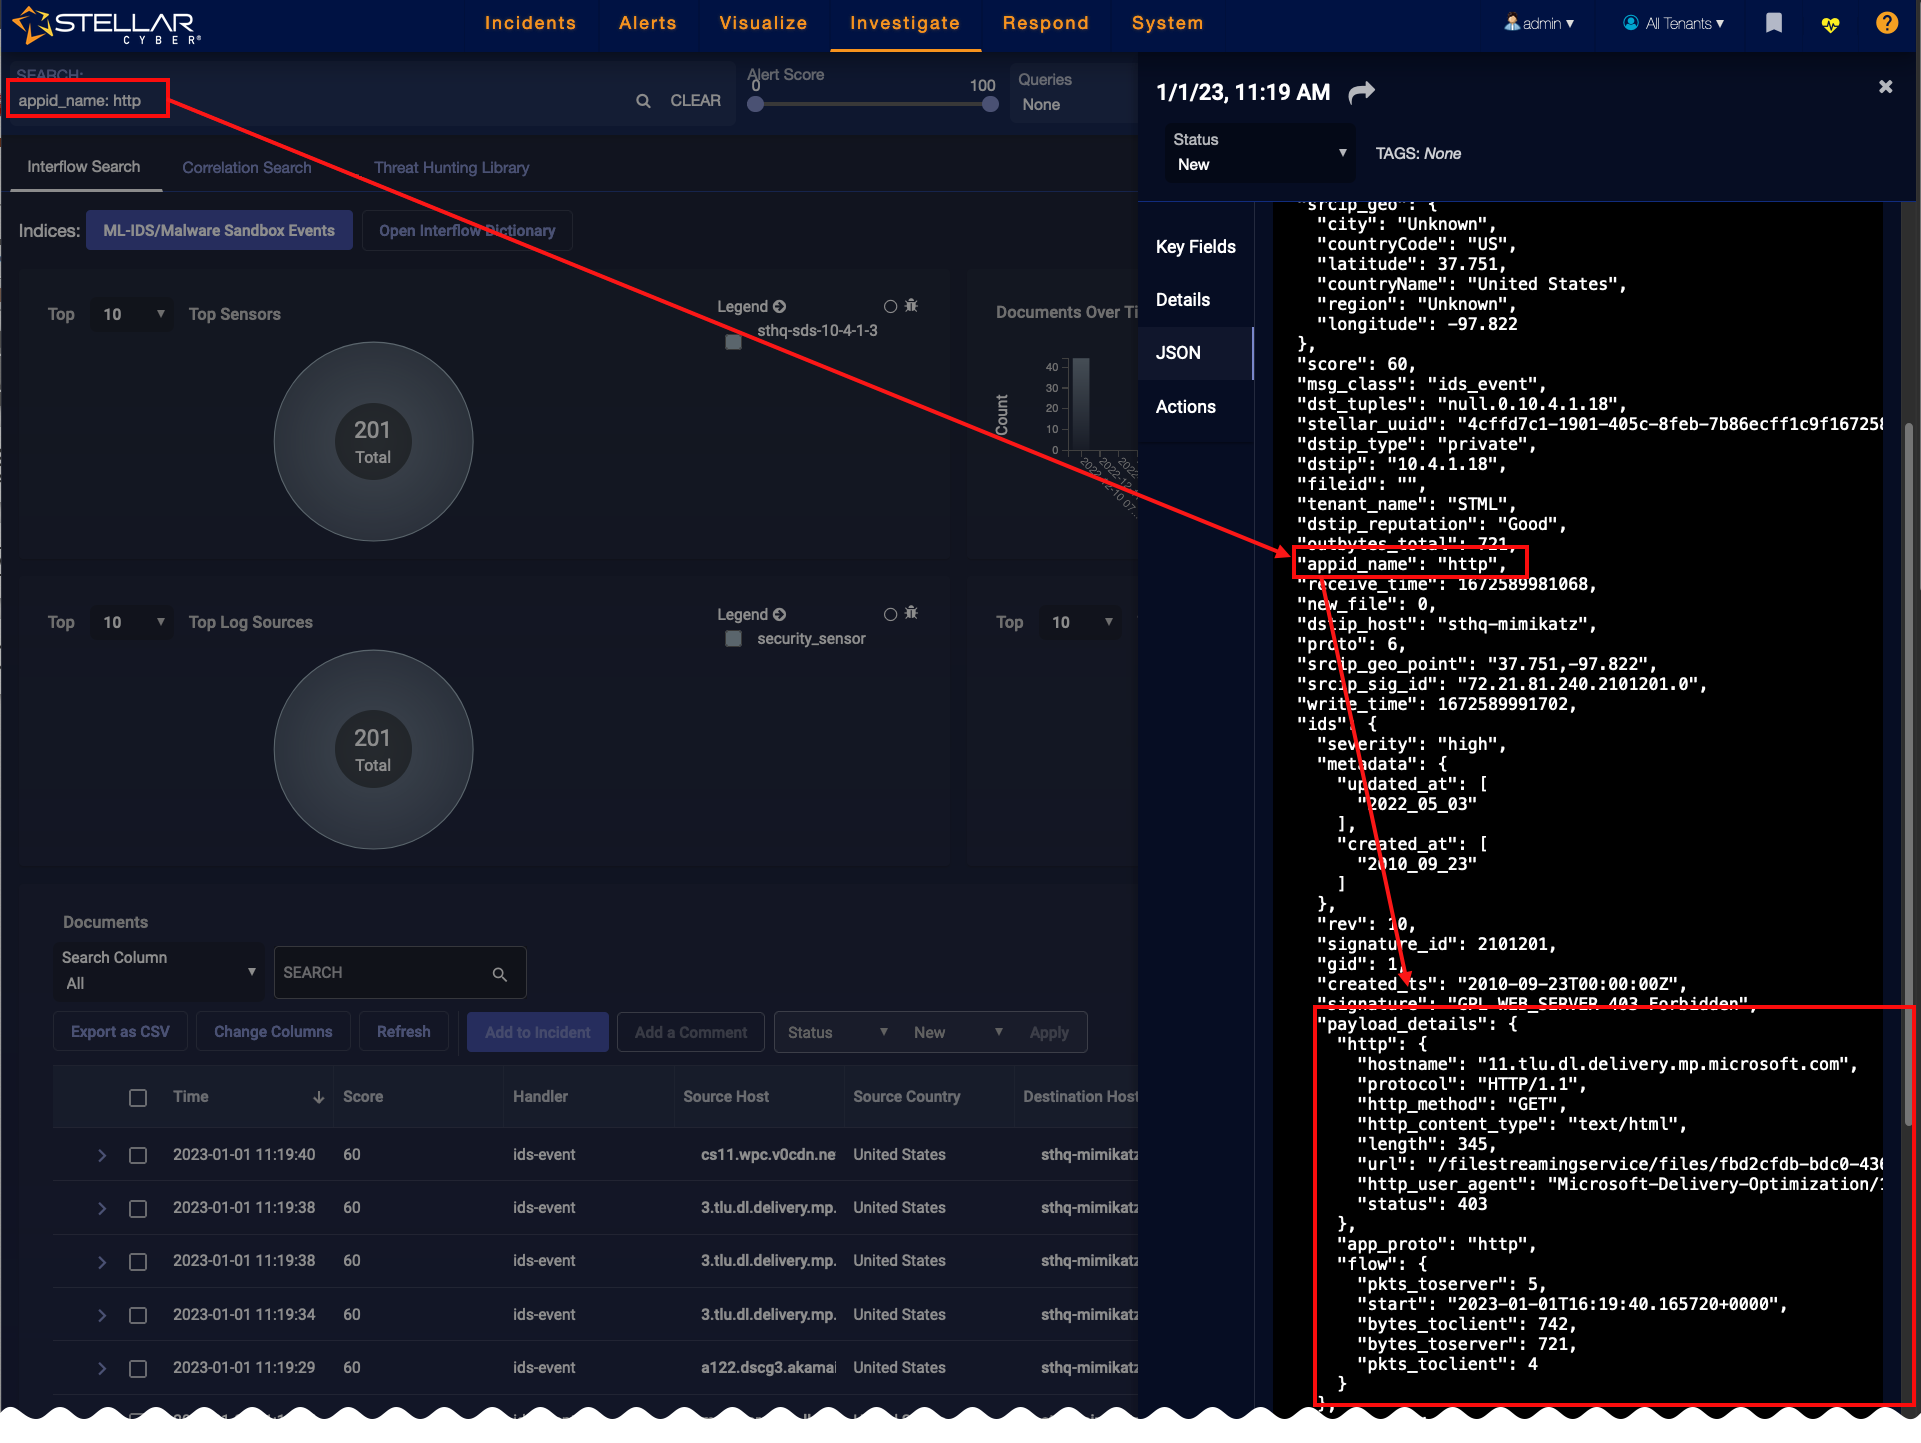
Following is an example search for IDS records with payload data. The payload feature is supported with dns and http, so let's create a query that searches for just this feature for just that app type.
-
Access Investigate | Threat Hunting.
-
Set the index to IDPS/Malware Sandbox Events.
-
In the Search field above the index, enter the following string, which is only present in those records (substitute
dns, as needed):ids.payload_details.app_proto:http
-
Click the search icon at the right of the field. The Documents table updates with all matching records.
-
You can now click More Info from a specific row in the Documents table to display the event details.
-
From there you can open the JSON tab and view the payload information.
Note that encrypted payload data is not parsed with this feature.
Searching for Alerts Without Correlated Cases
You can use the following search in the Lucene Search bar in either the Alerts or Threat Hunting page to see alerts that have not been correlated to cases in the current time window:1
(NOT ( (_exists_:(xdr_event.name OR event_name) AND _exists_:orig_index) OR (stellar.ath.type:raw AND stellar.ath.to_incident:true))) OR xdr_event.name: (ade_outbytes_anomaly OR ade_outbytes_anomaly_flip)
Interflow Search Using the Visual Dictionary
Click the Open Interflow Dictionary button to display Interflow data.
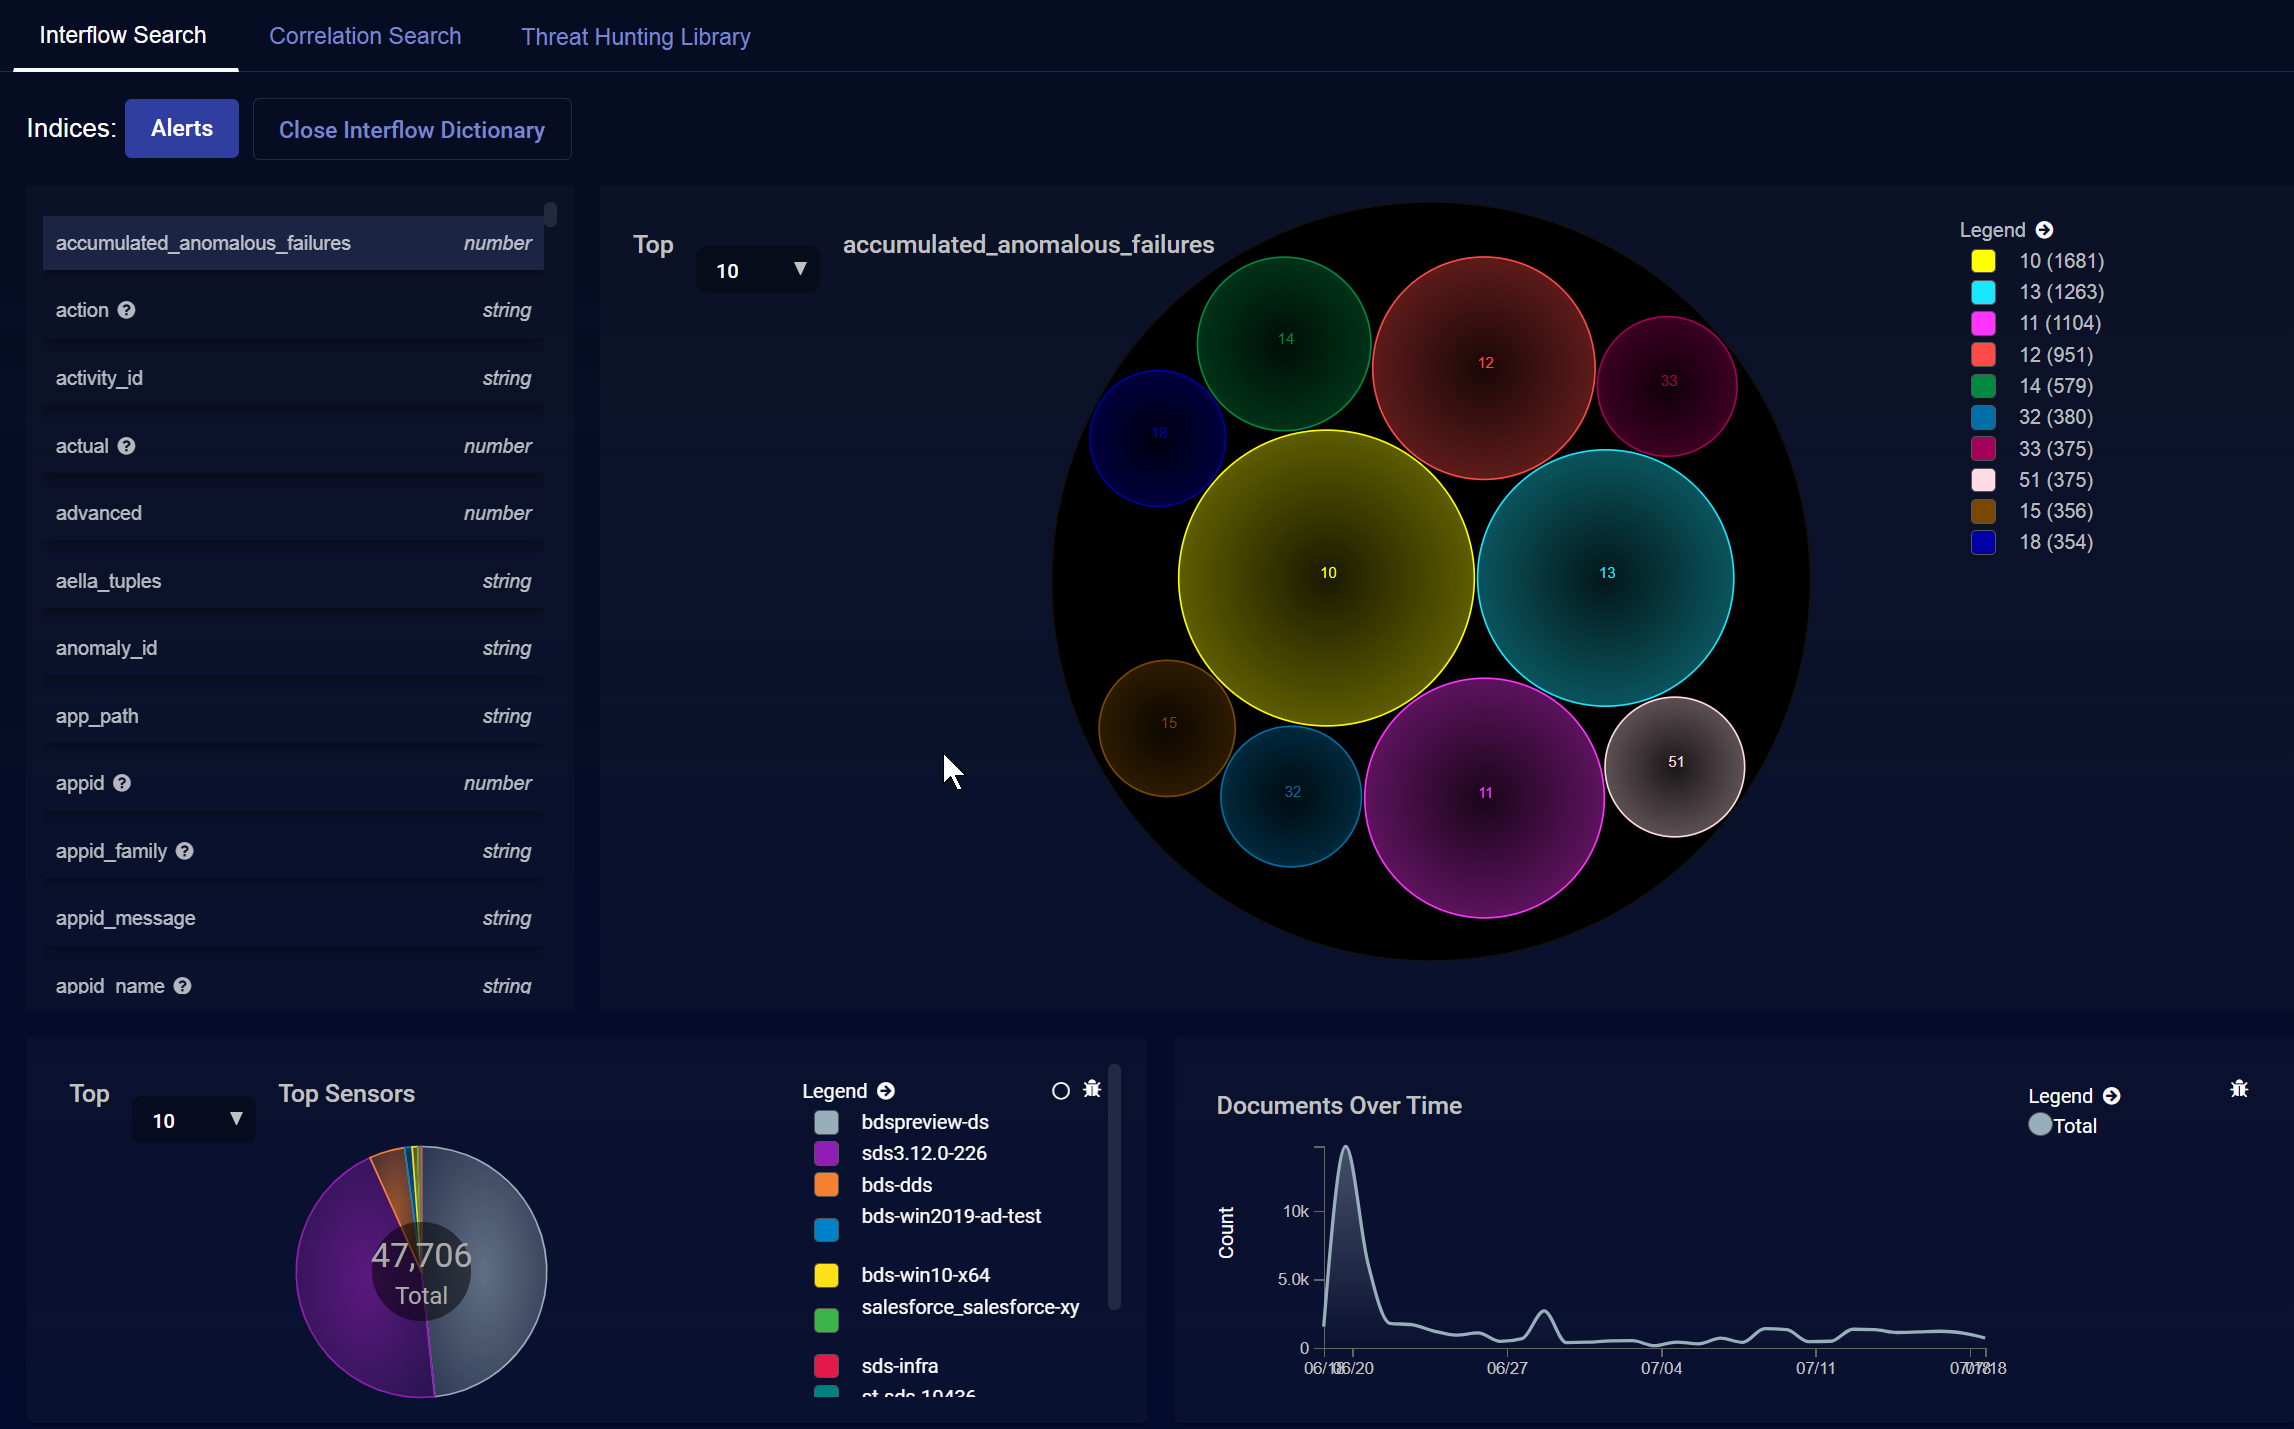
The keywords are displayed next to the visual dictionary. The visual dictionary provides a simple, visual way to hunt for threats. To begin threat hunting visually:
- Find a keyword to use as the beginning of your hunt.
- Click on that keyword. The visual dictionary immediately changes to reflect your choice. We chose srcip_geo.countryName.
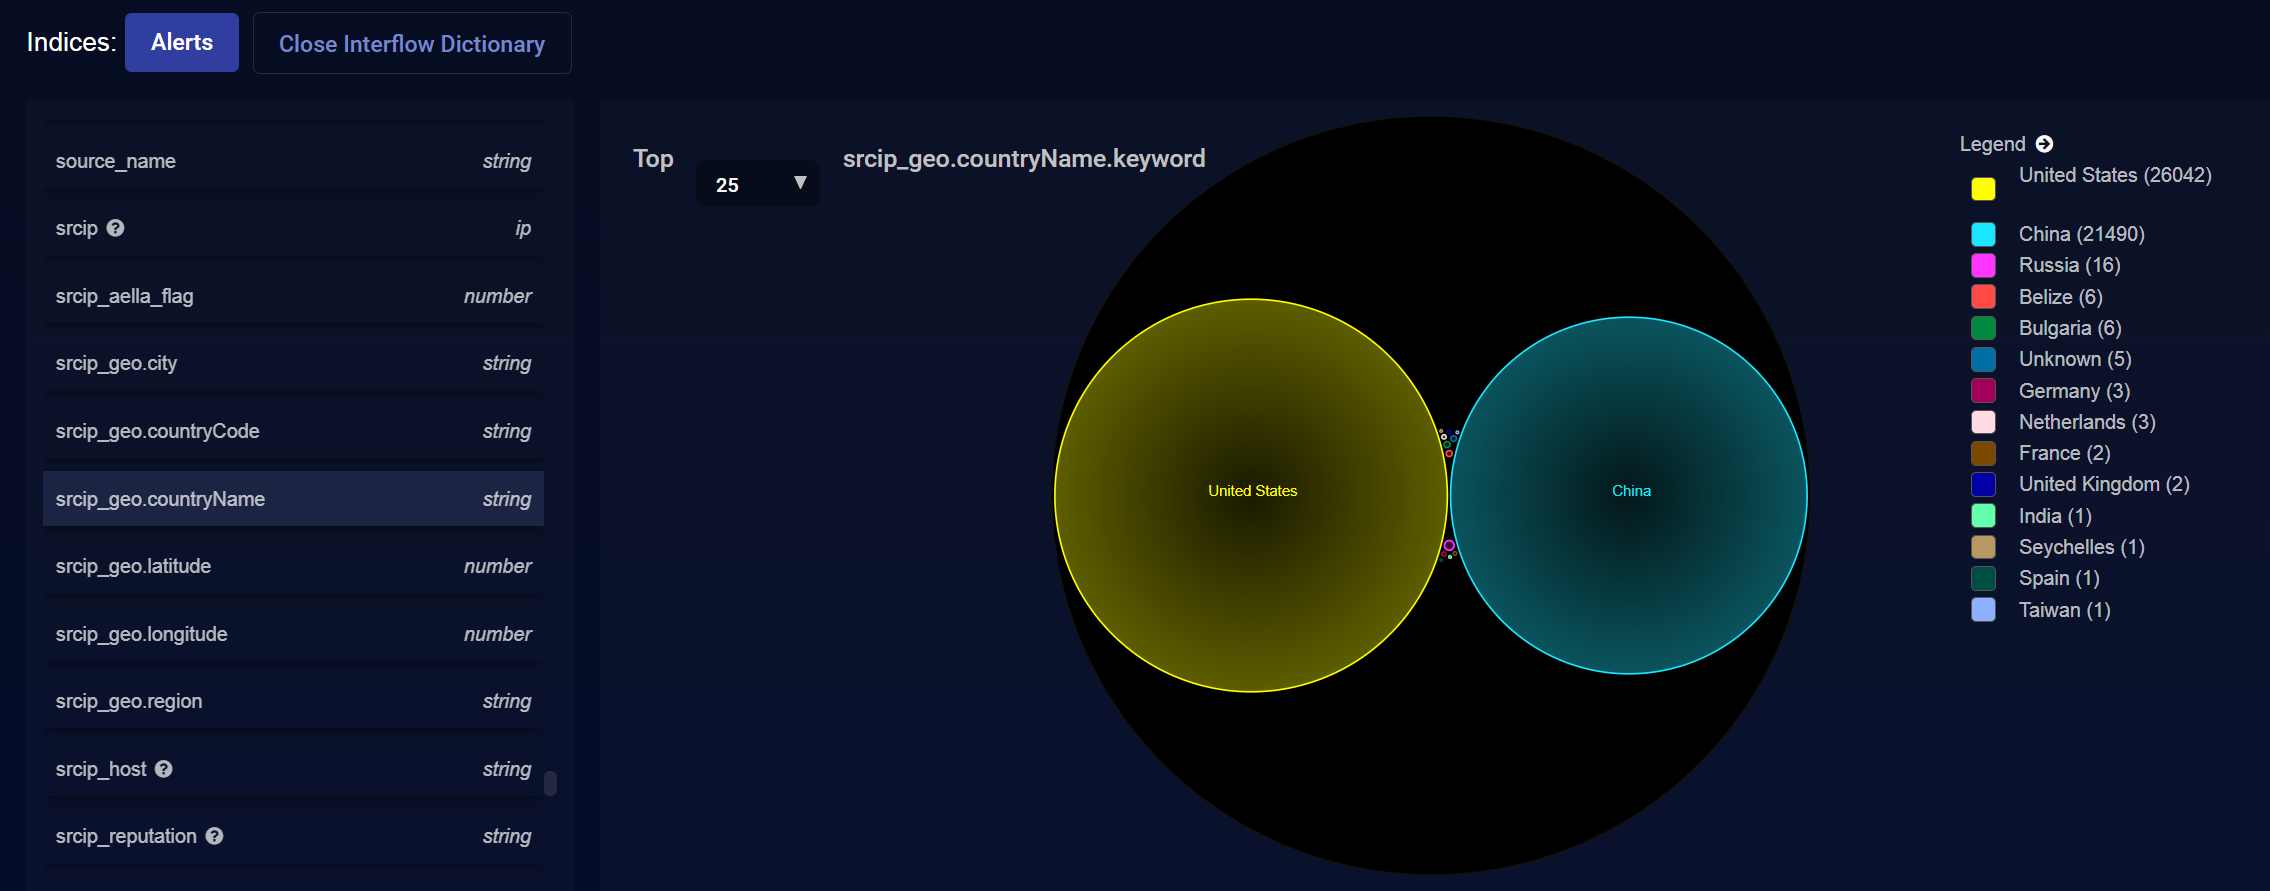
- There are five source IP addresses from an unknown country in our example. If we hover over Unknown (5) in the legend, the and buttons appear.
- If we click , Unknown is added to the filter and the results are immediately filtered. Now we only see results with a source IP address from an unknown country.
- We will find and click on another keyword to further narrow our hunt. We chose event_type. The display again immediately changes to reflect our choice.
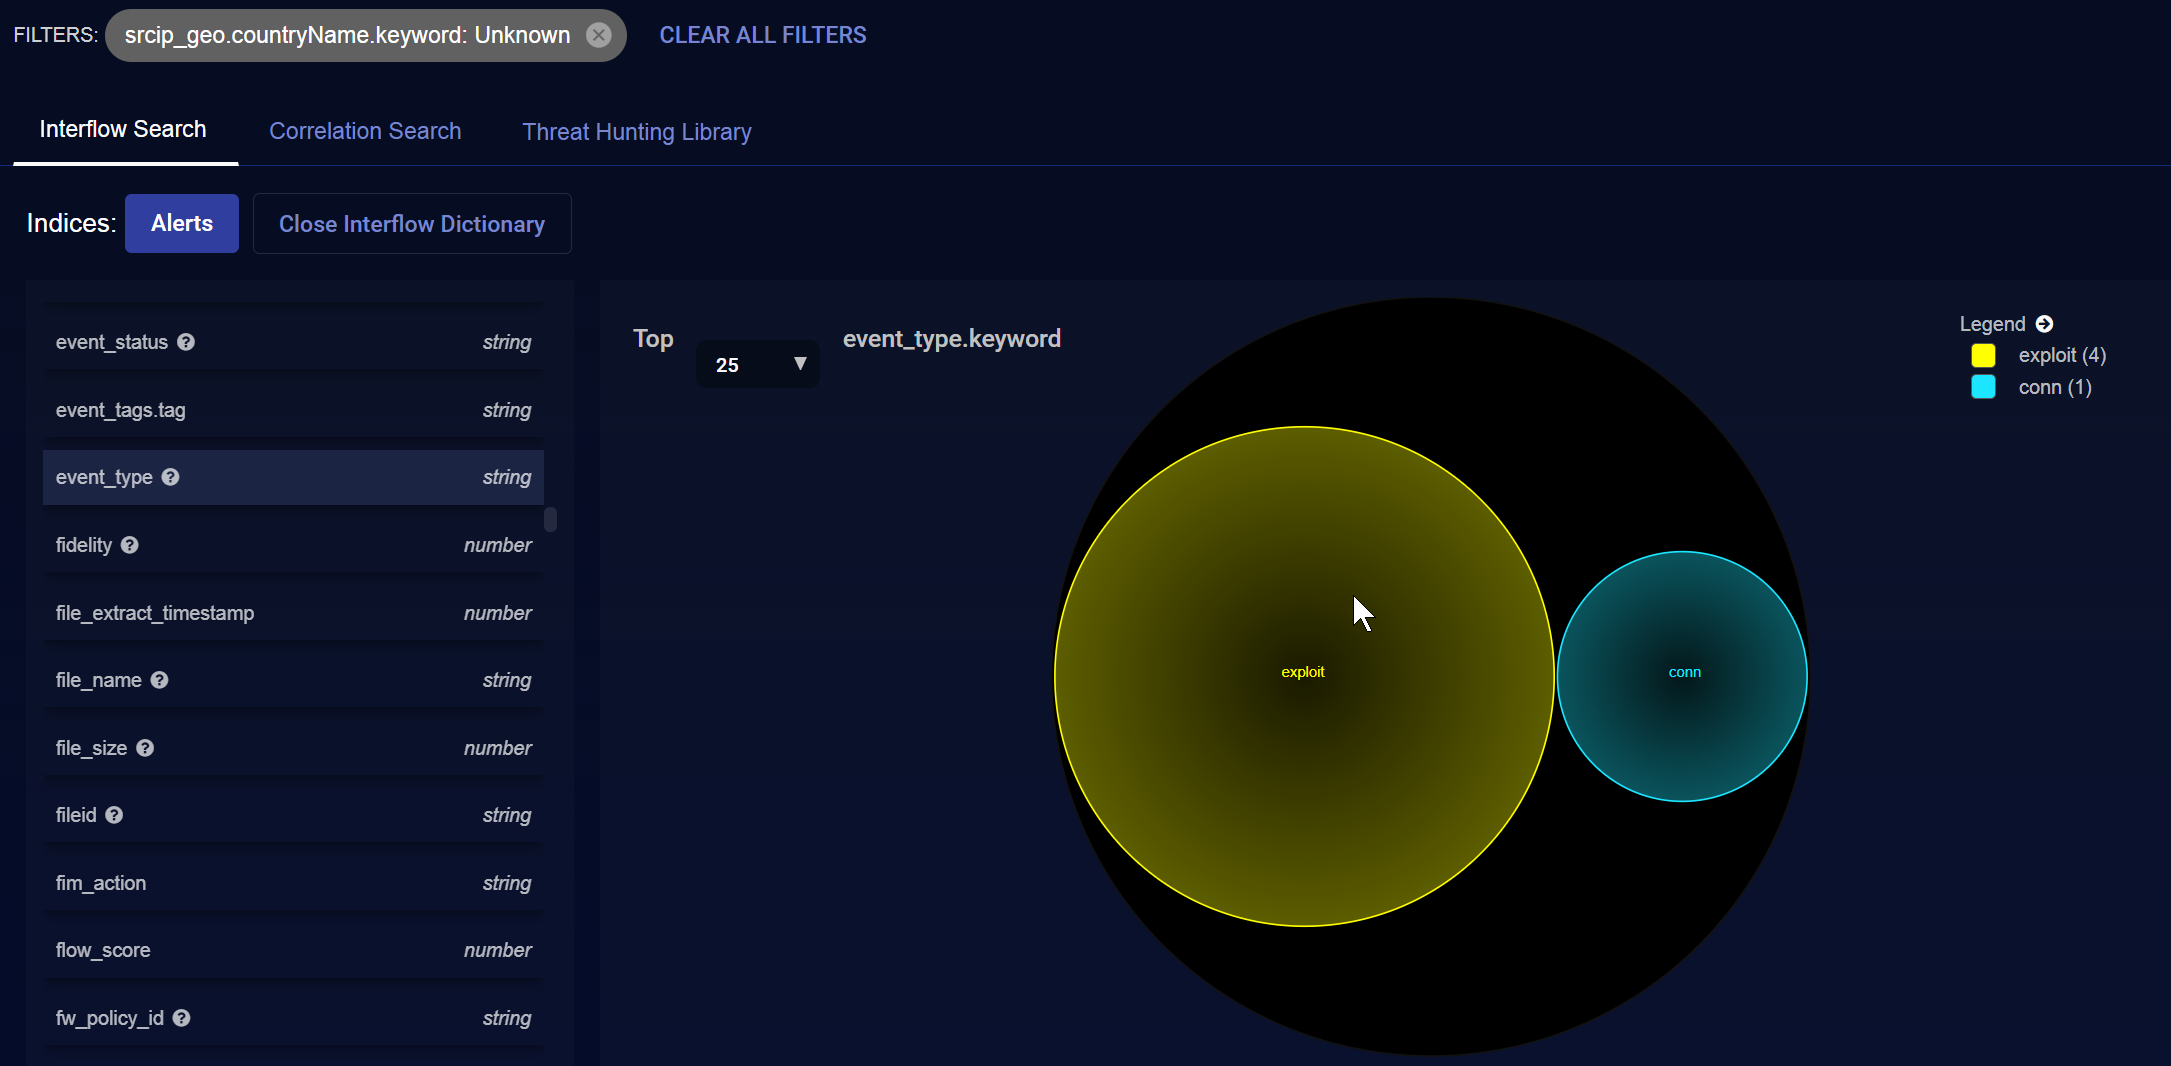
- In our example, there have been four exploits from source IP addresses from an unknown country.
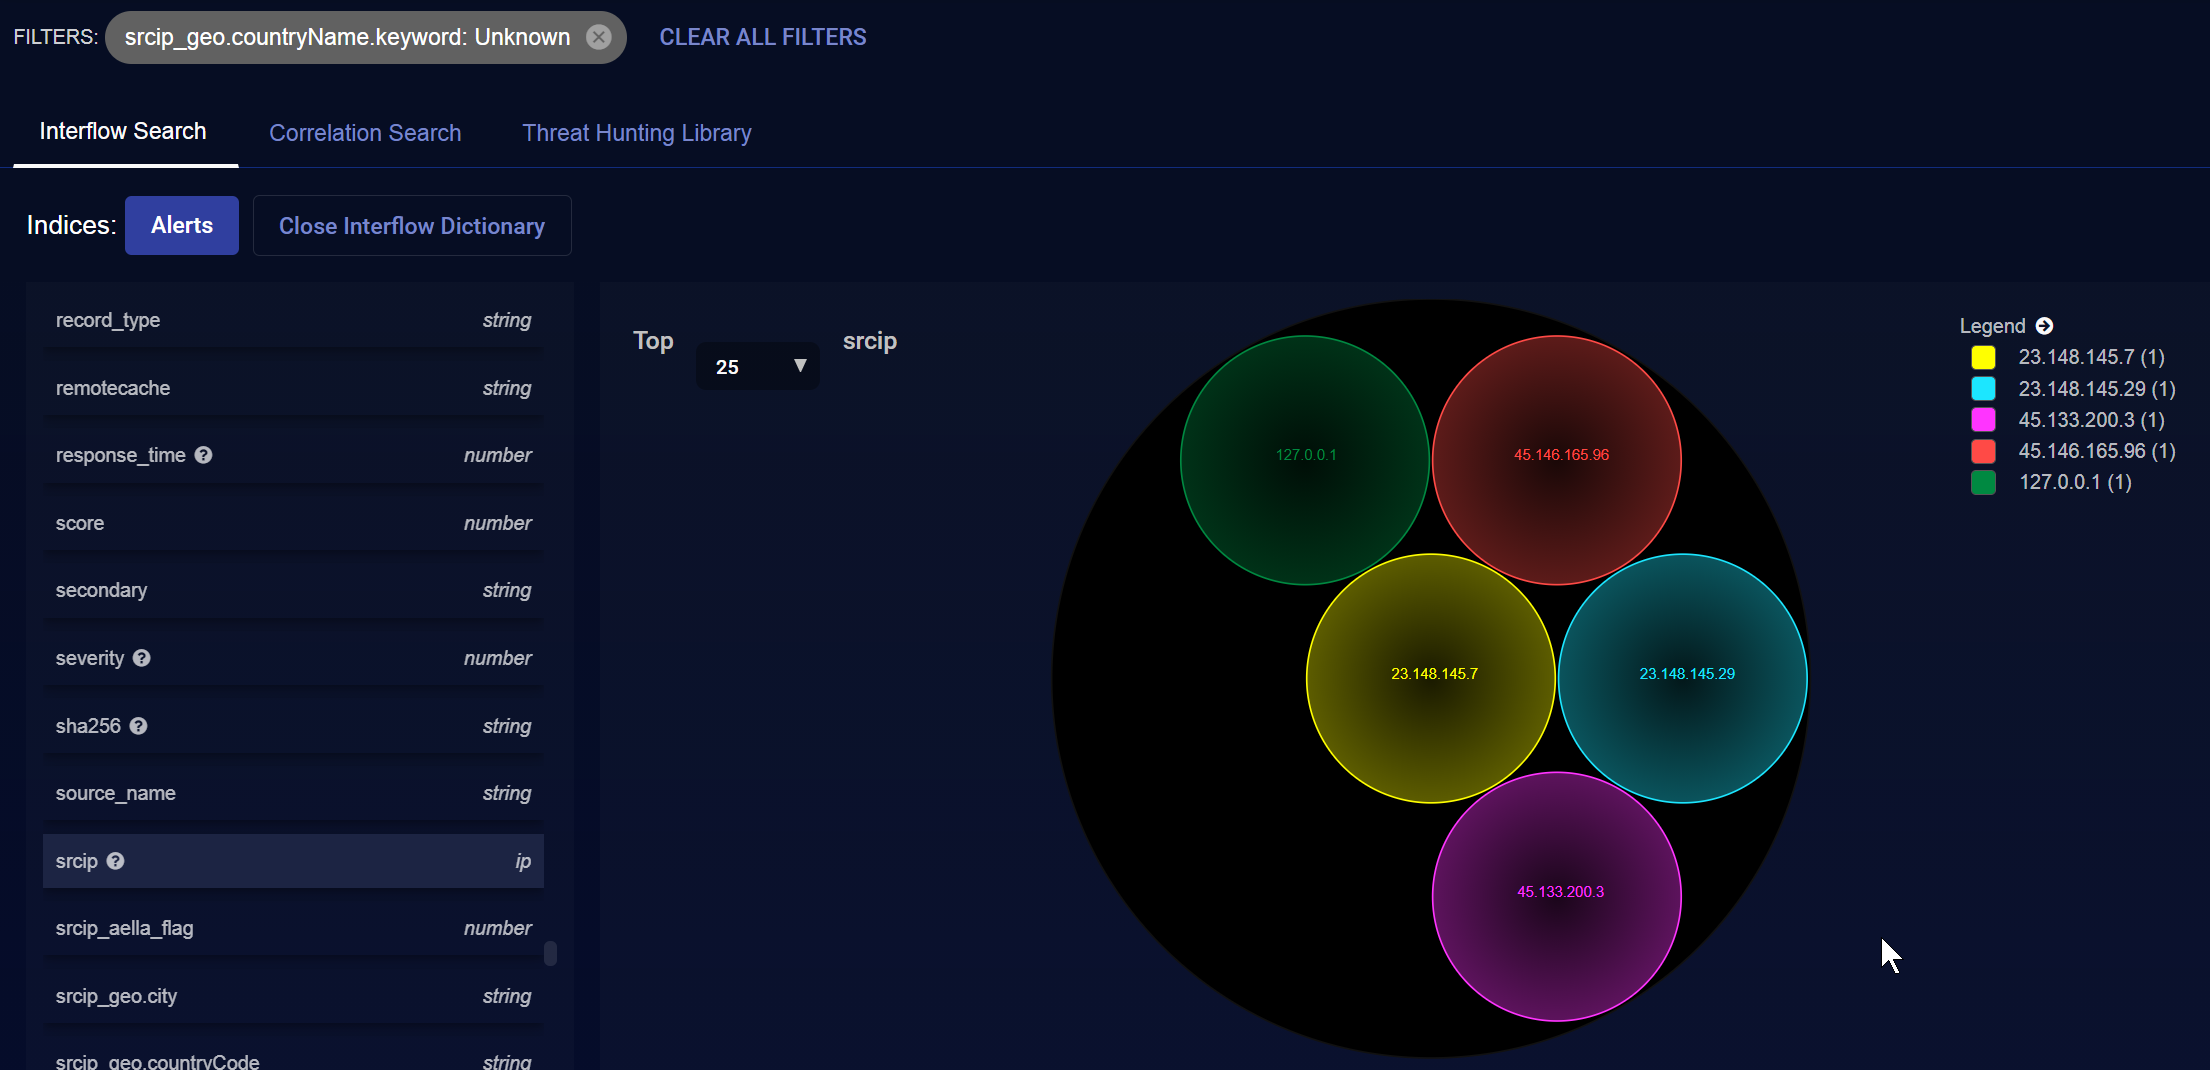
- We found and clicked on srcip. We can now see the IP addresses from which the exploits originated.
When you leave this page, any filters remain selected. So you can continue your threat hunting on other parts of Stellar Cyber.
Interflow Search Using the Table
The Interflow records table is at the bottom of the screen.
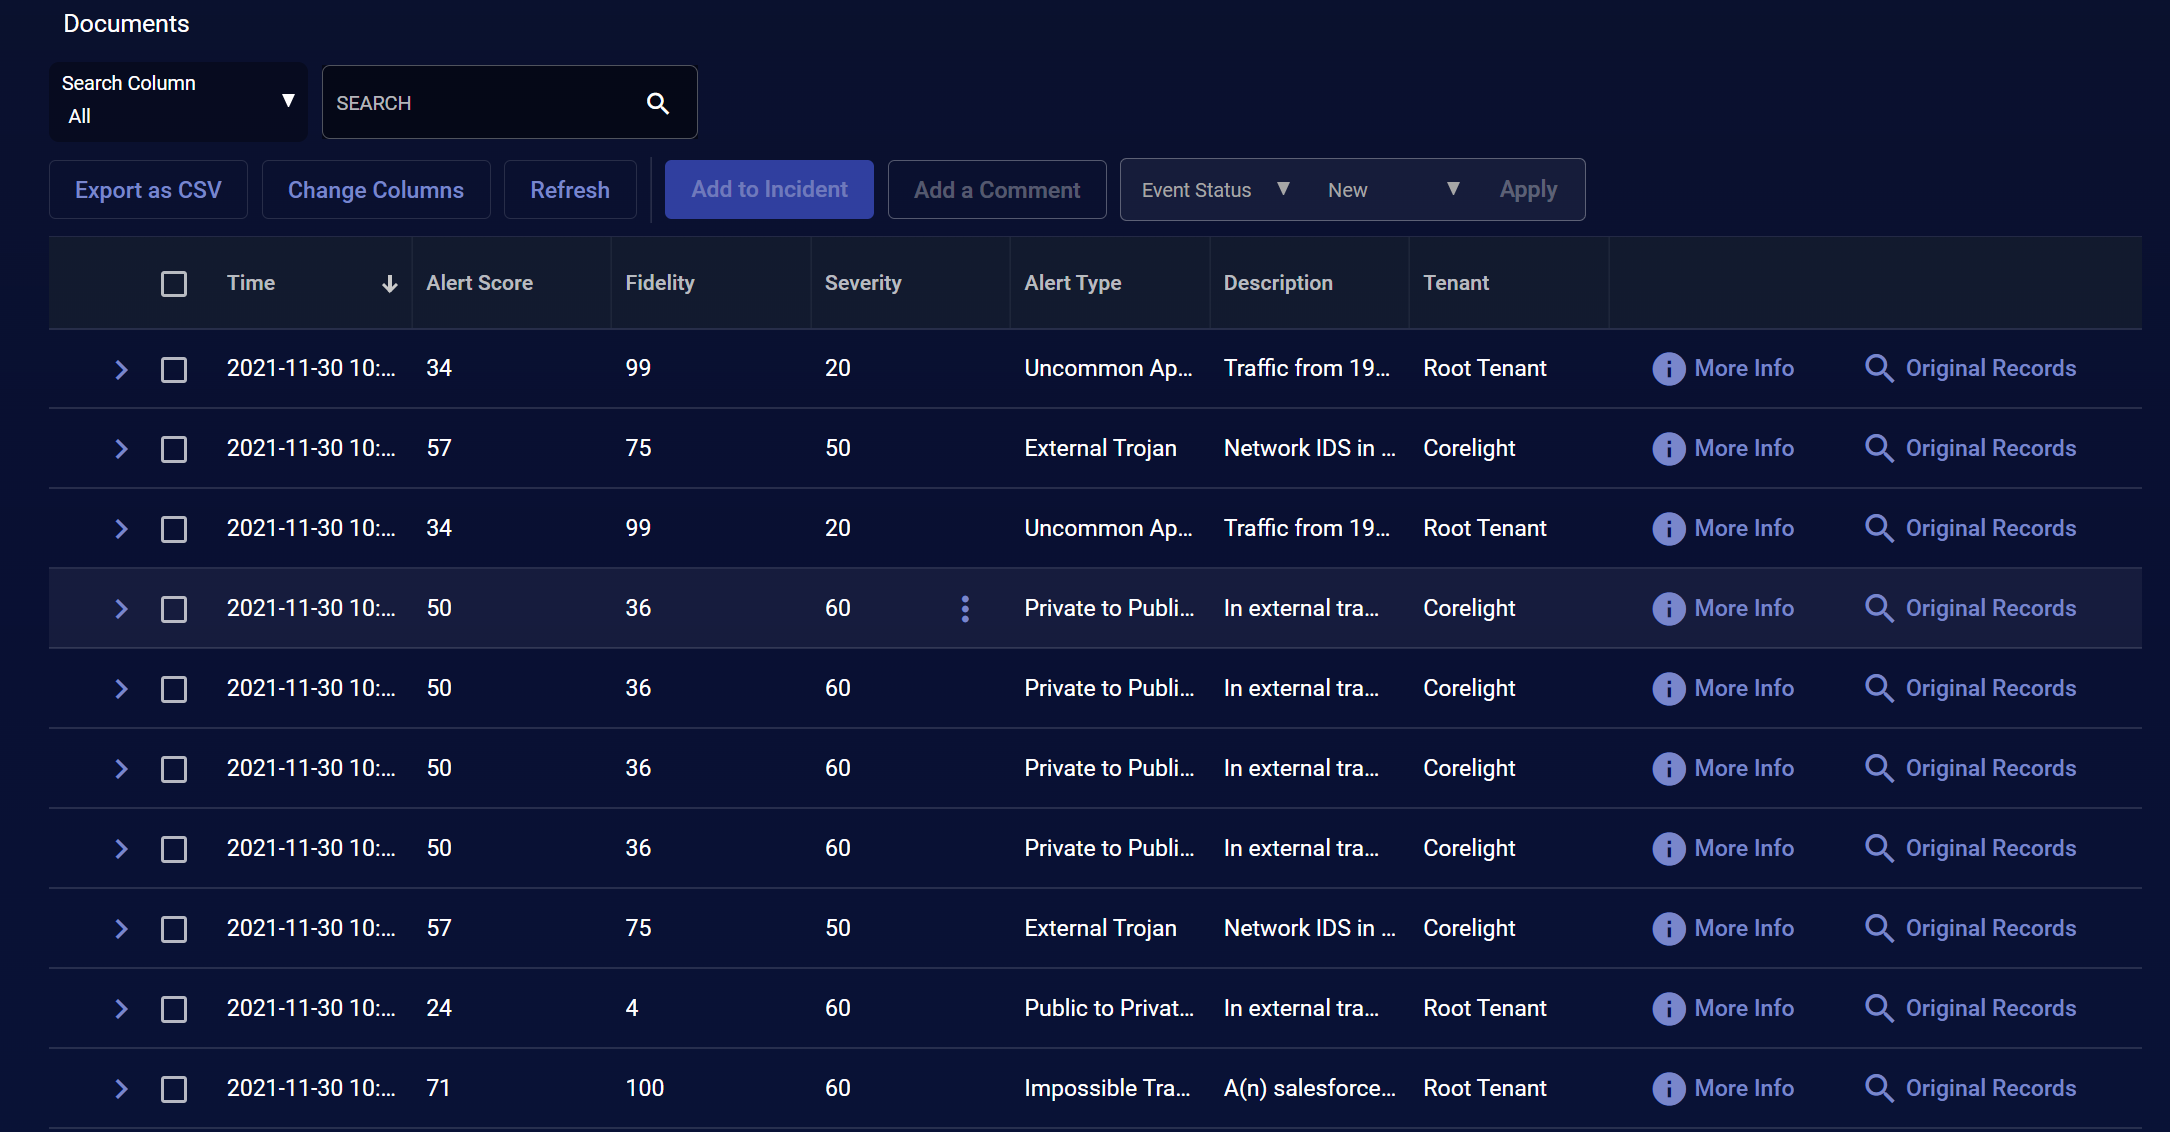
The Interflow records table is a very powerful threat hunting tool. Following are the things you can do to help you hunt down threats:
-
Hover over a field and click the
 icon that appears. The and buttons appear. Click to filter the results to include only that value. Click to filter the results to exclude that value.
 -
Click More Info to see the event details.
-
When searching the Alerts index, you can also use the Original Records button to view the records that were used to generate the corresponding alert.
-
Click
 to cascade an entry in the Interflow table open and see the Interflow table for that event.
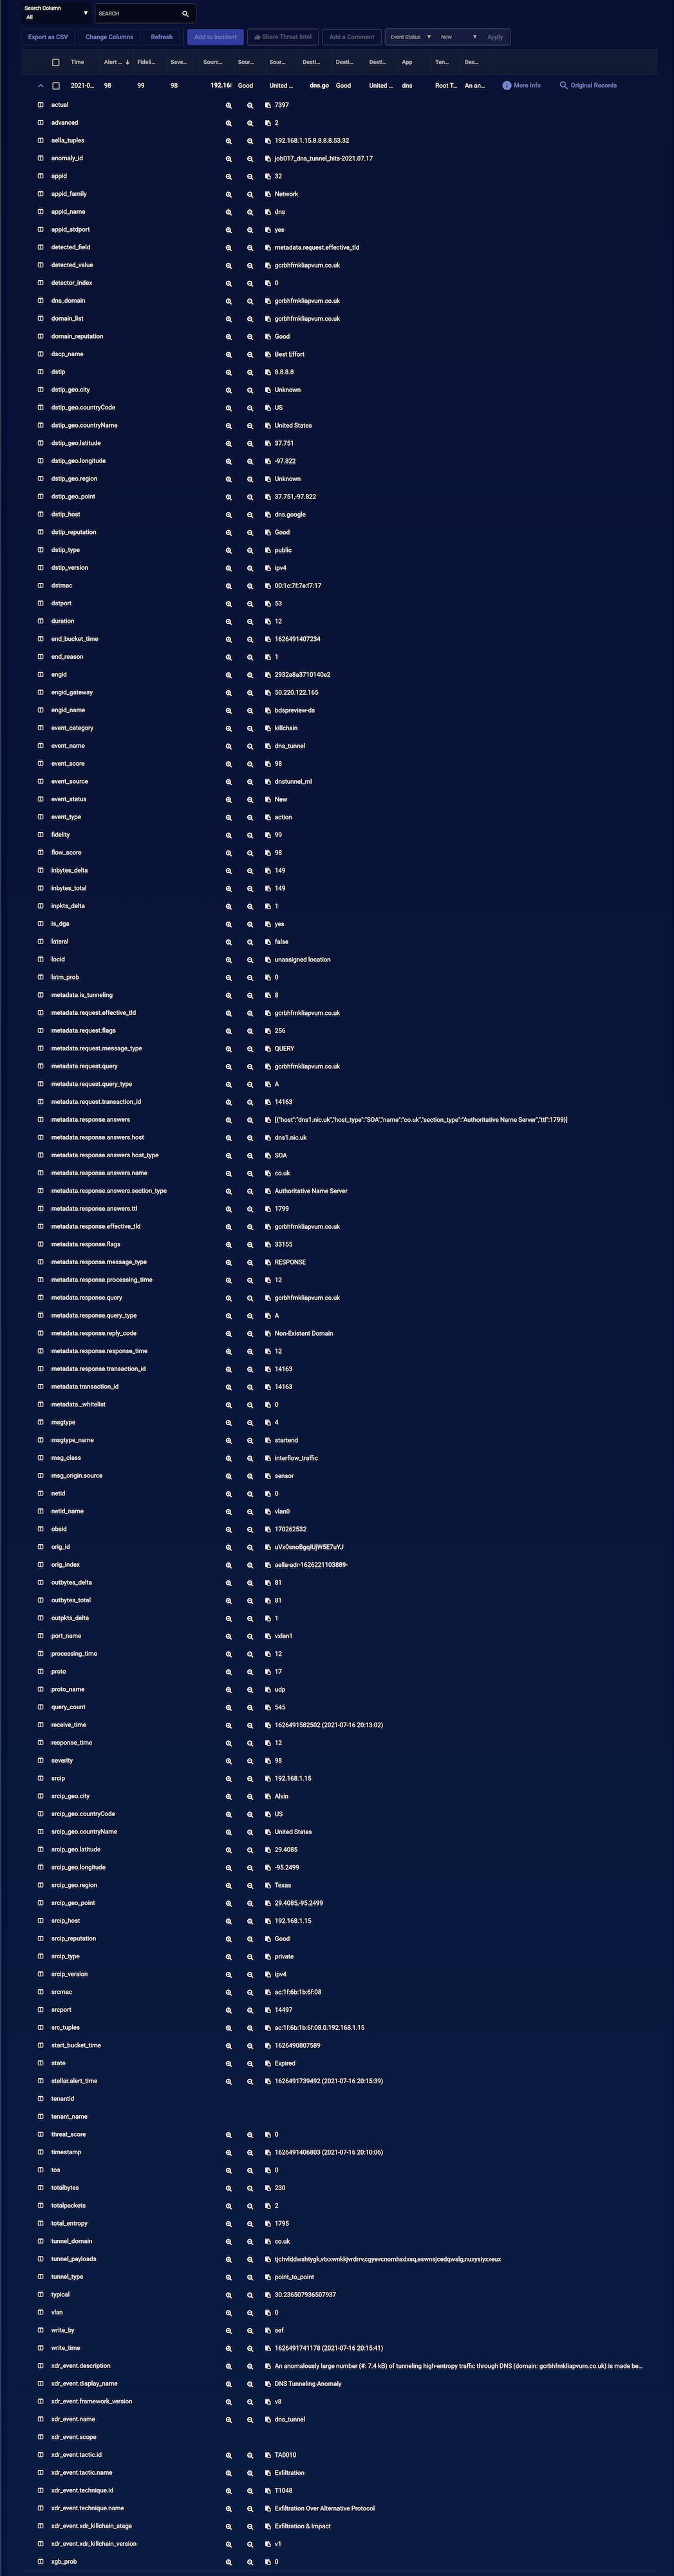
- Click Change Columns to display a drop-down menu that lets you change the fields displayed in the table. Keep in mind that the default columns in the Interflow table change depending on the selected Indices at the top of the page.
- Click Add to Case to add an alert to an existing Case or create a new Case based on the alert.
- Click the icon to display a context menu that lets you:
- Click to filter the results to include only that value.
- Click to filter the results to exclude that value.
- Click to copy the field's value to your clipboard.
When you leave this page, any filters remain selected. So you can continue your threat hunting on other parts of Stellar Cyber.
Correlation Search
You can use the Correlation Search page to hunt for correlations between events.
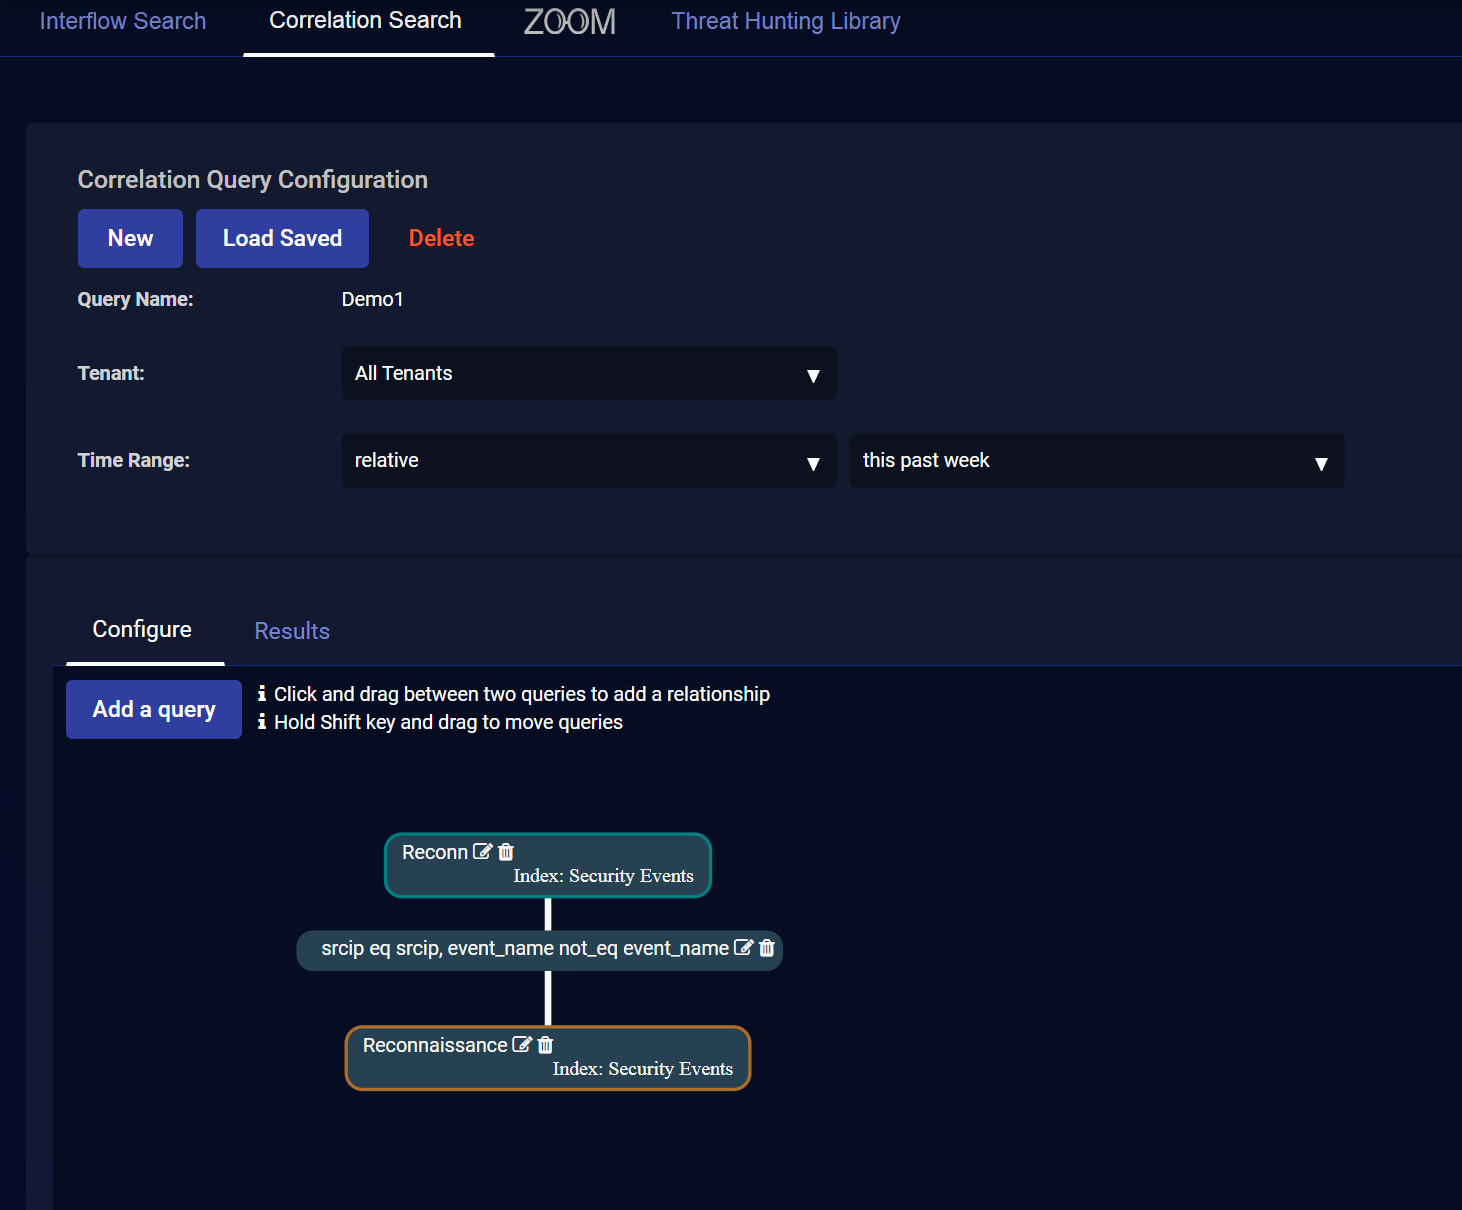
To visualize alert correlations:
-
Select your tenants.
-
Select your time range.
Note that you must supply a FROM and TO to save a correlation query with an absolute time range.
-
Define a query or choose a saved query. For this example we chose Reconn, which finds reconnaissance events.
-
Define a second query or choose another saved query. For this example we chose Reconnaissance, which finds any security event.
-
Drag a line between the queries to define a relationship. In this example we selected both Same Source IP and Query 2 happened after query 1.
-
Continue adding queries by clicking the Add a query button until your correlation is complete.
-
Click Run.
A screen similar to the following visualizes the correlation between the alerts from each query.
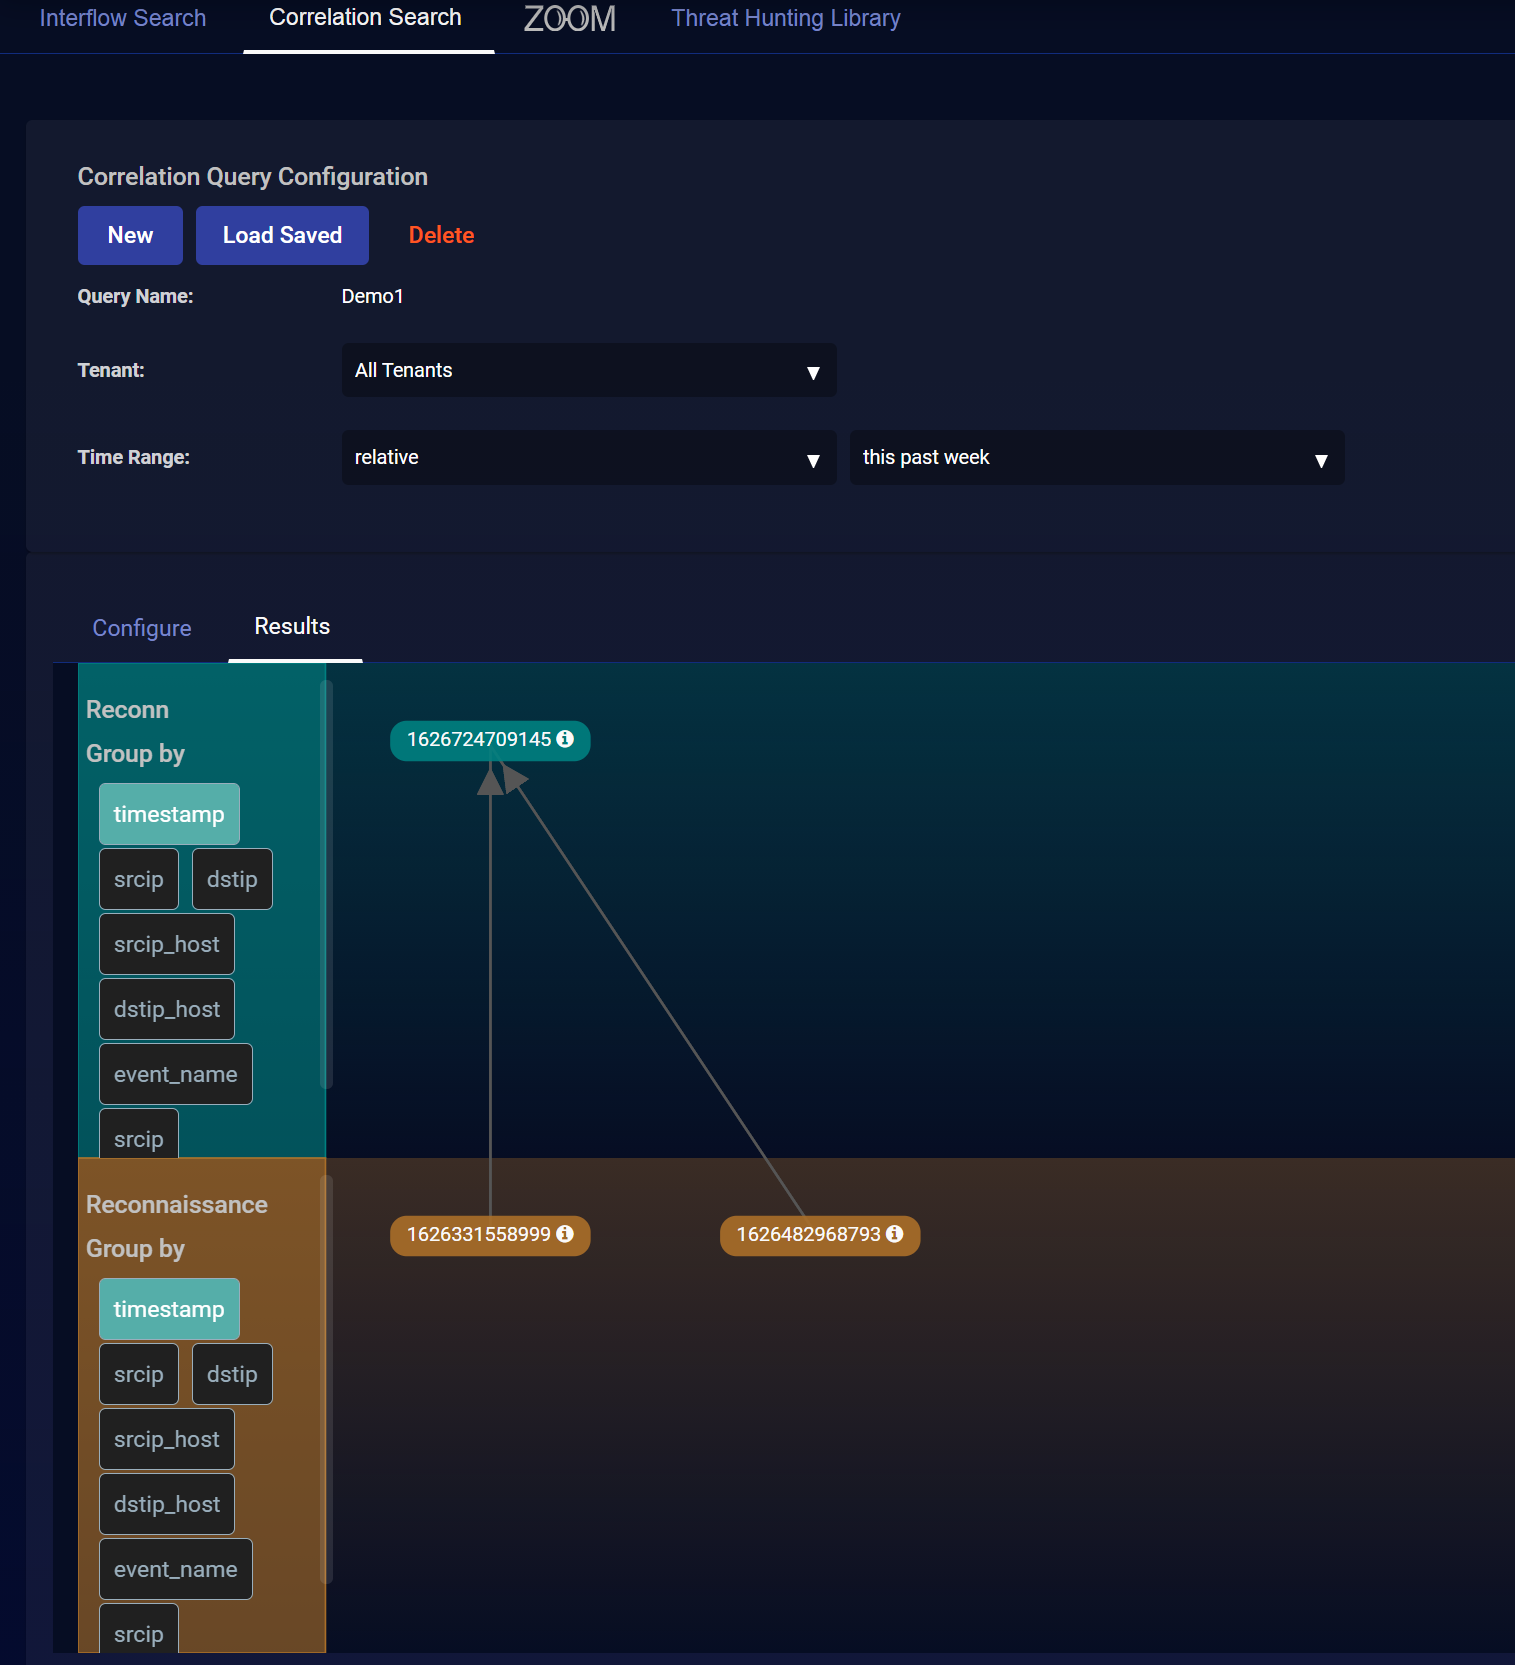
If your correlation times out, you might be trying to retrieve too many records. Edit your queries and reduce the number in the Get xx records field.
You can save your visualization at any time.
Loading Saved Correlations with Absolute Time Ranges
When loading a saved correlation with a Time Range set to absolute, Stellar Cyber automatically changes the time setting to a relative time of the last five hours. This prevents you from accidentally using a correlation with a time range set far in the past.
Using Correlation Queries to Detect Short-term User Accounts
Stellar Cyber can detect user accounts that are spun up for short periods of time and then deleted. Attackers often use these "short-term accounts" to gain access to sensitive systems and data and carry out malicious activity on the network. They then quickly delete the accounts. Using short-term accounts minimizes chances of being identified, makes it harder for forensic analysis to locate the origin of their activity, and reduces the risk that user behavior analytics can establish a baseline and detect anomalous activity patterns. To detect the creation and deletion of these short-term accounts, you must first define a query that correlates these two events—the creation of a user account and its deletion—within specific time periods. After that, you can manually run the correlation query whenever you want to check if short-term user accounts were created.
-
Select Investigate | Threat Hunting | Correlation Search.

-
To begin creating a new correlation query configuration, enter a Query Name such as Short-term Account Detection.
-
Choose a specific tenant or All Tenants.
You can ignore Time Range. Prior time range, which you’ll set in the individual queries, takes precedence over this setting.
-
In the Configure section, select the Edit icon on the upper New query to edit it.
-
Choose the index for which you want to create the correlation query configuration; for example, Windows Events.
-
Choose an existing query or select New Query to define one.
If you select New Query, enter a Query Name such as AccountDeletion.
Select Add Condition, enter settings for Field, Operator, and Value, and then Save. For example: Field = event_id, Operator = is, and Value = 4726. (4726 is the event ID in Windows events logs for account deletion.)
The Field and Value settings do not have to already be in the lists of choices that Stellar Cyber displays. You can type in new settings.
In this case, Query content (read-only) looks like this:
{"must":[{"match":{"event_id":{"query":4726,"operator":"AND"}}}]} -
Set Get records as 100 and the Prior time range as Check the last 5 minutes, leave the rest at their default settings, and then Submit.
The query checks records in the Windows Events index for account deletions within the past five minutes and gets up to 100 account deletions detected during this time. If you notice that the query often returns 100 records, consider increasing the maximum so that you don’t miss any.
The Extract fields at the bottom of the correlation query configuration panel control which fields Stellar Cyber displays on the Results tab after running the queries.

-
Select the Edit icon on the lower New query to edit it.
-
Choose the same index you used for the upper query.
In the example here, it’s Windows Events.
-
Choose an existing query or select New Query to define one.
If you select New Query, enter a Query Name such as AccountCreation.
Select Add Condition, enter settings for Field, Operator, and Value, and then Save. For example: Field = event_id, Operator = is, and Value = 4720. (4720 is the event ID in Windows events logs for account creation.)
In this case, Query content (read-only) looks like this:
{"must":[{"match":{"event_id":{"query":4720,"operator":"AND"}}}]} -
Set Get records as 1 and the Prior time range as Check the last 2 days, leave the rest at their default settings, and then Submit.
The query checks records in the Windows Events index for account creations within the past two days. For each user account created during the last two days that correlates to an account deleted in the past five minutes, Stellar Cyber generates one record.

-
Click-drag from the upper query (AccountDeletion) to the lower query (AccountCreation) to draw a line between them. Define two relationships between the queries and then select Submit:
-
On the Commonly Used tab, select Query 1 happened after Query 2.
-
On the Advanced tab, enter username (AccountDeletion) equals (Operator) username (AccountCreation).
Instead of
username, enter userid or whatever other field you use to identify user accounts.
-
-
Preserve your configuration by selecting Save.
-
Begin checking for short-term user accounts by selecting Run.
-
To run the correlation query configuration that you made at a later time, select Investigate | Correlation Search | Load Saved, choose it in the Select Pre-Defined Template list, and select Submit and then Run.
-
To see the results of the correlation query, select the Results tab.
By clicking the extract fields in the left column, you can change the data displayed in the Results tab.
Threat Hunting Library
When you click on the Threat Hunting Library tab, an overview page appears showing the different alert types in individual tiles. Each tile represents one alert type, with the number in the box showing the total count of alerts of the corresponding type that were detected. Clicking on tile box selects that alert type and displays the data.
By default, the Threat Hunting Library only displays tiles for alert types that are populated with alerts. As illustrated below, you can use the Show all views option to toggle the display between showing all alert types and only those populated with alerts. ![]()
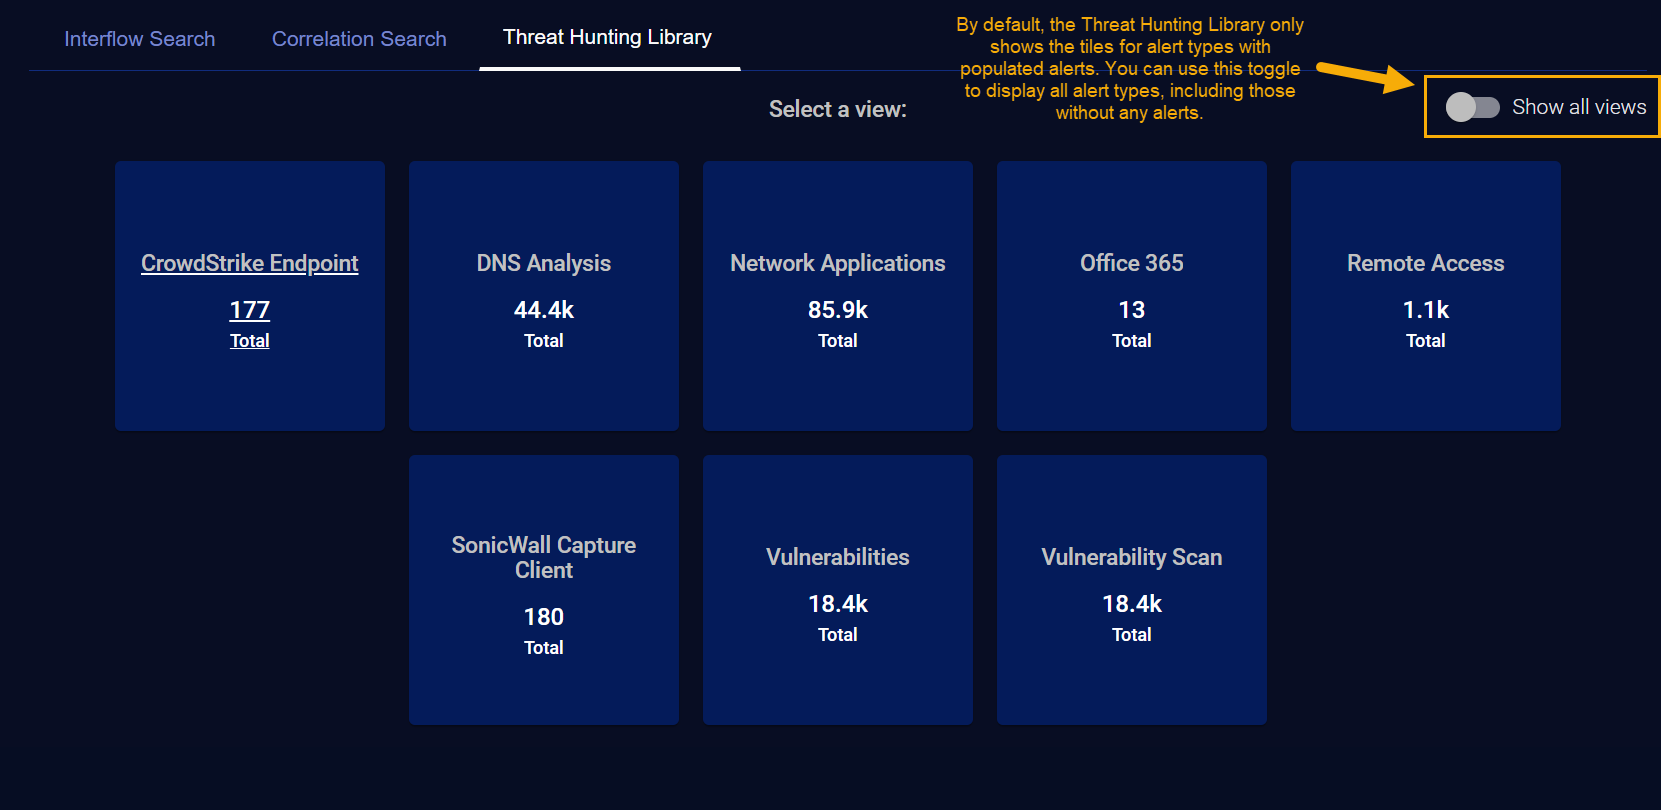
To choose a different alert type, click the Threat Hunting Library tab again.
The top half of the Threat Hunting Library page starts with a description of the alert type selected and several actions you can perform on this dashboard:
-
Edit
-
Clone
-
Export
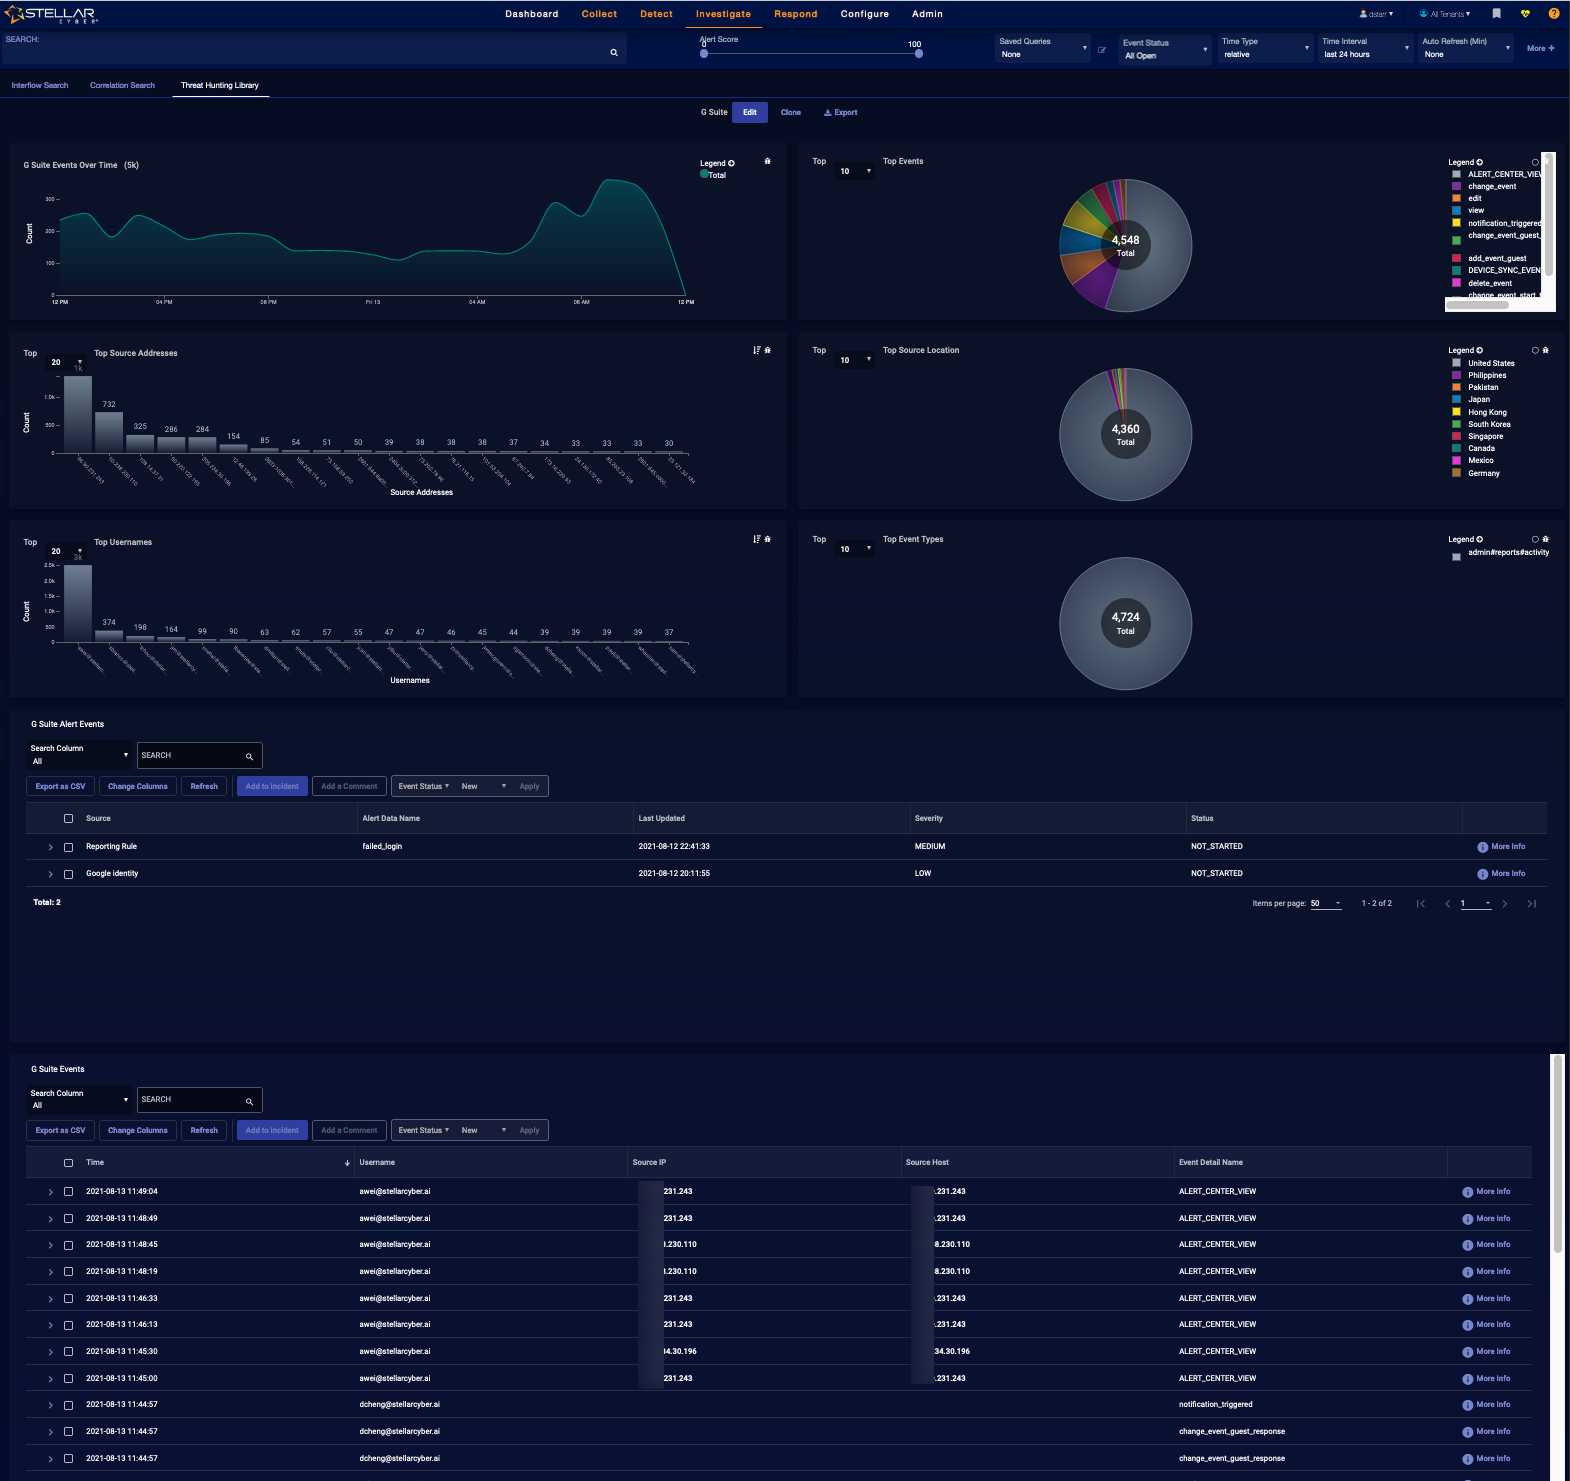
See the Dashboard Actions page for details on each action. The number and composition of each graphic and its associated table is dependent on the alert type. The following image has an example.
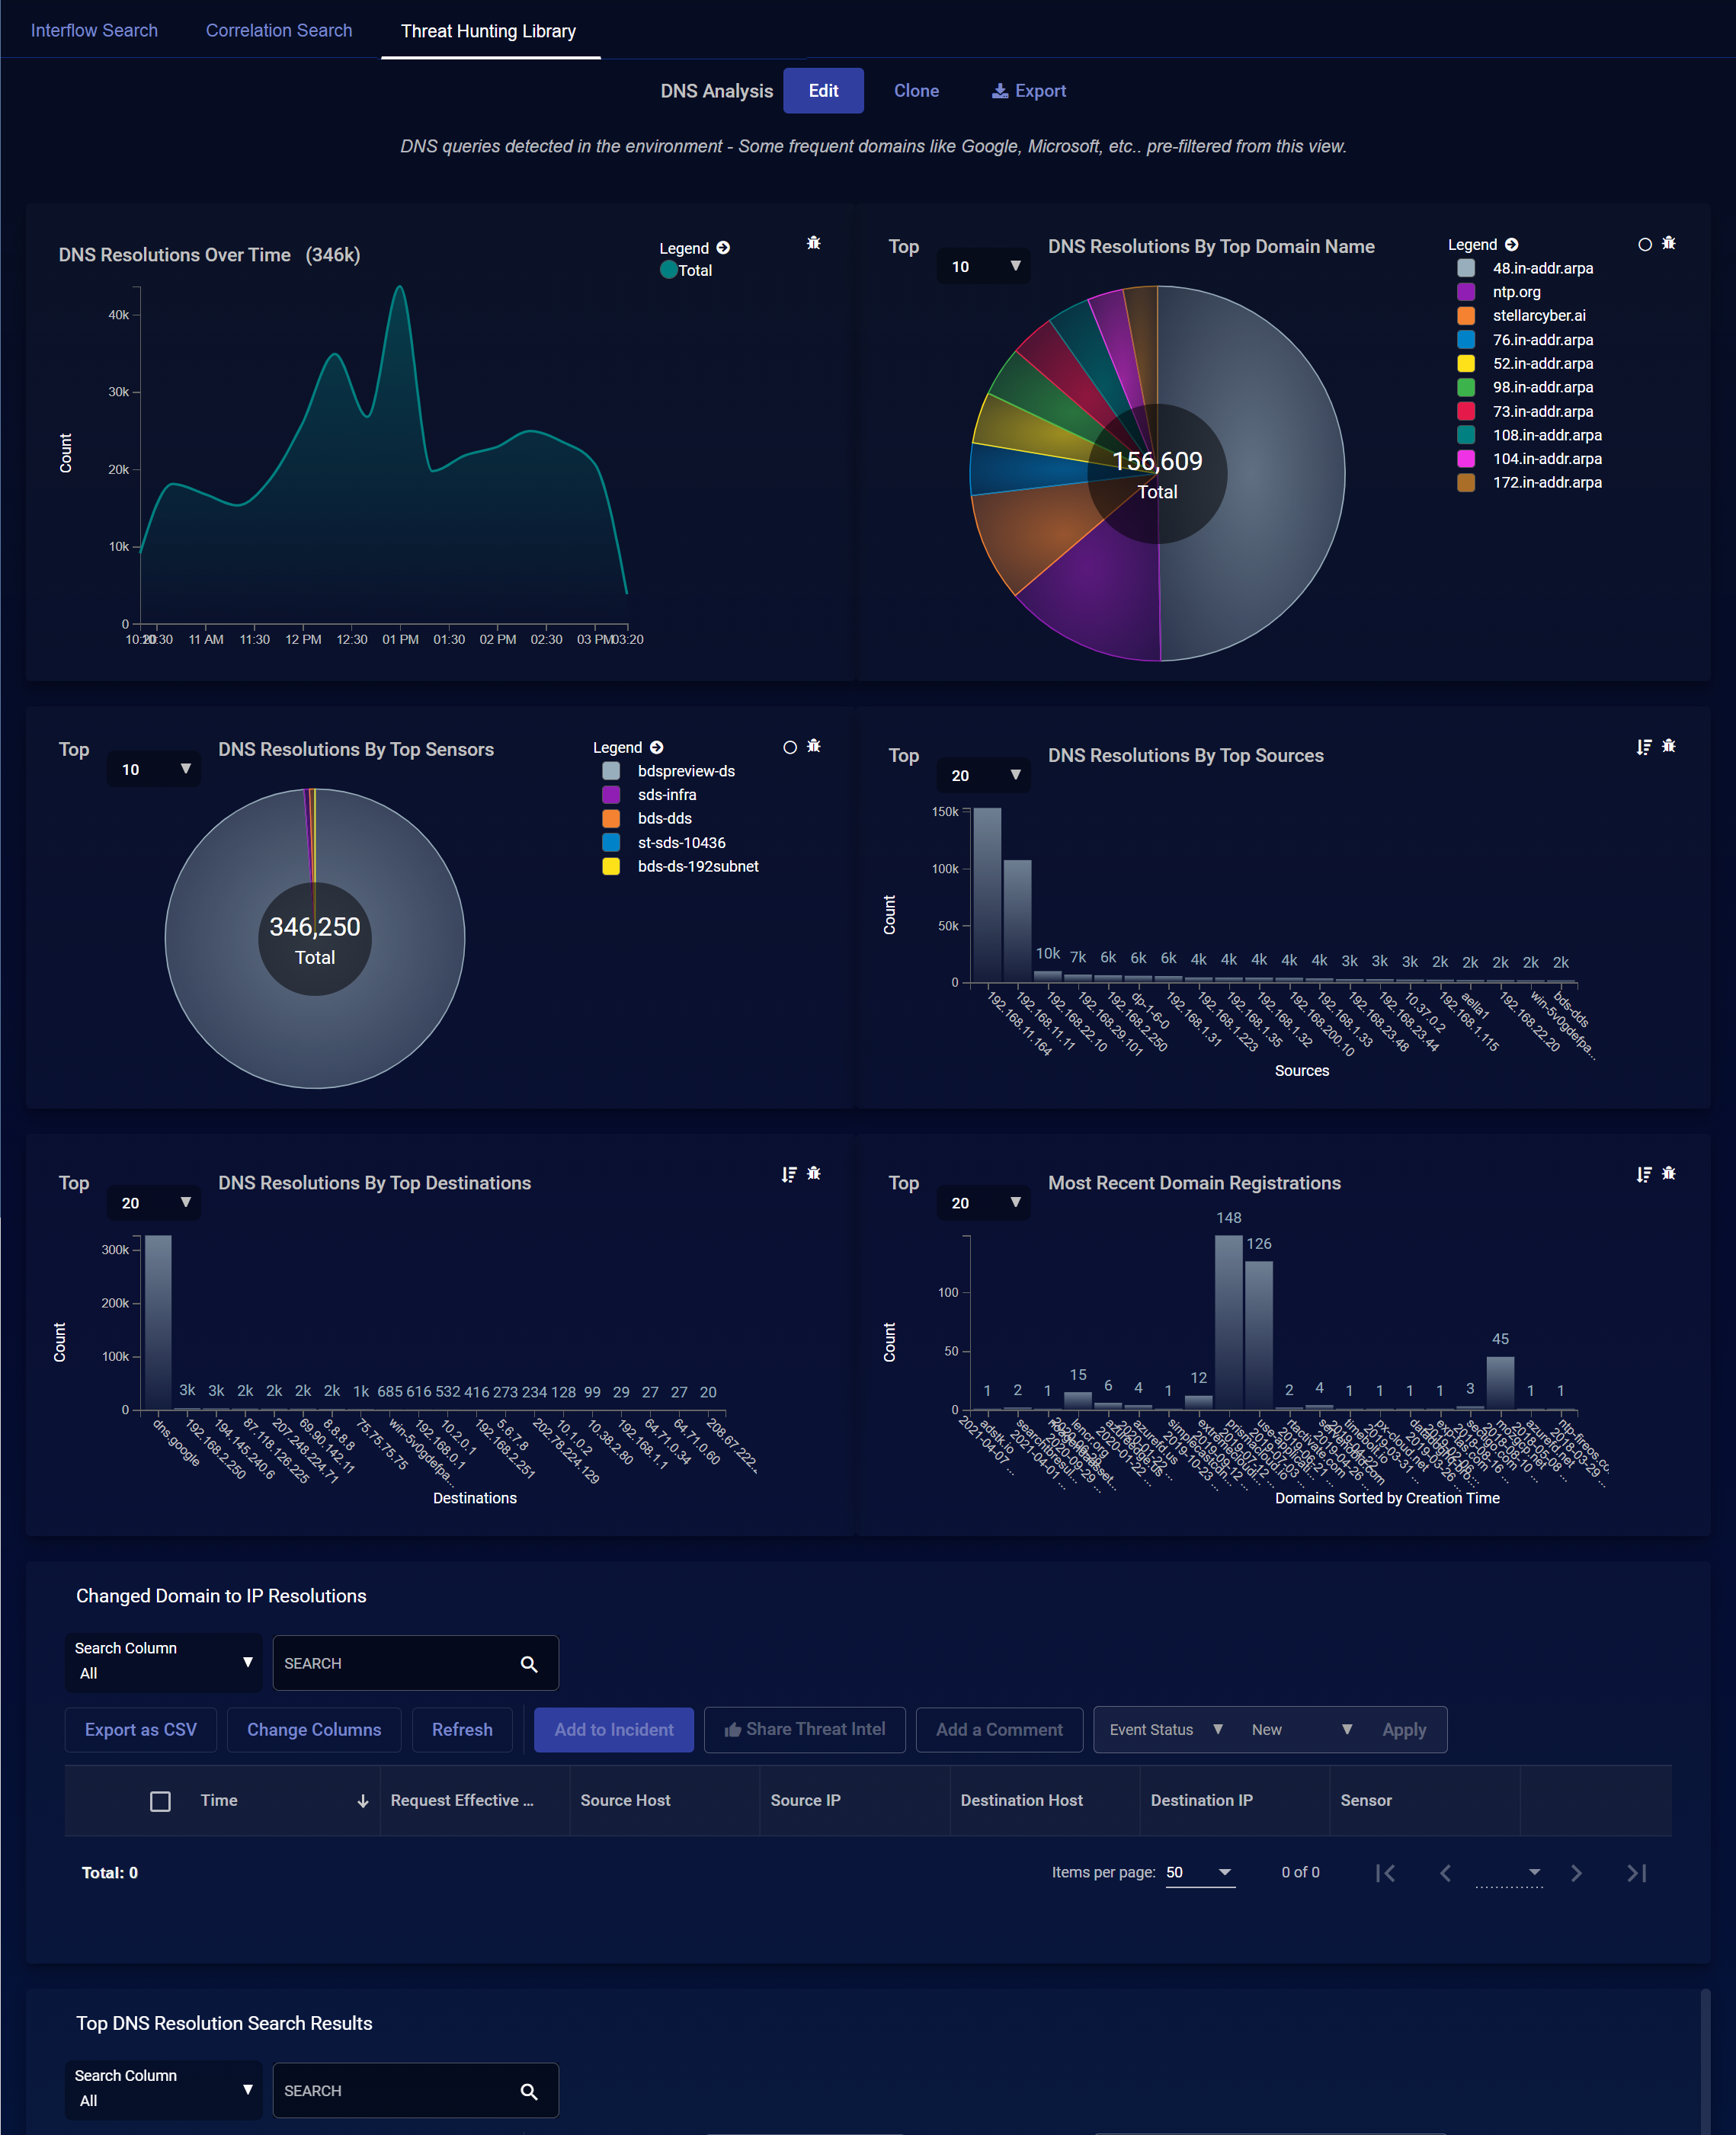
Below the charts, one or more data tables may be displayed. Again, the type of tables and their associated columns change depending on what is relevant to the event type. Example:
-
For DNS Analysis, the tables are Changed Domain to IP Resolutions, and Top DNS Resolution Search Results.
-
For Google Workspace (G Suite), the tables are G Suite Alert Events and G Suite Events.
Be sure to scroll the entire Threat Hunting page, to ensure you are seeing all offered information.
Each row provides an overview of each event. Click the checkboxes to the left of each row to select records. You can also assign security-related events to Cases or create a new Case based on one or more alerts.
Only security-related events can be added to Cases. The Add to Case button is not available when a non-security event is selected.
To see details about an alert, click More Info at the far right of the record. The Details panel appears with multiple sections: Key Fields, Cases, Details, JSON, and Actions. The Key Fields section presents a selection of the more commonly referenced key-value pairs that constitute the Interflow record. The Cases section displays a table of cases with which the alert is associated. The Details panel displays all the key-value pairs in the Interflow record and provides quick filters and search fields to help you quickly find the information you're looking for. The JSON section presents the same information as in the Details section but in JSON format. In the Actions section, you can tag or comment on the event, trigger an email, or take firewall action.
-
See Using Event Details for more information on working with events.
-
See Using Tables for more information on working with tables.
