Using the Alert Details
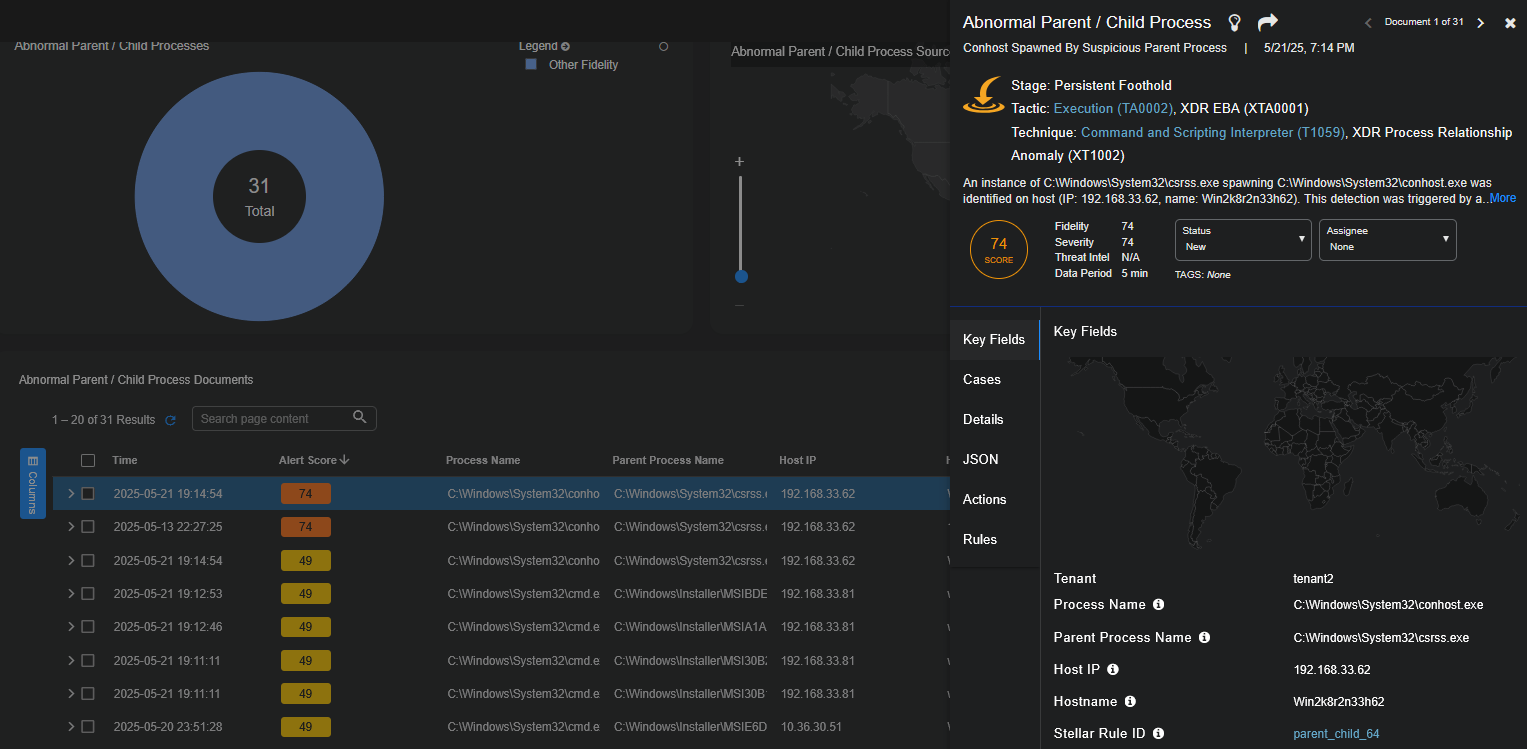
Each alert has its own detail page. The exact information in the detail page varies depending on the alert type and the available data. However, as shown in the figure below, the following elements are consistent across all alert types:

-
Alert Name – The name of the alert (for example, External Firewall Policy Anomaly).
-
Edit – Click this button to open a workspace where you can rearrange the components of the Alert Detail page to suit your analysis needs.
-
Clone – Click this button to create a copy of the current workspace that you can then tailor as a new dashboard.
-
Export – Export the Alert Detail page as a PDF file.
-
Kill Chain Stage, Tactic, and Technique – Identifies the alert according to its XDR Kill Chain stage, tactic, and technique.
-
Summary Description – A one-line summary of the alert type.
-
Data Graphs – Alert Details pages provide a different set of graphs quantifying data for the alert type. The exact types of graphs vary depending on the alert type; refer to Data Graphs for examples.
-
Alert Detail Table – The bottom of each Alert Details page provides a data table listing the different instances of this alert type.
Rule-Based Alert Types
For details on rule-based alert types, see Rule-Based Alert Details.
User Reported Email Phishing Alert Type
For details about alerts for user-reported phishing emails, see User Reported Phishing Email Alerts.
Data Graphs
The Data Graph section varies depending on the selected alert type. This section summarizes some sample data graphs.
The Data Graph section of the display is configurable. You can add, change, and move elements as needed. See the Custom Dashboard Components page for more details.
Raw Count
The Raw Count card provides a count of the total alerts triggered for the alert type. Depending on the alert type and the data available, an Investigate button also appears for further analysis.

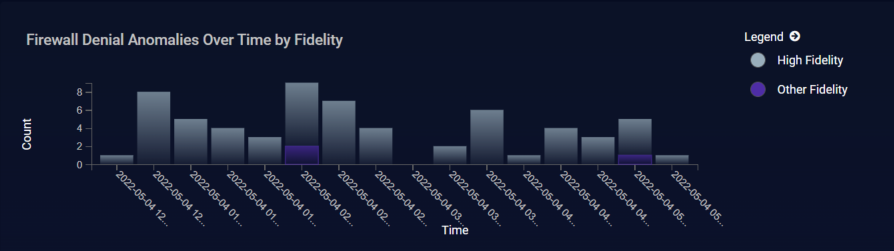
Over Time by Fidelity
The Over Time by Fidelity graph breaks out the number of alerts triggered for the selected type by time according to their fidelity category.
Geolocation Map
This display plots the location information of the events onto a world map. This provides a quick overview of where threats are coming from.

Alerts by Fidelity Graph
The Alerts by Fidelity graph breaks out the number of alerts for the selected alert type according to their fidelity category in a pie chart. Separate slices are provided for High Fidelity alerts (those with a Fidelity Score greater than 75) and all other alerts slice size is adjusted to the proportion of alerts in the corresponding category. The total is shown in the innermost circle.

Correlated Raw Events Map
A specific set of alert types based on correlated events display the correlated relationship instead of using one of the above maps. This allows you to easily evaluate the raw data for each event, and view the data by different relevant data points.

This chart is displayed for the following alert types:
The example above shows a chart for Exploited C&C Connections which is a Security Analytics alert type based on correlation. This example shows different Exploit events correlated to potential C&C Connection events. You can view the raw data for each by clicking on the IP addresses. A pane opens in an overlay to the chart. You can also display the raw data by located the corresponding row in the details table, then clicking the More Info button to display the Event Details pane. For this alert type, the Key Fields section of that pane includes links to the raw data for the corresponding events that triggered the alert. If you click one of these links, it opens a new window with the raw data.
You can also change the perspective of the chart by clicking one of the displayed relevant data points (srcip, dstip, and app_id) in the chart row.
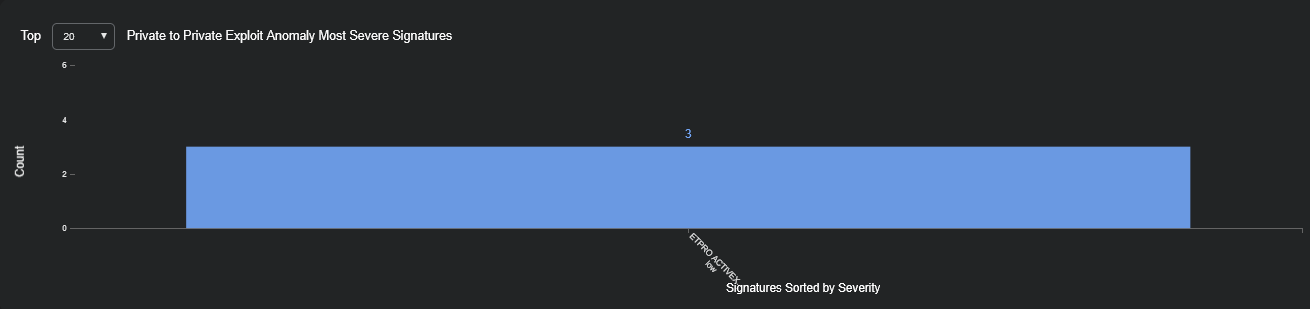
Most Severe Signatures
The Most Severe Signatures graph is displayed for Private to Private Exploit Anomaly and other Exploit Anomaly alert types.
Alert Detail Table
This is a table of the events seen by Stellar Cyber that match the selected alert type. The columns change depending on the alert type, for example:
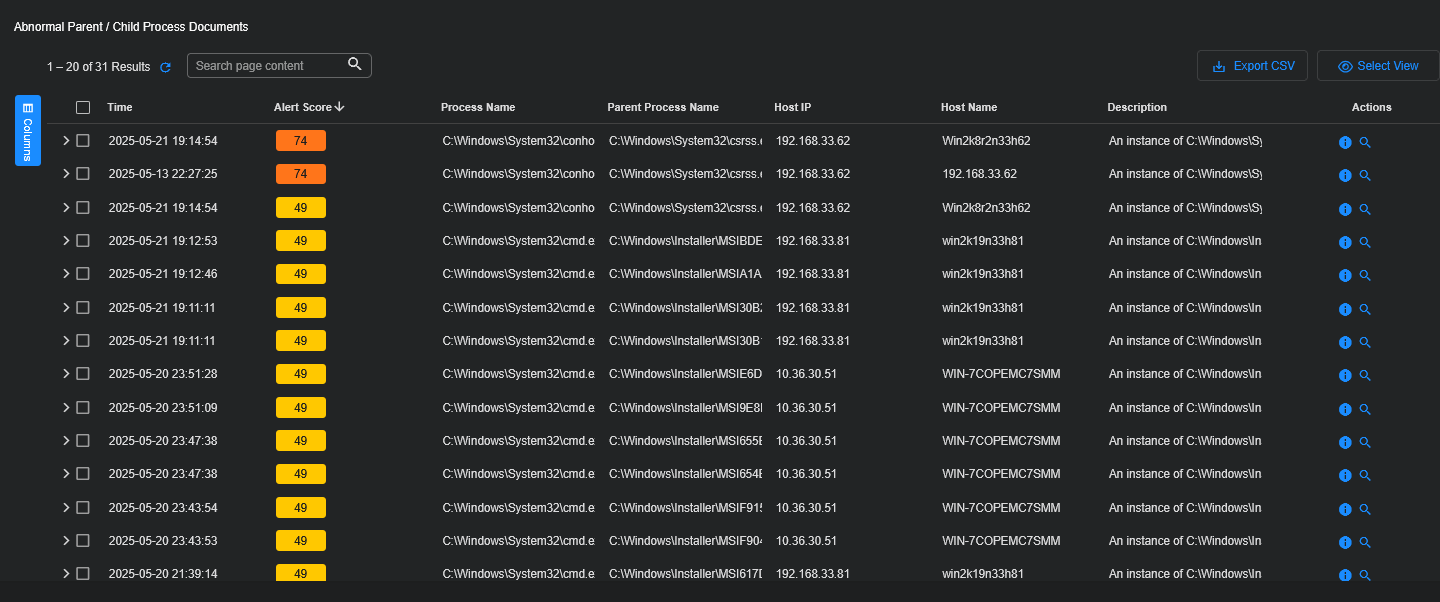
Each row provides a summary of the security events associated with the selected alert type. You can perform the following tasks in the Alert Detail table:
-
Standard search, export, column editing, and refresh functions are all available at the top of the display.
-
Click the check boxes to the left of each row to select records.
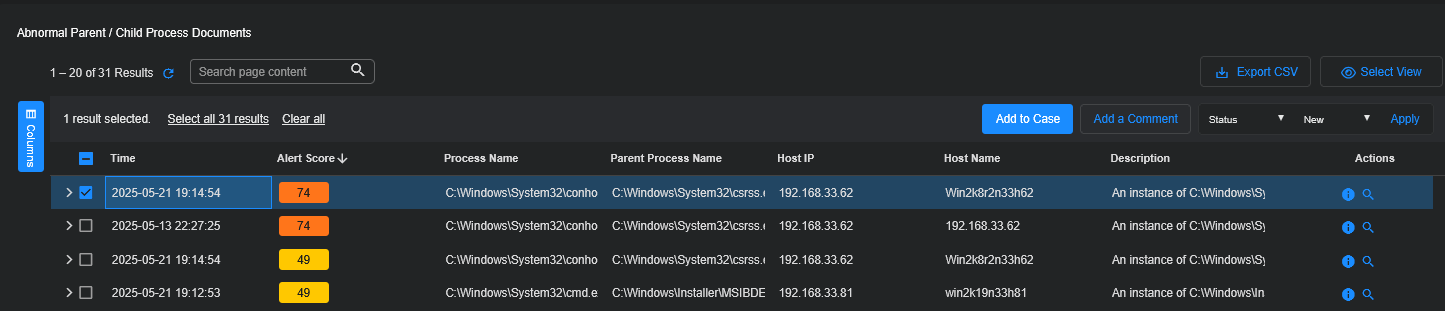
Once you have selected records, the following additional tools become available:
-
Add to Case – Click this button to add the event to an existing Case or create a new Case based on the event. Refer to Working with Cases for more information on working with Cases.
There are a maximum of 5,000 associated alerts per Case.
-
Add a Comment – Leave an explanatory comment to assist with further analysis.
-
Bulk actions let you change an event's status, associated tags, or assignee.
-
-
To see the Property Metadata, click the arrow icon to the left of the check box.
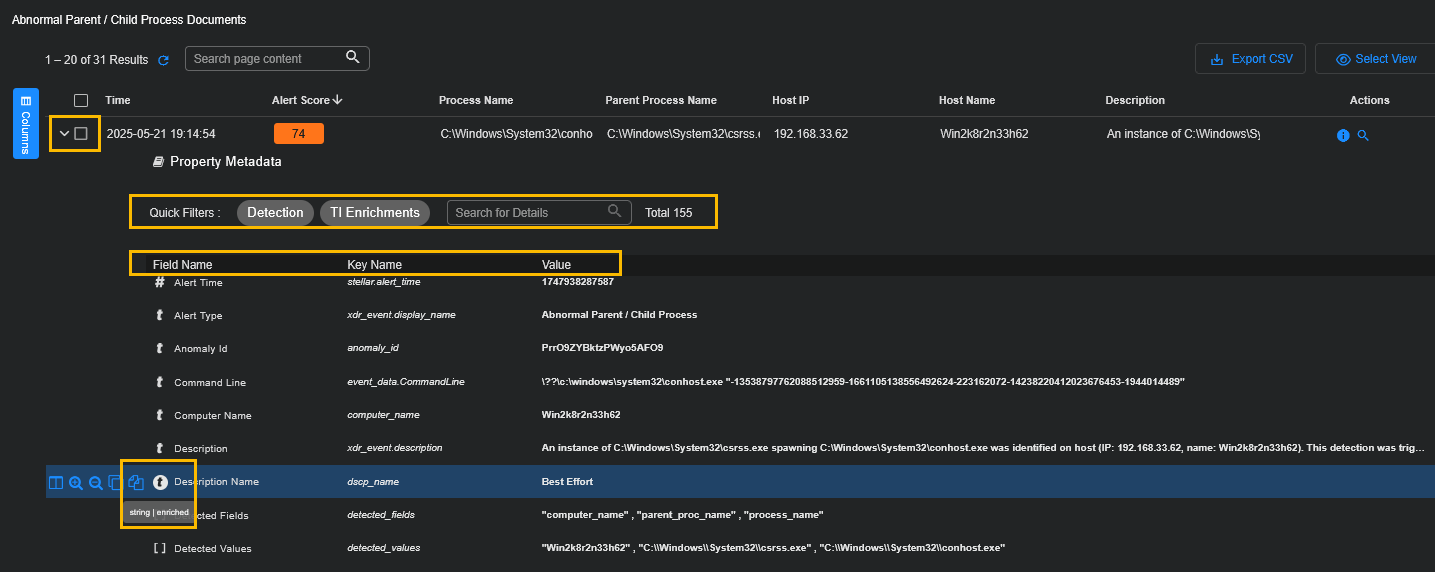
Once you click the arrow icon, the following become available:
-
Quick Filters for Detection and TI Enrichments, described in Using the Alerts Page.
-
Columns for Field Name, Key Name, and Value.
-
Tooltips on the icons when you hover over them showing their type, that is, if they are a number (
 ), array (
 ), or string (
 ), as well as highlighting on the icons showing the fields that are enriched, which are also in the tooltip, for example,
  string | enriched or
  number | enriched. For details, see Enrichment Details.
 -
When you expand an alert, Stellar Cyber assigns it an alert score (indicating its criticality), severity level, and fidelity level (indicating confidence in accurately identifying the alert). These are color coded, making it easier to spot their criticality, severity, and fidelity levels at a glance. The following are the relationships of color to score and severity:
Red 75.01-100, Critical
Orange 50.01-75, High
Yellow 25.01-50, Medium
Light yellow 0-25, Low
-
-
To see more granular details about an event, click the More Info button on the far right of the record. The Event Info display appears. In addition, the row you selected remains highlighted in the background so you can keep track of the alert in the list when it is under review in the Alert Details panel.
-
Click the Original Records link at the far right of the table to drill to the Interflow for the corresponding event in the Threat Hunting interface. You can also cascade an entry open to see the Interflow fields directly in the Alert Detail table.
-
See Reputation Definitions for definitions of the values in the Source Reputation and Dest Reputation columns.
InSyncs in Alert Details Table
If there are any integration syncs, the table has an InSyncs column showing the alerts that have been synced. When you hover over a ServiceNow icon in the InSyncs column, the status, Ticket ID, and Last Synced date and time are displayed for each alert.
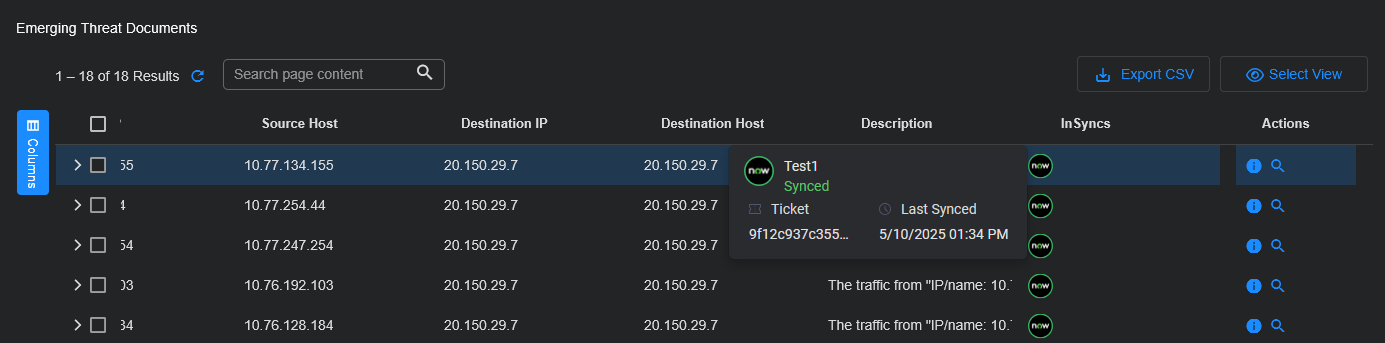
For details, see Using InSyncs.
