Using the Data Sinks Page
You must have Root scope to use this feature.
You use the System | Data Processor | Data Sinks page to create, edit, and manage data sinks. Data sinks are external destinations for different types of Stellar Cyber data, including raw data, alerts, assets, and users.
Data sinks can be used for the following tasks:
-
Fine-grained import of data for short-term analysis needs.
-
Data restoration in disaster recovery situations
-
External storage of data for use with third-party solutions.
-
Long-term storage of data for compliance and forensics.
About the Data Sink Framework
Stellar Cyber restructure the Stellar Cyber data sink framework starting with the 4.3.0 release, simplifying and streamlining the way in which data is written to external storage.
In addition to new data sink types, Stellar Cyber also changed the mechanisms by which data is written to external sinks. You can now perform fine-grained imports of specific data from a sink as an alternative to the snapshot approach provided by the previous data backup and cold storage solutions; refer to Working with Data Management for a discussion of the pros and cons of the two approaches.
From a user's perspective, the new data framework offers the following improvements:
-
Data sink storage processes are separate from those responsible for processing incoming data, preventing any performance issues with one from affecting the other.
-
If you have multiple DA workers, sink storage responsibilities are shared equally across the different DA nodes, scaling performance. The Data Lake is still responsible for sending security event data (SER index) to data sinks.
Adding a data sink can still reduce DA performance by 30-40%. Data sink performance depends heavily on I/O bandwidth between DA nodes and the data sink itself. Because of this, you should anticipate loading your DA nodes with a maximum of 300GB of daily ingestion when a data sink is enabled. If your current configuration exceeds this per-DA load, add additional DA nodes to your cluster.
-
Data granularity is improved, allowing you to use filters to import just the data you want rather than days worth of data round it.
-
New batching options let you decrease the frequency of writes to external storage, in turn decreasing the per-API call costs associated with storage services such as S3 or Azure.
-
Simplified sink configuration options help you specify what data is written to data sinks more clearly.
These changes help simplify all procedures associated with backups, sinks, cold storage, and external storage.
These changes do not affect the structure of the data written to external sinks. If you have existing tools you've developed to work with data stored in external sinks, they will all still work with the new framework. The refactoring affects only how data is written to sinks, not the data itself.
Types of Data Sinks
You can use the System | Data Processor | Data Sinks page to add any of the following different types of data sinks:
Regardless of the type of data sink you are adding, you must make sure to whitelist all DA nodes and the DL-master on any firewalls between the DP and the data sink itself.
Working with the Data Sink List
The System | Data Processor | Data Sinks page lists each of the data sinks currently configured in the system.
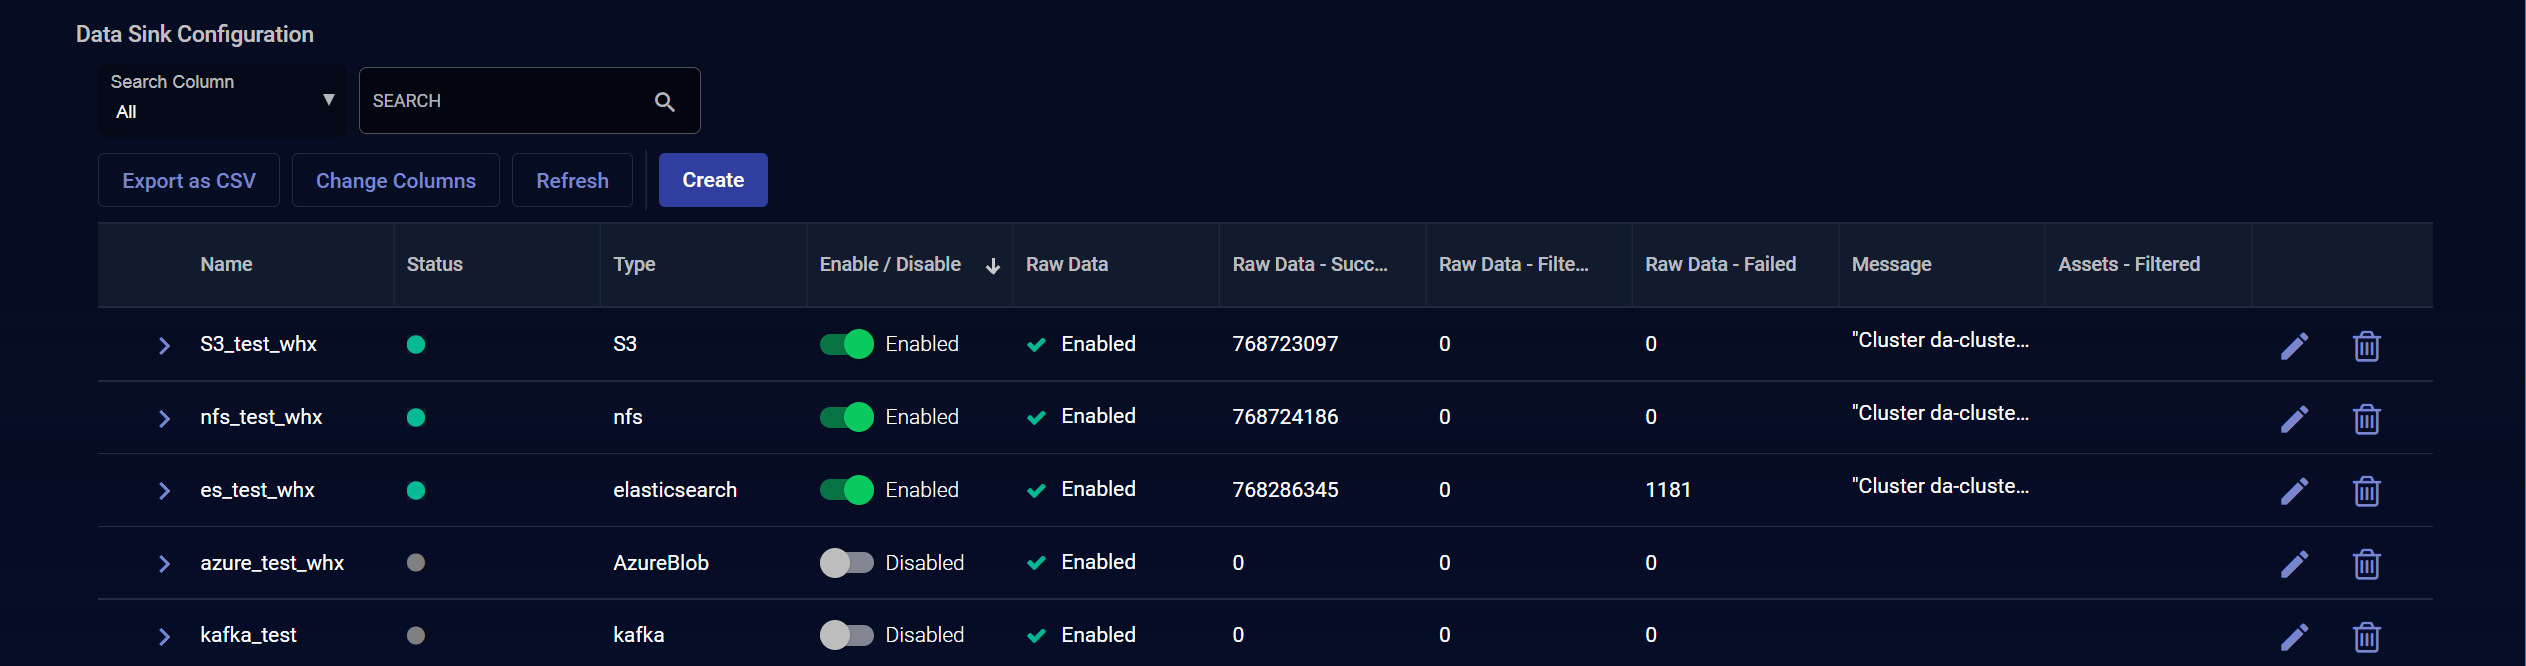
The default columns in the table are as follows:
- Name –The friendly name of the Data Sink, configured when it was added to the list.
-
Status – A visual indicator of the sink's status. Can be green (good), red (problems), or gray, indicating that the sink is disabled. If the Status indicator shows red, refer to the Message column to identify the issue. Refer to Using Data Sink Table Columns for Troubleshooting.
Note that the status indicator does not currently show whether the sink was successfully added – a sink added with an incorrect access or secret key is still shown in green. You can verify data is being written successfully by listing the target directories on the target sink itself.
- Type – The type of Data Sink.
- Message – Shows a summary of any status/error messages for the data sink. Hover your mouse over the entry to see the complete message. Refer to Using Data Sink Table Columns for Troubleshooting for more information.
-
Raw Data – Indicates whether the data sink is configured to have raw data sent to it.
-
Alerts – Indicates whether the data sink is configured to have alerts sent to it.
-
Assets – Indicates whether the data sink is configured to have asset data sent to it.
-
Users – Indicates whether the data sink is configured to have user data sent to it.
-
Enable/Disable– You can use this switch to toggle a sink destination between Enabled and Disabled. In general, once a sink is enabled, you will likely leave it enabled. However, if you do re-enable a sink that was previously enabled, Stellar Cyber attempts to stitch data as follows:
-
Raw Data – Raw data refers to live data ingested by Stellar Cyber from sensors and connectors after normalization and enrichment has occurred and before the data is stored in the Data Lake. Raw data cannot be stitched and is instead written to the sink starting from the time when the destination is re-enabled. Any data captured between the time the sink was disabled and when it was re-enabled is not written to the sink.
-
Alerts, Assets, Users – These data types are also known as derived data and are generated by Stellar Cyber by extrapolating from raw data. Stellar Cyber attempts to stitch all alert, asset, and user data recorded from the time the sink was disabled to the time the sink was re-enabled.
-
Actions include:
-
Click Create to add a new Data Sink to the table.
- Click
 to edit the Data Sink.
 -
Click
 to delete the Data Sink.
You cannot delete a Data Sink that has an active import or restore in the Data Sink Import or Data Sink Restore tabs. Delete any active import/restore tasks for the data sink, wait at least ten minutes, and then delete the data sink.
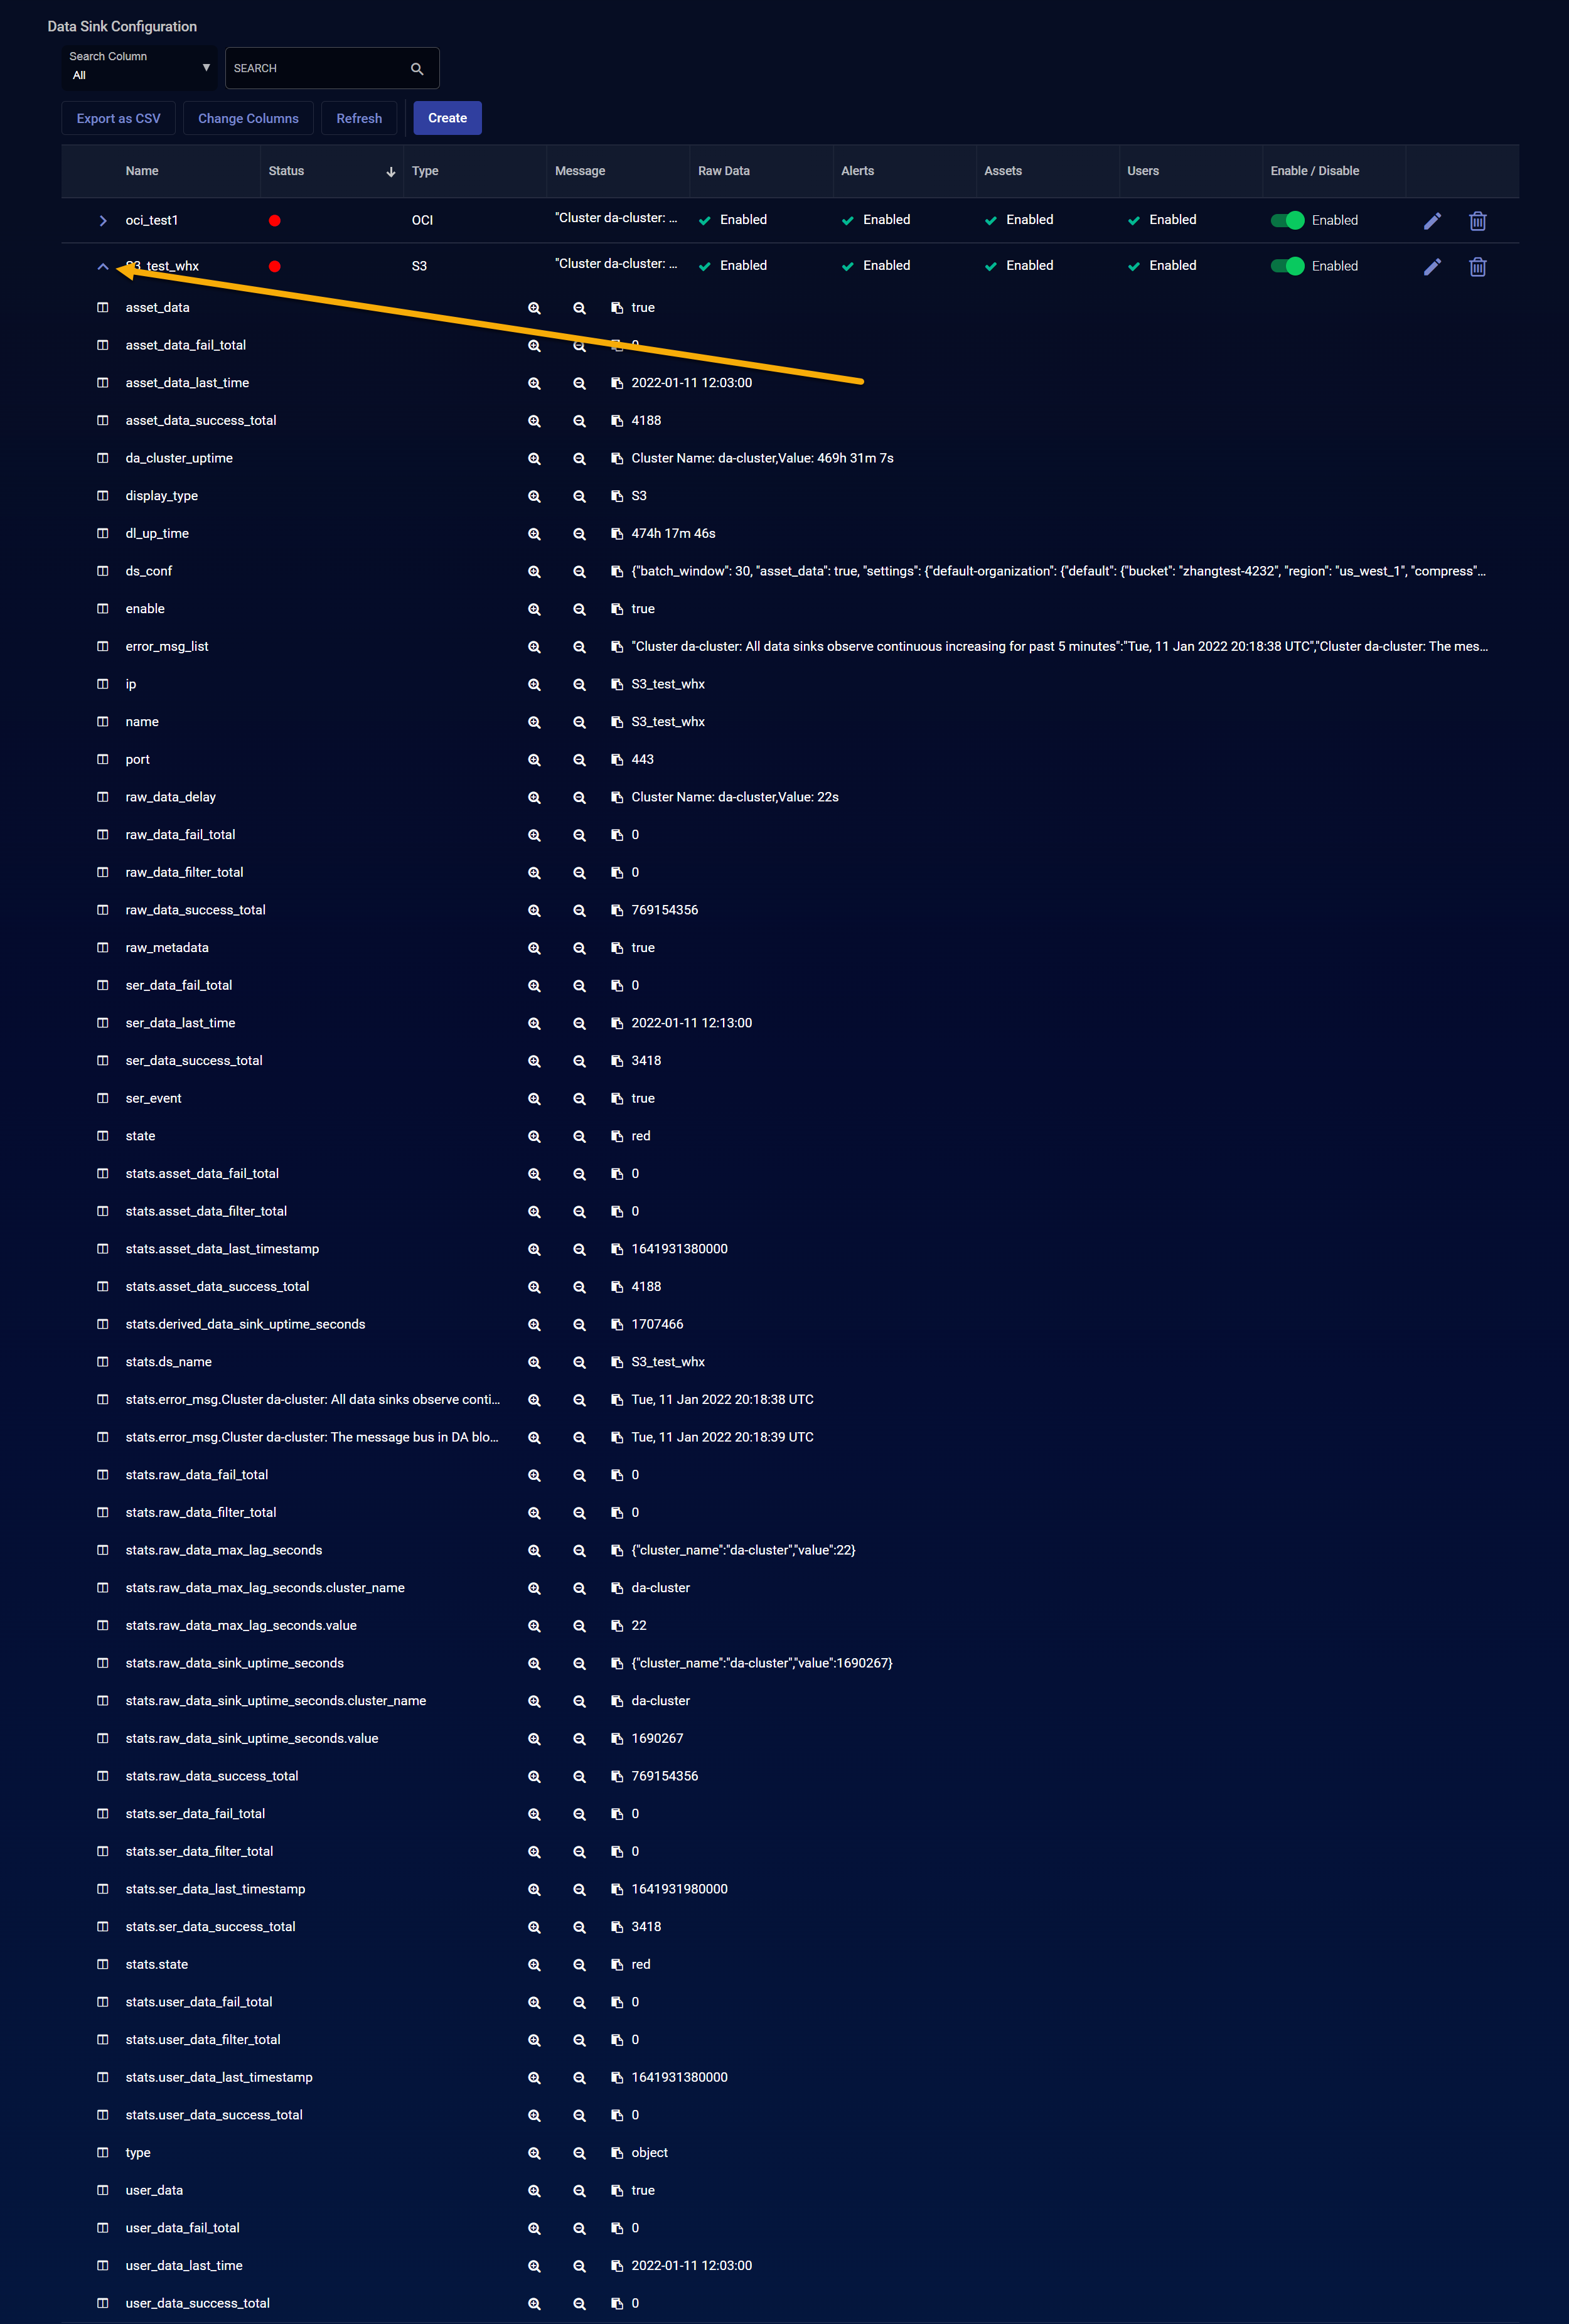
In addition to the table columns, you can also click the > icon adjacent to a sink's entry in the list to cascade it open and see detailed JSON fields for the destination. For example:
Additional Columns for the Data Sink List
In addition to the default columns shows in the Data Sink list, you can also use the Change Columns button to add any of the following additional columns to the display:
|
Column |
Description |
|---|---|
|
Alerts - Failed Alerts - Filtered Alerts - Last Synced Alerts - Successful |
These counters help you keep track of how alert records are being sent to the data sink. The Failed, Filtered, and Successful counts are all cumulative since the last time the Data Lake service started. You can add the Data Lake Uptime column to the display to see the last time the Data Lake service restarted.
|
|
Assets - Failed Assets - Filtered Assets - Last Synced Assets - Successful |
These counters help you keep track of how asset records are being sent to the data sink. The Failed, Filtered, and Successful counts are all cumulative since the last time the Data Lake service started. You can add the Data Lake Uptime column to the display to see the last time the Data Lake service restarted.
|
|
DA Cluster Uptime |
Shows the amount of time since the last time the DA cluster restarted. The Failed, Filtered, and Successful counters for Raw Data are all based on this time interval. |
|
Data Lake Uptime |
Shows the amount of time since the last time the Data Lake restarted. The Failed, Filtered, and Successful counters for alerts, assets, and users are all based on this time interval. |
|
Host |
The IP address or name of the host where the data sink is sending data. |
|
Port |
The TCP/UDP port number on the remote host where the data sink is sending data. |
|
Raw Data - Delay Raw Data - Failed Raw Data - Filtered Raw Data - Successful |
These counters help you keep track of how raw data records are being sent to the data sink. The Failed, Filtered, and Successful counts are all cumulative since the last time the Data Analyzer cluster started. You can add the DA Cluster Uptime column to the display to see the last time the Data Analyzer service restarted.
Note that for OCI and AWS data sinks, these counters show as N/A when Batch Window is set to 60 seconds or less. For Batch Windows greater than 60 seconds, the Uploads counters described in the next row are used to keep tabs on the health of sunk data. |
|
Active Uploads Completed Uploads Uploaded Data in Bytes |
These counters populate for OCI and AWS data sinks configured with a Batch Window of greater than 60 seconds. Data sinks with this configuration are also described as "coarse granularity" or "large object" and are written differently than those with a per-second Batch Window.
|
|
Users - Failed Users - Filtered Users - Last Synced Users - Successful |
These counters help you keep track of how user records are being sent to the data sink. The Failed, Filtered, and Successful counts are all cumulative since the last time the Data Lake service started. You can add the Data Lake Uptime column to the display to see the last time the Data Lake service restarted.
|
Using Data Sink Table Columns for Troubleshooting
As a general rule, you can troubleshoot Data Sink issues by keeping an eye on the color-coded indicators in the Status column. If the Status indicator for a sink goes red, mouse over the entry in the Message column to examine the nature of the issues reported. Based on what you see in the Message column, add the counters in the table above corresponding to the problematic data type (assets, records, users, or raw data) to help you solve the issue.
